Crazy Color Cloud
- Indicators
- Igor Gerasimov
- Version: 2.2
- Updated: 10 April 2023
- Activations: 5
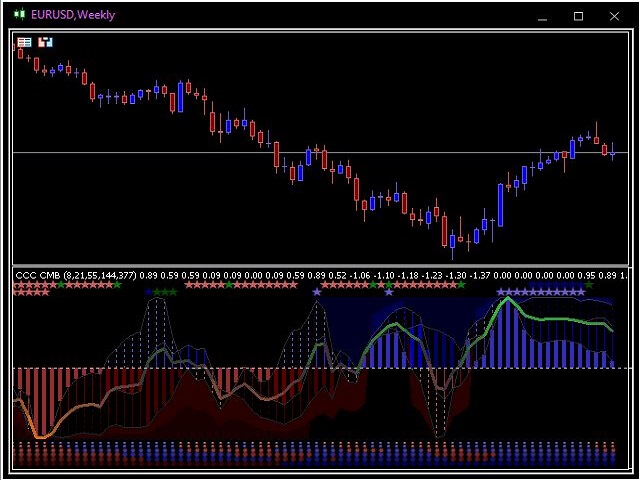
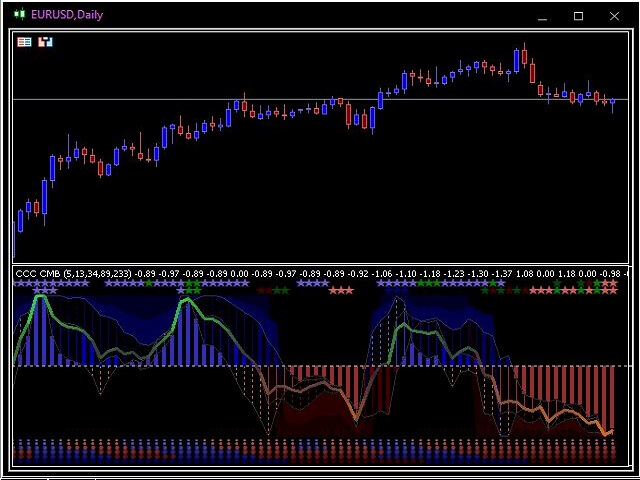
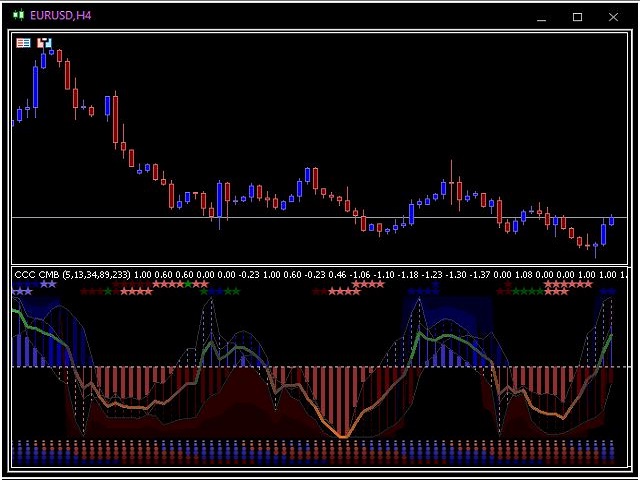
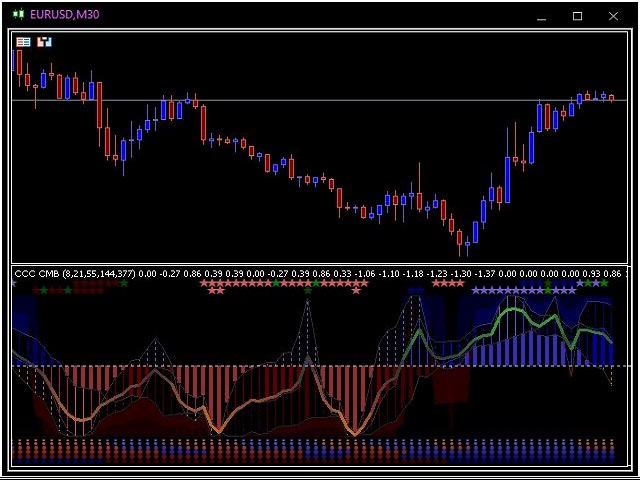
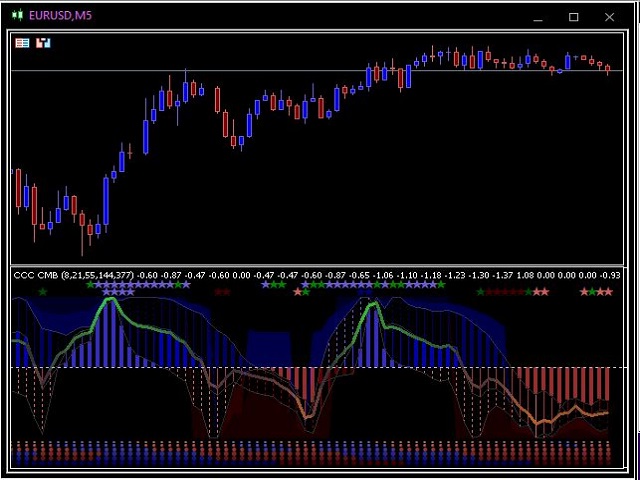
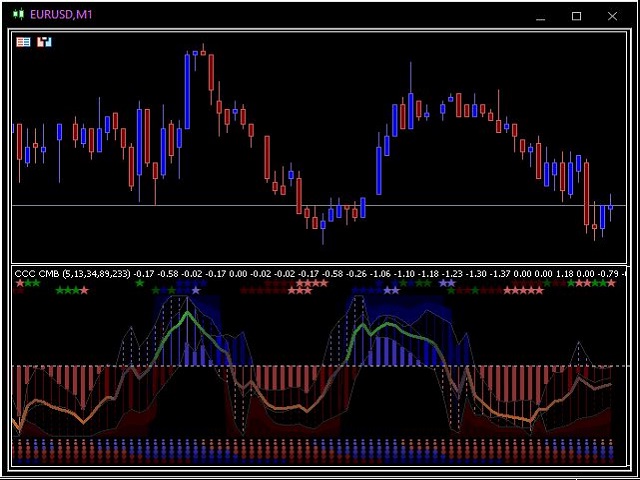
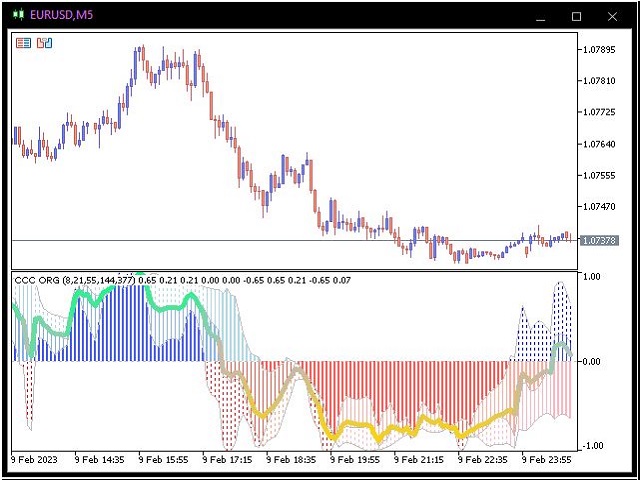
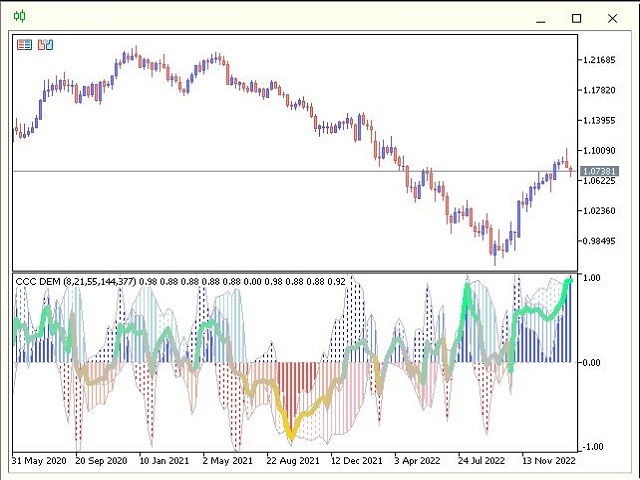
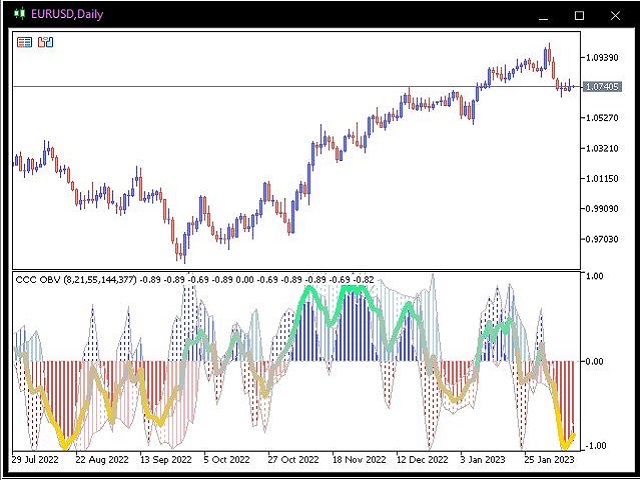
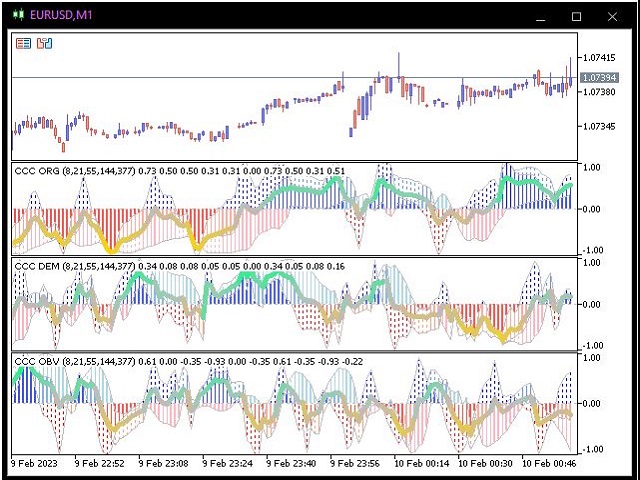
This indicator displays filtered price information
in the form of three colored histograms and one common colored line.
This is a very colorful and beautiful indicator.
Great for determining the strength and direction of price movement.
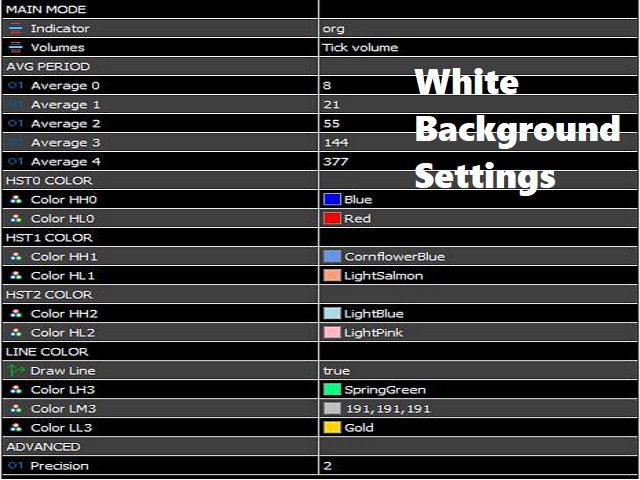
This indicator has very simple settings:
1) choice of three options for calculating the indicator:
- original,
- demarker,
- balance volume.
2) selection of five different periods.
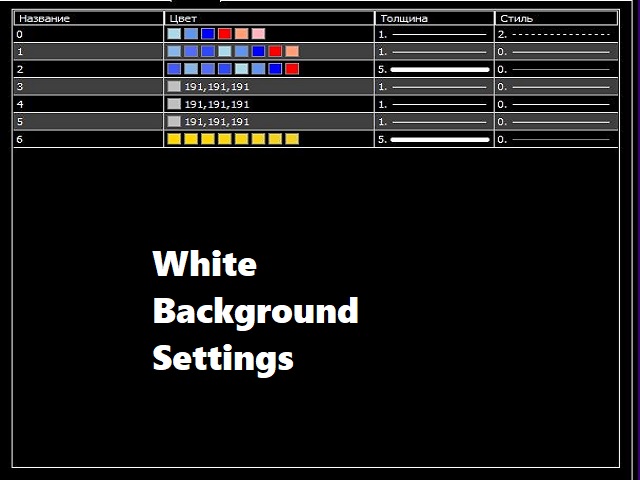
3) selection of the displayed color.
4) choice of accuracy.
///////////////////////////////////////////////////////////
I hope this indicator will be very useful to you in successful trading.
Good luck.