• Overview
  • Reviews (48)
  • Comments (81)
  • What's new

Smart Market Structure Concepts MT5

4.79

ICT, SMC, SMART MONEY CONCEPTS, SMART MONEY, Smart Money Concept, Support and Resistance, Trend Analysis, Price Action, Market Structure, Order Blocks, BOS/CHoCH, Breaker BlocksMomentum Shift, Supply&Demand Zone/Order Blocks, Strong Imbalance, HH/LL/HL/LH,  Fair Value Gap, FVG, Premium & Discount Zones, Fibonacci Retracement, OTE, Buy Side Liquidity, Sell Side Liquidity, BSL/SSL Taken, Equal Highs & Lows, MTF Dashboard, Multiple Time Frame, BigBar, HTF OB, HTF Market Structure,  Liquidity Voids, Long Wicks, Candle Timer, Fractals, ZigZag, Time Zone, Market Sessions, Asian Range, NY Midnight Open, NDOG, NWOG

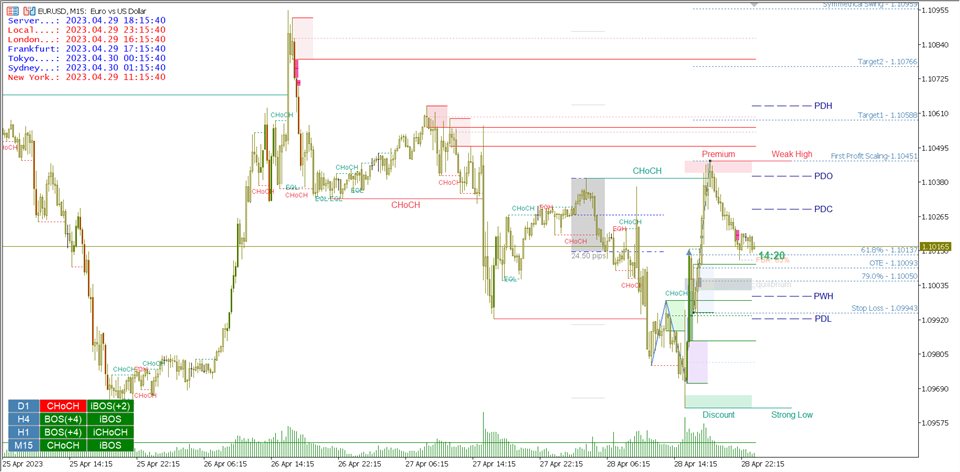
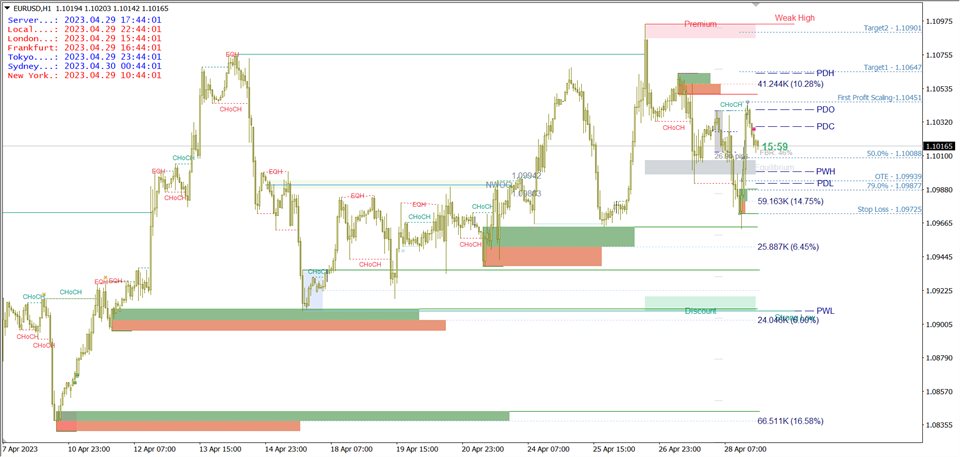
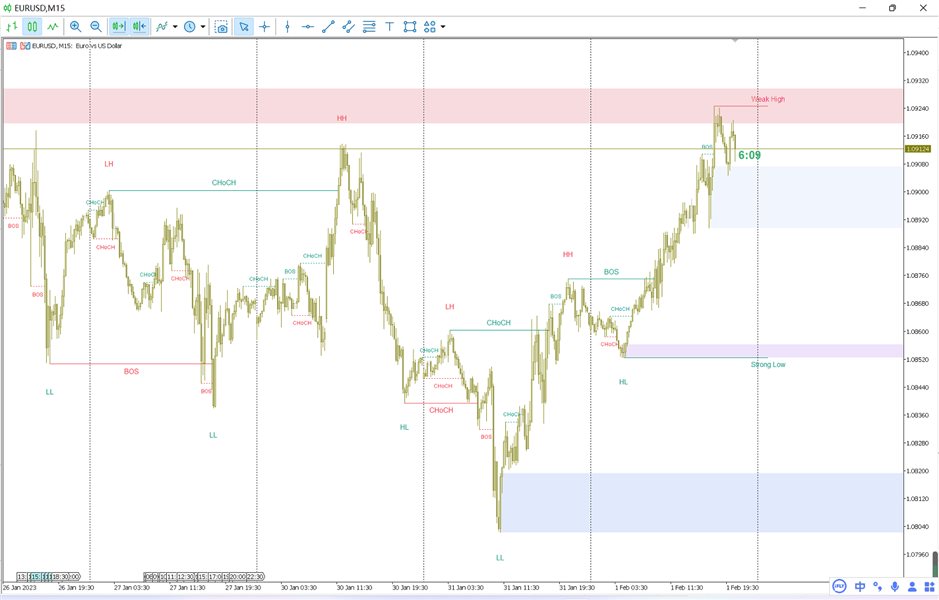
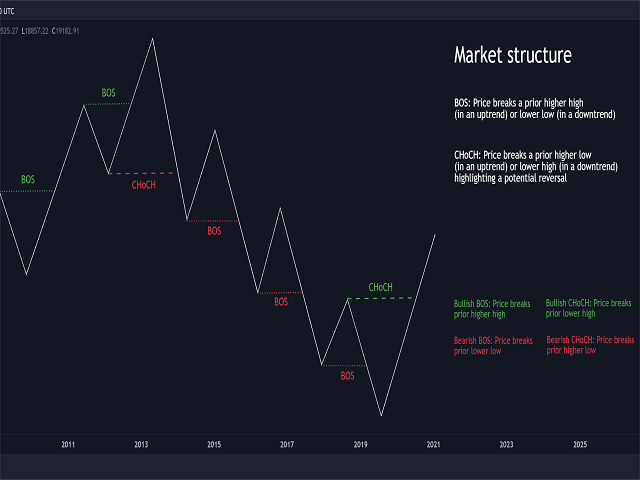
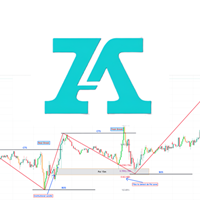
This all-in-one indicator displays real-time market structure (internal & swing BOS / CHoCH), order blocks, premium & discount zones, equal highs & lows, and much more...allowing traders to automatically mark up their charts with widely used price action methodologies. 

"Smart Money Concepts/Smart Market Structure Concepts" ( SMC ) is a fairly new yet widely used term amongst price action traders looking to more accurately navigate liquidity & find more optimal points of interest in the market. Trying to determine where institutional market participants have orders placed (buy or sell side liquidity) can be a very reasonable approach to finding more practical entries & exits based on price action.

This indicator contains alerts for almost all price characteristics, which you can set freely.

 (MT4 version here)

If you are not familiar with SMC trading, I have two materials here for you to study.

SMC Trading Part 1 - Common Abbreviations for SMC Concept & Multi-Time Frame Replay - Trading Systems - 9 April 2023 - Traders' Blogs (mql5.com)

Part 2, Part 3, Part 4, Part 5, Part 6,...

MARKET STRUCTURE AND POWERFUL SETUPS - Forex Market Price Action - Part 1 - Trading Systems - 10 April 2023 - Traders' Blogs (mql5.com)

Part 2, Part 3

This is my chart template for reference: Chart Template


Features

  • Full internal & swing market structure labeling in real-time
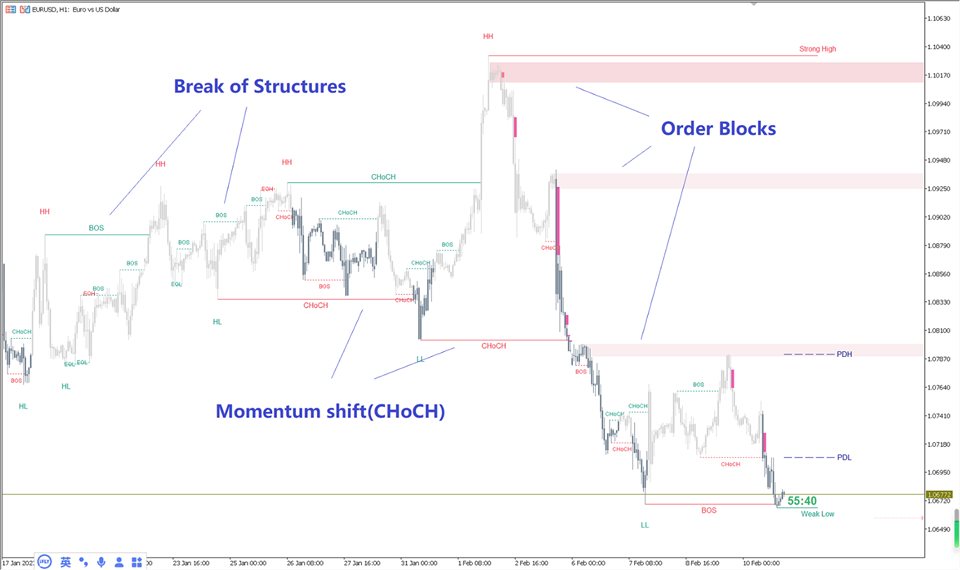
  • Break of Structure (BOS), Change of Character (CHoCH)/ Momentum shift (MS)
  • Support 3 types of breakthrough options
  • Order Blocks ( bullish & bearish ),  Order Blocks with Volume metrics
  • Swing Strong/Weak High/Low
  • Breaker Blocks labeling
  • Supply&Demand Zone/Order Blocks,  Strong Imbalance detection
  • High Timeframe ability. BigBar, HTF-BOS HTF-CHoCH HTF-OB HTF-Swing High/Low.
  • Multi-Timeframe Dashboard (Optional for 4 Period)
  • Fractal Points
  • Fibonacci Retracement/ Fibo OTE&Profit Target
  • BSL/SSL Taken Detect
  • Equal Highs & Lows
  • Fair Value Gap Detection,support high timeframe FVG display
  • Liquidity Voids , Volume Imbalance
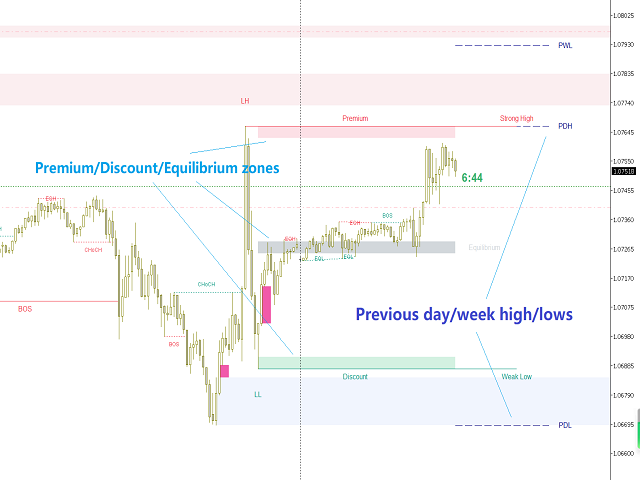
  • Previous Highs & Lows, Previous Open/Close
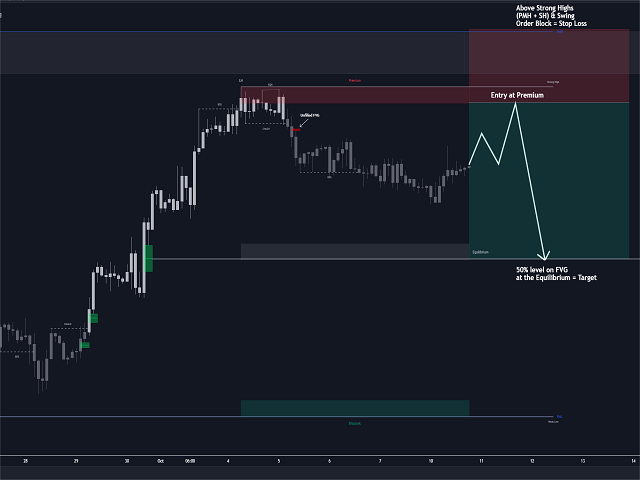
  • Premium & Discount Zones
  • Long Wicks detect
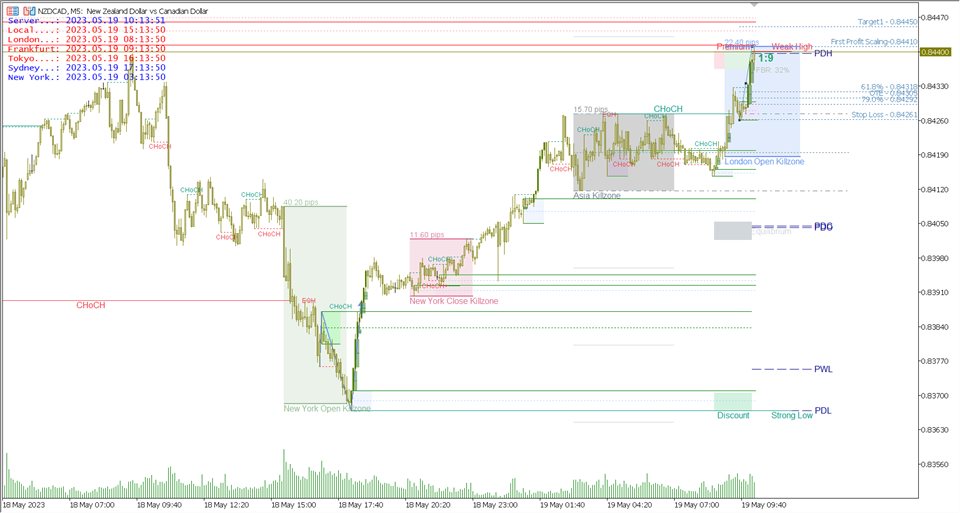
  • London/Frankfurt/Tokyo/Sydney/New York Market Time Zone
  • Asian Range, London Killzone, AM NY Killzone, PM NY Killzone
  • NY Midnight Open
  • NWOG/NDOG
  • Candle Timer
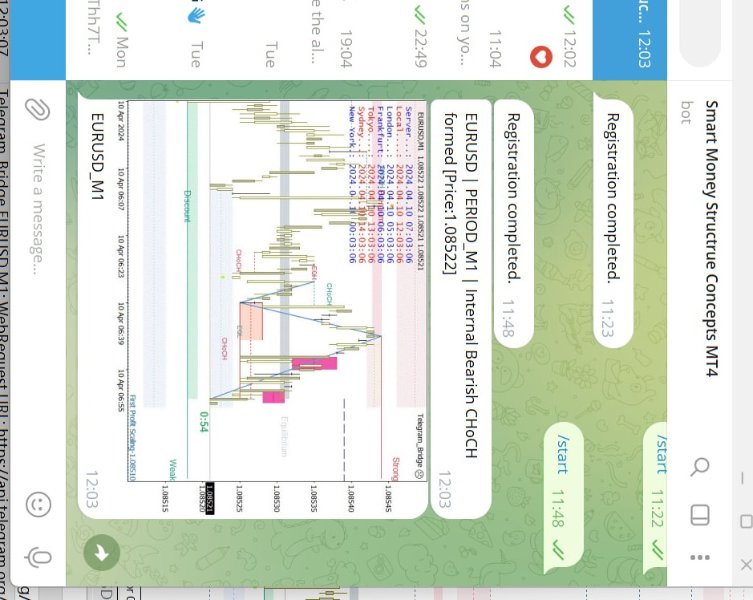
  • Alert for BOS CHoCH OB etc separately. Support setting to send Alert to mobile devices and Email.
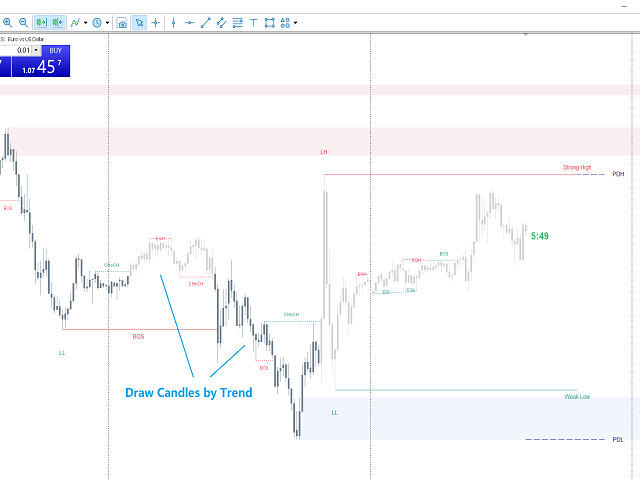
  • Draw Candles by trend(MT5 version only)

Settings: https://www.mql5.com/en/blogs/post/752900

Free Demo Test:  SMC Indicator MT4/MT5 Free Demo Test - YouTube

Instructions Part1SMC Indicator MT4/MT5 instructions part1 - YouTube

Instructions Part2  SMC Indicator MT4/MT5 instructions part2 - YouTube

Instructions Part3  SMC Indicator MT4/MT5 instructions part3 - YouTube


Reviews 20
KhalidAliBey
214
KhalidAliBey 2023.06.01 19:13 
 

This could have you Bossed UP with the new Silver Bullet vibes!

Dimluck
19
Dimluck 2023.05.31 18:31 
 

I been using this indicator for two months and i can say that: 1.One of the best indicator 2.Fast analysis of Market structure 3.Seller super responsive 4.Continuous upgrading keep it up Jing Bo Wu!!! your are creating a masterpiece.

DGSIXX
284
DGSIXX 2023.05.22 23:20 
 

Great indicator best on the market

Recommended products
Trend Fibonacci is a unique indicator that combines a power of Fibonacci sequences and ranges. How to read: - There are three zones --> red, gold and green - Red candlestick = downtrend - Green candlestick = uptrend   - Gold candlestick = no established trend Inputs: Per = number of bars used for calculations FirstRatio = first Fibonacci ratio (Or use any ratio you want) SecondRatio = second Fibonacci ratio (Or use any ratio you want) !! IF YOU PURCHASE THE INDICATOR, CONTACT ME FOR
47 USD
Your Trend Friend
Luigi Nunes Labigalini
The trend is your friend! Look at the color of the indicator and trade on that direction. It does not  repaint. After each candle is closed, that's the color of the trend. You can focus on shorter faster trends or major trends, just test what's most suitable for the symbol and timeframe you trade. Simply change the "Length" parameter and the indicator will automatically adapt. You can also change the color, thickness and style of the lines. Download and give it a try! There are big movements
99 USD
Premium level is a unique indicator with more than 80% accuracy of correct predictions! This indicator has been tested for more than two months by the best Trading Specialists! The author's indicator you will not find anywhere else! From the screenshots you can see for yourself the accuracy of this tool! 1 is great for trading binary options with an expiration time of 1 candle. 2 works on all currency pairs, stocks, commodities, cryptocurrencies Instructions: As soon as the red ar
1 100 USD
HMA Trend Professional MT5
Pavel Zamoshnikov
4.4 (5)
Improved version of the free HMA Trend indicator (for MetaTrader 4) with statistical analysis. HMA Trend is a trend indicator based on the Hull Moving Average (HMA) with two periods. HMA with a slow period identifies the trend, while HMA with a fast period determines the short-term movements and signals in the trend direction. The main differences from the free version: Ability to predict the probability of a trend reversal using analysis of history data. Plotting statistical charts for analyz
30 USD
Scalper Pivot
Yosi Malatta Madsu
Scalper Pivot detects respectable small reversal areas that can be used to mark repeatable opportunity windows. Originally made for M1 timeframe. Setup/inputs: First, set one pip on price, e.g. EURUSD to 0.0001, or XAUUSD to 0.1. Set minimum and maximum range on pips, if you want scalp between 10 to 20 pips then set it to 10 and 20 respectively. Set detection window to any candle count you want. Set it too low or too high would be less accurate.
799 USD
Volality Index Scalper
Lesedi Oliver Seilane
Volality Index scalper indicator  Meant for Volality pairs such as Volality 10, 25, 50, 75 and 100 The indicator works on all timeframes from the 1 minute to the monthly timeframe the indicator is non repaint the indicator has 3 entry settings 1 color change on zero cross 2 color change on slope change 3 color change on signal line cross Orange line is your sell signal Blue line is your buy signal.
35 USD
PZ Mean Reversion MT5
PZ TRADING SLU
1 (2)
Unique indicator that implements a professional and quantitative approach to mean reversion trading. It capitalizes on the fact that the price diverts and returns to the mean in a predictable and measurable fashion, which allows for clear entry and exit rules that vastly outperform non-quantitative trading strategies. [ Installation Guide | Update Guide | Troubleshooting | FAQ | All Products ] Clear trading signals Amazingly easy to trade Customizable colors and sizes Implements performance st
175 USD
This tool monitors MACD indicators on all time frames in the selected markets. Displays a table with signals to open a BUY trade (green) or SELL trade (red). You can set the conditions for the signal. You can easily add or delete market names / symbols. If the conditions for opening a trade on multiple time frames are met, you can be notified by e-mail or phone message (according to the settings in MT5 menu Tools - Options…) You can also set the conditions for sending notifications. The list of
49 USD
LT Price Reversal
Sie Samuel Roland Youl
0This indicator put some buy and sell arrows on the chart, to indicate when to open trade signals are based on the 7 Different indicators, those indicators are divided into two categories :  Main Signals: All Signals two most popular trading indicators RSI and MACD. except for their popularity, We have used those two indicators because they have a high Win Rate.  Filter Signals: When you are trading a Reversal strategy, and when the trend is deep(strong), you will time to time get early trade si
100 USD
US30NinjaMT5
Satyaseelan Shankarananda Moodley
US30 Ninja is a 5 minute scalping indicator that will let know you when there is a trade set up (buy or sell). Once the indicator gives the trade direction, you can open a trade and use a 30 pip stop loss and a 30 pip to 50 pip take profit. Please trade at own own risk. This indicator has been created solely for the US30 market and may not yield positive results on any other pair. 
30 USD
Noize Absorption Index - is the manual trading system that measures the difference of pressure between bears forces and bulls forces. Green line - is a noize free index that showing curent situation. Zero value of index shows totally choppy/flat market.Values above zero level shows how powerfull bullish wave is and values below zero measures bearish forces.Up arrow appears on bearish market when it's ready to reverse, dn arrow appears on weak bullish market, as a result of reverse expectation.
199 USD
Modified Rainbow
Rafael Alejandro Rey Alves
Modified Rainbow   The Modified Rainbow indicator is intended to work in different scenarios. The indicator uses a combination of technical indicators to detect buy or sell opportunities (different Moving Averages and other technical indicators). The indicator works with any currency pair, stocks, cryptocurrencies and synthetic indices. The indicator can be used for both traditional trading and binary options. The indicator works with any time frame, from M1 to MN. When the blue arrow
30 USD
Perfect Sniper
Ignacio Agustin Mene Franco
Perfect Sniper! is a triple indicator with support resistance detection, downtrend channel, uptrend channel Bands included! where he hunts the rebounds in the red lines for sale, in the green lines mark purchase, in the lower bands that are the breaks gives another second entry either buy or sell, perfect to take advantage of the double entrance, It is used in any temporality, It is used to scalp and long on h1 or h4 to D1. It works for Forex markets, All pairs. It is used for the synthetic inde
100 USD
Be notified of every color change of Heiken Ashi (HA) candles. The indicator will trigger past and new signals every time that HA candles change their colors. ( Note : this tool is based on the code of Heiken Ashi indicator developed by MetaQuotes Software Corp.) Features The signals are triggered at closing of last bar/opening of a new bar; Any kind of alerts can be enabled: Dialog Box, Email message, SMS notifications for smartphones and tablets, and Sound alerts; By default, up arrows are p
35 USD
Supply Demand Ranger
Krzysztof Janusz Stankiewic
The indicator draws supply and demand zones. The zone timeframe is set independently of the chart timeframe. It is possible for instance to set the M5 zones on the H4 chart. The importance of zones can be adjusted with the zone strength parameter. Demand zones are displayed if at least one candle in the range of the zone will be entirely above the zone. Respectively, supply zones are displayed if at least one candle within the zone will be entirely below the zone.
30 USD
Relative Cyclicality
Cristian Mihail Pauna
The Relative Cyclicality indicator defines the cycles of any price evolution. This indicator is computed by applying the "Cyclicality" mathematical transformation to the classic Relative Strength Index indicator made by J. Welles Wilder. The Relative Cyclicality defines very good entry and exit trading signals near the minimal and maximal points. It is better than RSI itself due to the unicity of the minimal and maximal points on a specific time interval. The Relative Cyclicality indicator can b
600 USD
This MT5 indicator has been designed to be used on any currency pair and any time frame . It has the scalper and swing trader in mind.  The indicator looks for short-term high-probability reversals in price and will indicate to you to go long (buy) or short (sell) if you see a green or red arrow next to the current candlestick respectively. The indicator provides the best trading opportunities to you during the active trading hours of London and New York, but it will continue to give signals al
199 USD
PipFinite Trend PRO MT5
Karlo Wilson Vendiola
4.86 (657)
Breakthrough Solution For Trend Trading And Filtering With All Important Features Built Inside One Tool! Trend PRO's smart algorithm detects the trend, filters out market noise and gives entry signals with exit levels. The new features with enhanced rules for statistical calculation improved the overall performance of this indicator. Important Information Revealed Maximize the potential of Trend Pro, please visit www.mql5.com/en/blogs/post/713938 The Powerful Expert Advisor Version Automa
98 USD
Purchase this indicator and get the Beast Super Signal EA MT4 version worth $449 for FREE!    (Full product purchase only). Looking for a powerful forex trading indicator that can help you identify profitable trading opportunities with ease? Look no further than the Beast Super Signal. This easy-to-use trend-based indicator continuously monitors the market conditions, searching for new developing trends or jumping in on existing ones. The Beast Super Signal gives a buy or sell signal when all
199 USD
Magic Finger can help you identify trends and trading opportunities clearly. The finger points to the open position signal, and the discoloration line is confirmed by the trend. If you are a day trader, you can choose to trade during a period of active trading, referring to the discoloration line as the basis for the next order, finger signal as a filter. If you are a trend trader, you can choose a period above H1, wait for the appearance of the finger signal in the key price area, and enter
188 USD
WanaScalper
Isaac Wanasolo
1 (1)
A scalping indicator based on mathematical patterns, which on average gives signals with relatively small SL, and also occasionally helps to catch big moves in the markets (more information in the video) This indicator has three main types of notifications: The first type warns of a possible/upcoming signal on the next bar The second type indicates the presence of a ready signal to enter the market/open a position The third type is for SL and TP levels - you will be notified every time price r
1 350 USD
PZ Trend Trading MT5
PZ TRADING SLU
3.67 (3)
Trend Trading is an indicator designed to profit as much as possible from trends taking place in the market, by timing pullbacks and breakouts. It finds trading opportunities by analyzing what the price is doing during established trends. [ Installation Guide | Update Guide | Troubleshooting | FAQ | All Products ] Trade financial markets with confidence and efficiency Profit from established trends without getting whipsawed Recognize profitable pullbacks, breakouts and early reversals The ind
175 USD
Oscillator trading signals - это динамический индикатор, определяющий состояние к продолжению тенденции роста или падению цены торгового инструмента и отсечению зон с нежелательной торговлей. Индикатор состоит из 2 линий осцилляторов. Медленная и быстрая сигнальная линия.  Шкала отображения перевернутая. Зоны вблизи 0 свидетельствуют о тенденции роста цены валютной пары. Зоны -100 свидетельствуют о падении цены валютной пары. На основном графике в виде стрелок отображается потенциально выгодные
50 USD
MT5 indicators. Three levels of Fibonacci support and resistance levels are automatically drawn. They are: Month Level: Medium Orchid Weekly level: Orange Red Dayline level: Turquoise Color can be adjusted by parameters. This indicator is mainly used to analyze future support and resistance levels for better trade analysis. If the support level is effectively supported for many times, the market will break through the previous high point, and the effective trend breakout will be lon
40 USD
Provided Trend is a complex signal formation indicator. As a result of the work of internal algorithms, you can see only three types of signals on your chart. The first is a buy signal, the second is a sell signal, and the third is a market exit signal. Options: CalcFlatSlow - The first parameter that controls the main function of splitting the price chart into waves. CalcFlatFast - The second parameter that controls the main function of splitting the price chart into waves. CalcFlatAvg - Par
100 USD
Tools for earning and research. The core of the trading signals and strategy is based on the author's algorithm for the formation of price forecasting patterns. Applicable to any instrument! Supplemented with a control system based on the MA "Nine-Tailed Fox" , updating and adjusting the signal as accurately as possible for the market, instrument and period of work. Eligible: All instruments in all markets (there are exceptions). Who it's for: hedge funds, fund and asset managers, investment
25 920 USD
This indicator will show you the TP and SL Values (in that currency) that you already set  for every orders on the charts  ( closed to the transaction/order line)  that will help you a lot to estimated your profit and loss for every order.    And it also show you the PIPs values too.  the shown format  is      " Currency Values of our Profit or Loss /  PIPs values ".    The TP Value will be shown in Green Color and  the SL Value  will be shown in Red Color.  For any question or more information,
99 USD
Price reach indicator. It also serves as the perfect term for supports and resistance. I use it in two experts. The basic tool for professional trading. The indicator analyzes the last 500 bar and uses this to determine the levels ( but it doesn't predict the future ) . Personally, I use it on TF H1.  It is very simple. Four lines on chart and that's all. Only two input parameters.  Thousands of indicators. Why this? Is good ? No! Is very good. Please test the indicator prior to purchasing. You
49 USD
A visualization system for favorite candlesticks price action patterns. Once attached, indicator will automatically mark next patterns on the chart: Pinocchio bar  - a small-body bar with a long 'nose', very well-known reverse pattern; Inside bar  - a bar whose range lies inside the range of the previous bar. It represents market incertitude; Outside bar  - a bar whose range exceeds the range of the previous bar. It represents market incertitude; Rails pattern  - two consequent opposite bars wit
30 USD
Alpha Binary Pro
Rafael Alejandro Rey Alves
1 (1)
The Alpha Binary Pro indicator is intended to work in different scenarios. This indicator uses a combination of technical indicators to detect buy or sell opportunities. The indicator works with any currency pair, stocks, cryptocurrencies and synthetic indices. The indicated can be used for both traditional trading and binary options. The indicator works with any time frame, from M1 to MN. When the blue arrow is pointing upwards this indicates that the signal is to buy. When the red
30 USD
Buyers of this product also purchase
Top indicator for MT5   providing accurate signals to enter a trade without repainting! It can be applied to any financial assets: forex, cryptocurrencies, metals, stocks, indices .  MT4 version is here It will provide pretty accurate trading signals and tell you when it's best to open a trade and close it. Watch  the video  (6:22) with an example of processing only one signal that paid off the indicator! Most traders improve their trading results during the first trading week with the help of
125 USD
Matrix Arrow Indicator MT5
Juvenille Emperor Limited
5 (11)
Matrix Arrow Indicator MT5  is a unique 10 in 1 trend following   100% non-repainting  multi-timeframe indicator that can be used on all symbols/instruments:   forex,   commodities,   cryptocurrencies,   indices,   stocks .  Matrix Arrow Indicator MT5  will determine the current trend at its early stages, gathering information and data from up to 10 standard indicators, which are: Average Directional Movement Index (ADX) Commodity Channel Index (CCI) Classic Heiken Ashi candles Moving Aver
75 USD
TPA True Price Action indicator reveals the true price action of the market makers through 100% non-repainting signals strictly at the close of a candle! TPA shows entries and re-entries, every time the bulls are definitely stronger than the bears and vice versa. Not to confuse with red/green candles. The shift of power gets confirmed at the earliest stage and is ONE exit strategy of several. There are available now two free parts of the TPA User Guide for our customers. The first "The Basics"
168 USD
Advanced Supply Demand MT5
Bernhard Schweigert
4.36 (11)
Best Solution for any Newbie or Expert Trader! This indicator is a unique, high quality and affordable trading tool because we have incorporated a number of proprietary features and a new formula. With this update, you will be able to show double timeframe zones. You will not only be able to show a higher TF but to show both, the chart TF, PLUS the higher TF: SHOWING NESTED ZONES. All Supply Demand traders will love it. :) Important Information Revealed Maximize the potential of Advanced Suppl
199 USD
Blahtech Supply Demand MT5
Blahtech Limited
4.45 (11)
Supply Demand uses previous price action to identify potential imbalances between buyers and sellers. The key is to identify the better odds zones, not just the untouched ones. Blahtech Supply Demand indicator delivers functionality previously unavailable on any trading platform. This 4-in-1 indicator not only highlights the higher probability zones using a multi-criteria strength engine, but also combines it with multi-timeframe trend analysis, previously confirmed swings and engulfing detecto
99 USD
Market Profile defines a number of day types that can help the trader to determine market behaviour. A key feature is the Value Area, representing the range of price action where 70% of trading took place. Understanding the Value Area can give traders valuable insight into market direction and establish the higher odds trade. It is an excellent addition to any system you may be using. Blahtech Limited presents their Market Profile indicator for the MetaTrader community. Inspired by Jim Dalton’s
99 USD
Owl Smart Levels MT5
Sergey Ermolov
5 (7)
Indicator Guide   |   Owl Smart Levels Strategy   |   MT4 version  |  How to install?   |   FAQ The Owl Smart Levels Indicator is a complete trading system within the one indicator that includes such popular market analysis tools as Bill Williams' advanced fractals , Valable ZigZag which builds the correct wave structure of the market, and Fibonacci levels which mark the exact levels of entry into the market and places to take profits. For a detailed description of the trading system, see the a
97 USD
XQ Indicator MT5
Marzena Maria Szmit
5 (1)
The signal conditions are a combination of three indicators, and XQ Forex Indicators only display  medium and long-term trends . The indicator's efficacy has been improved with the addition of a filter that blocks out false signals. The XQ Forex Indicator can be used on  FX pairs, CFDs, and Cryptocurrencies . There are two type of signals:  Buy or Sell and Big Long or Big Short It is possible to enable sending emails when a major trend-change signal is detected, as well as to display the alerts
179 USD
Introduction to X3 Chart Pattern Scanner X3 Cherart Pattern Scanner is the non-repainting and non-lagging indicator detecting X3 chart patterns including Harmonic pattern, Elliott Wave pattern, X3 patterns, and Japanese Candlestick patterns. Historical patterns match with signal patterns. Hence, you can readily develop the solid trading strategy in your chart. More importantly, this superb pattern scanner can detect the optimal pattern of its kind. In addition, you can switch on and off individu
250 USD
Introduction to EFW Analytics EFW Analytics was designed to accomplish the statement "We trade because there are regularities in the financial market". EFW Analytics is a set of tools designed to maximize your trading performance by capturing the repeating fractal geometry, known as the fifth regularity in the financial market. The functionality of EFW Analytics consists of three parts. Firstly, Equilibrium Fractal Wave Index is an exploratory tool to support your trading logic to choose which r
200 USD
Setups 9 Larry Williams
Luigi Nunes Labigalini
Buy and sell signals based on Larry Williams's exponential moving average strategies 9.1, 9.2, 9.3 and 9.4 for trend reversals and continuations. To understand the logic and how to trade the signals, please check: Setup 9.1:  https://www.mql5.com/pt/market/product/50986 Setup 9.2:  https://www.mql5.com/pt/market/product/52268 Setup 9.3:  https://www.mql5.com/pt/market/product/52269 Setup 9.4:  https://www.mql5.com/pt/market/product/52273 Notices:  - This indicator displays a lot of signals.
199 USD
FX Power MT5
Daniel Stein
4.3 (23)
Get your daily market update with details and screenshots via our Morning Briefing  here on mql5  and  on Telegram ! Do you want to become a constantly profitable 5-star forex trader? Then  get our Stein Investments trading tools  and send us a screenshot to get your personal invitation to our exclusive trading chat with 500+ members. FX Power   is the first currency strength meter with a complete history across all time frames. It analyzes the momentum and strength of all major currencies
66 USD
Stargogs Spike Catcher
Lorenzo Edward Beukes
5 (6)
Stargogs Spike Catcher V3.11 This Indicator is Developed To milk the BOOM and CRASH indices . Send me Message if you need any help with the indicator.  CHECK OUT THE STARGOGS SPIKE CATCHER EA/ROBOT V3: CLICK HERE ALSO CHECK OUT SECOND TO NONEFX SPIKE CATCHER:   CLICK HERE STARGOGS SPIKE CATCHER V3.11 WHATS NEW! Brand New Strategy. This is the Indicator you need for 2023. The Indicator Gives you an Entry at a time when conditions are met and you should use TP & SL. New Trendline that changes col
100 USD
Introduction to Fractal Pattern Scanner Fractal Indicator refers to the technical indicator that makes use of the fractal geometry found in the financial market. Fractal Pattern Scanner is the advanced Fractal Indicator that brings the latest trading technology after the extensive research and development work in the fractal geometry in the financial market. The most important feature in Fractal Pattern Scanner is the ability to measure the turning point probability as well as the trend probabil
185 USD
ACB Breakout Arrows MT5
KEENBASE SOFTWARE SOLUTIONS
5 (1)
The ACB Breakout Arrows indicator provides a crucial entry signal in the market by detecting a special breakout pattern. The indicator constantly scans the chart for a settling momentum in one direction and provide the accurate entry signal right before the major move. Get multi-symbol and multi-timeframe scanner from here - Scanner for ACB Breakout Arrows MT 5 Key features Stoploss   and Take Profit levels are provided by the indicator. Comes with a MTF Scanner dashboard which tracks the br
145 USD
MetaBands M5
Vahidreza Heidar Gholami
5 (2)
MetaBands uses powerful and unique algorithms to draw channels and detect trends so that it can provide traders with potential points for entering and exiting trades. It’s a channel indicator plus a powerful trend indicator. It includes different types of channels which can be merged to create new channels simply by using the input parameters. MetaBands uses all types of alerts to notify users about market events. Features Supports most of the channel algorithms Powerful trend detection algorith
129 USD
This indicator recognizes over 30 Japanese Candlestick Patterns and highlights them beautifully on the chart. It is simply one of those indicators price action traders can't live without. Boost your technical analysis overnight Detect japanese candlestick patterns easily Trade reliable and universal reversal patterns Hop onto established trends safely using continuation patterns The indicator is non-repainting and implements alerts The indicator implements a multi-timeframe dashboard It detects
99 USD
Royal Scalping Indicator M5
Vahidreza Heidar Gholami
5 (8)
Royal Scalping Indicator is an advanced price adaptive indicator designed to generate high-quality trading signals. Built-in multi-timeframe and multi-currency capabilities make it even more powerful to have configurations based on different symbols and timeframes. This indicator is perfect for scalp trades as well as swing trades. Royal Scalping is not just an indicator, but a trading strategy itself. Features Price Adaptive Trend Detector Algorithm Multi-Timeframe and Multi-Currency Trend Low
149 USD
Royal Wave Pro M5
Vahidreza Heidar Gholami
3.67 (3)
Royal Wave is a Trend-Power oscillator which has been programmed to locate and signal low-risk entry and exit zones. Its core algorithm statistically analyzes the market and generates trading signals for overbought, oversold and low volatile areas. By using a well-designed alerting system, this indicator makes it easier to make proper decisions regarding where to enter and where to exit trades. Features Trend-Power Algorithm Low risk Entry Zones and Exit Zones Predictions for Overbought and Over
129 USD
PZ Swing Trading MT5
PZ TRADING SLU
5 (4)
Swing Trading is the first indicator designed to detect swings in the direction of the trend and possible reversal swings. It uses the baseline swing trading approach, widely described in trading literature. The indicator studies several price and time vectors to track the aggregate trend direction and detects situations in which the market is oversold or overbought and ready to correct. [ Installation Guide | Update Guide | Troubleshooting | FAQ | All Products ] Profit for market swings with
175 USD
Short description : TAMA is, at its core, a novel method for correcting moving averages (MAs) during trends. | This usually also results in better smoothing and a significantly lower time delay (lag) of the MAs. | The indicator can additionally be used for price forecasts and band formation, also combined. | TAMA received an award from VTAD in 2022. | Honored with the VTAD Award 2022 (VTAD = Association of Technical Analysts Germany, German branch of IFTA).   Core Features : Classic MAs
99 USD
WAPV Full MT5
Eduardo Da Costa Custodio Santos
## If you are unable to use the demo version, please contact us by message. ## Operate professionally using WAPV Full and be able to track where is the big players money Imagine you have in your hands a tool that alone does the reading of the major Market Players, showing the best trading regions based on Price and Volume analysis. WAPV Full is a complete tool, 100% focused on R. Wyckoff's operational In addition to mapping market movements in trading waves, it also maps the Market by reading P
199 USD
Hunting Trend MT5
Claudia Ramona Angerer
5 (11)
75% discount only for the first 5 buyers (3 left), main price: 300 $ Show the signal as a line graph Prediction of 10 future candles and advanced display Prediction of individual candles graphically Can be used in the gold symbol Can be used in 15 minutes time frame How the indicator works: Using complex mathematical calculations, it predicts the future 10 candles. The predictions of this indicator are based on price. Therefore, it can predict each candle separately But it is better to
75 USD
ToolBox 360 is the swiss knife of all indicators. It is full packed with useful tools to help you with your trading. It can be used to find best entry and exit points and help you to decide if you should open a trade or not. It shows market trends, candlestick formations outside / inside bars and you can sett time based allerts. Main features: Time based Fibonacci lines Choose a start and end time and the indicator shows you Fibonacci lines within the selected time range including range high
399 USD
Currency Strength Meter is the easiest way to identify strong and weak currencies. This indicator shows the relative strength of 8 major currencies + Gold: AUD, CAD, CHF, EUR, GBP, JPY, NZD, USD, XAU. Gold symbol can be changed to other symbols like XAG, XAU etc. By default the strength value is normalised to the range from 0 to 100 for RSI algorithm: The value above 60 means strong currency; The value below 40 means weak currency; This indicator needs the history data of all 28 major currenc
78 USD
Anchored VWAP with Alert MT5
Trade The Volume Waves Single Member P.C.
What is the Volume Weighted Average Price (VWAP)? The volume weighted average price (VWAP) is a trading benchmark used by traders that gives the average price an instrument has traded at throughout the day, based on both volume and price.  It is important because it provides traders with insight into both the trend and value of the instrument. What is the Difference between VWAP and AVWAP? While VWAP is having as starting point the beggining of the day,week,month etc. in the AVWAP you can p
80 USD
(FOR MT5)  Divergence Scanner Multi Pair And Multi Time Frame :   This indicator has been designed to automatically identify when a divergence occurs between price and an oscillator. It can identify both bull and bear divergence and it is already loaded with four of the most popular oscillators. You can choose from RSI, MACD, Stochastics and CCI. IMPORTANT FACTORS TO KEEP IN MIND: When a divergence occurs, it means that price and momentum are not in agreement. And divergence signals are widel
79 USD
Ichimoku Map (instant look at the markets) - built on the basis of the legendary Ichimoku Kinko Hyo indicator. The task of the Ichimoku Map is to provide information about the market strength on the selected time periods and instruments, from the point of view of the Ichimoku indicator. The indicator displays 7 degrees of buy signal strength and 7 degrees of sell signal strength. The stronger the trend, the brighter the signal rectangle in the table. The table can be dragged with the mouse. T
77 USD
Tired of plotting support and resistance lines? This is a multi-timeframe indicator that detects and plots supports and resistance lines in the chart with the same precision as a human eye would. As price levels are tested over time and its importance increases, the lines become thicker and darker, making price leves easy to glance and evaluate. [ Installation Guide | Update Guide | Troubleshooting | FAQ | All Products ] Boost your technical analysis Customizable timeframe selection Read pri
125 USD
Every indicator has its advantages and disadvantages. Trending ones show good signals during a trend, but lag during a flat. Flat ones thrive in the flat, but die off as soon as a trend comes. All this would not be a problem, if it was easy to predict when a flat changes to a trend and when a trend changes to a flat, but in practice it is an extremely serious task. What if you develop such an algorithm, which could eliminate an indicator's flaws and enhance its strengths? What if such an algorit
70 USD
More from author
ICT, SMC, SMART MONEY CONCEPTS, SMART MONEY, Smart Money Concept, Support and Resistance, Trend Analysis, Price Action, Market Structure, Order Blocks, BOS/CHoCH,   Breaker Blocks ,  Momentum Shift, Supply&Demand Zone/Order Blocks , Strong Imbalance, HH/LL/HL/LH,    Fair Value Gap, FVG,  Premium  &   Discount   Zones, Fibonacci Retracement, OTE, Buy Side Liquidity, Sell Side Liquidity, BSL/SSL Taken, Equal Highs & Lows, MTF Dashboard, Multiple Time Frame, BigBar, HTF OB, HTF Market Structure,  L
65 USD
Trade History for MT4  This indicator is specially developed for that traders want to display his trades on the charts. Shows history and current deals on the chart. Trades show on the chart with a dotted line, and profit will show realtime. Buy trades are displayed in bull color, Sell trades in bear color. Tip: The historical order displayed by the indicator is associated with the "Account History", so please set the historical order display in the "Account History" of MT software. If yo
FREE
This is a derivative of John Carter's "TTM Squeeze" volatility indicator, as discussed in his book "Mastering the Trade" (chapter 11). Gray  dot on  the midline show that the market just entered a squeeze (Bollinger Bands are with in Keltner Channel). This signifies low volatility, market preparing itself for an explosive move (up or down). Blue dot signify "Squeeze release". Mr.Carter suggests waiting till the first blue after a gray dot, and taking a position in the direction of the mo
FREE
Filter:
KhalidAliBey
214
KhalidAliBey 2023.06.01 19:13 
 

This could have you Bossed UP with the new Silver Bullet vibes!

Dimluck
19
Dimluck 2023.05.31 18:31 
 

I been using this indicator for two months and i can say that: 1.One of the best indicator 2.Fast analysis of Market structure 3.Seller super responsive 4.Continuous upgrading keep it up Jing Bo Wu!!! your are creating a masterpiece.

Jing Bo Wu
6536
Reply from developer Jing Bo Wu 2023.05.31 18:36
Thank you Dimluck. The tagging algorithm of Market Structure is not perfect enough, and I am considering how to make it accurately and perfectly.
Chris Kwon
43
Chris Kwon 2023.05.24 00:34 
 

powerful tool however, simple is always better. too many objects can be distracting

Jing Bo Wu
6536
Reply from developer Jing Bo Wu 2023.05.30 08:25
What you said makes sense, the road is as simple as possible. The main purpose of providing so many functions for indicators is to meet different needs of traders, and the functions used by each person's trading system may be different. So the indicators provide a lot of functions and give each function a separate switch. You just need to turn on the function you need.
C Franzener Fernando
67
C Franzener Fernando 2023.05.23 05:30 
 

Indicator with a lot of information, but little material to configure and understand the system. today the creator made an informative tutorial, just listing the functions, but still continuous with many doubts, acronyms that I do not know (PDB), can improve the information of settings that give better result, as I told the creator, it is no use having an airplane without manual, people who know the Smart Money strategy, has no need for an indicator, then it should further improve understanding.

Jing Bo Wu
6536
Reply from developer Jing Bo Wu 2023.05.30 08:29
What you said is reasonable. For traders who have just come into contact with SMC/ICT theory, I suggest learning the information I have provided. I will also slowly create explanatory videos so that more people can understand the SMC concepts corresponding to the setting items in the indicators.
DGSIXX
284
DGSIXX 2023.05.22 23:20 
 

Great indicator best on the market

Mctrading123
20
Mctrading123 2023.05.21 03:02 
 

No me permite poner la configuracion como tu imagen donde sale 26.06k de ordenes esas configuraciones no las tiene

Jing Bo Wu
6536
Reply from developer Jing Bo Wu 2023.05.21 10:34
Hi bro, if you have any setup issues, please send me a private message. Don't worry.
almheiri82
144
almheiri82 2023.05.20 08:42 
 

Extremely powerful tool and very useful for day traders. very satisfied with this indicator..the best in MQL5

Maicon Batista
36
Maicon Batista 2023.05.05 15:31 
 

could add language option 🙃

christian007
40
christian007 2023.05.02 10:10 
 

great work, best indikator for mt5 ;-) thank you

NoksMkhonza
27
NoksMkhonza 2023.04.30 16:22 
 

This is by far the best purchase I have ever made. I like this current version 9.4 with the new added features "OTE". Thank you very much for helping us to improve our trading skill.

Tyler Sanchez
408
Tyler Sanchez 2023.04.29 16:23 
 

The best I have seen in MQL5, the author is very attentive to suggestions, an indicator that has a lot of potential, I am excited to see how it will develop with updates, I can tell Jing is an excellent developer.

Darren V Hancock
143
Darren V Hancock 2023.04.25 12:28 
 

I am an ICT charter member and original 800.this indicator has some good features. You have clearly put in some great work here. I have noticed a few things though. The accuracy of Order Blocks is not correct, the thresholds are not inclusive of wicks and should be calculated on the body of the candle only, and the fib tool is not always pulling from the correct locations. One single pass through a FVG does not mean its done. If you could make it slowly deminish in color over a set number of passes that would be great. The liquidity voids are nice but the price imbalances (wicks only) should be noted and marked accordingly. I'd like to see and SMT tool overlay with alarm settings. Bearish and Bullish breakers would be great. This indicator has a lot of noise that isn't needed. IF these things I have mentioned were corrected, it would be a cool little indicator. Love the thought and the work that went into this. Is there any way this could be added to a bot to enhance semi auto trading?

Jing Bo Wu
6536
Reply from developer Jing Bo Wu 2023.04.25 12:46
Thank you for your evaluation. Unfortunately, my indicators did not meet your expectations. It is not as intelligent as humans and requires people to filter out some noise. If you have particularly good ICT/SMC related indicators, please recommend them to me so that I can learn about them.
BLAZE02
126
BLAZE02 2023.04.24 18:52 
 

Greetings Jing. Is it possible you include volume percentages for the Order Blocks. I guess it would be very useful in making an informed decision.

Jing Bo Wu
6536
Reply from developer Jing Bo Wu 2023.04.24 20:16
This feature is in the development plan
Henrique Ratao
292
Henrique Ratao 2023.04.24 08:47 
 

You're a legend! Masterpiece! I will buy it at the end of this rent month :)

Ubaldo Porto Lima
46
Ubaldo Porto Lima 2023.04.24 01:02 
 

Hello Jing Bo Wu, the indicator is very good, I started using it on Friday and I'm really enjoying it. I would like to know if there is any manual available, as it has some acronyms that I am not familiar with? Thank you very much, your work is of great value!!!

whitesaint
55
whitesaint 2023.04.20 22:01 
 

I purchased the tool 2days ago and it shows everything i have to see on the chart. Its such a powerful tool and i strongly recommend it to any serious trader

Roland Tradeorado
135
Roland Tradeorado 2023.04.13 16:34 
 

The indicator is an extremely useful tool and very well implemented. Unfortunately, I don't see how the MTF function would affect the chart - should I see a change in the chart by clicking on the fields?

Jing Bo Wu
6536
Reply from developer Jing Bo Wu 2023.04.13 16:54
Are you referring to the MTF Dashboard?
wisner86
20
wisner86 2023.04.10 14:06 
 

create order blocks with volume metric to find points of interest in market order block % + highest volume = point of interest

Coding2022MT4
55
Coding2022MT4 2023.04.06 13:11 
 

There are times the Fibo function is copied or appears twice forcing me to launch is several times, to clear the dublication. Could you check it out. Another thing is that during strong market volatility, the profit scaling and stop loss would be pressed over. Is that normal any way+ BECAUSE IT COULD BE MISLEADING AND RESULT INTO LOSSES. MAY CHANGE THE ALGORITHM SUCH AS FOR EXAMPLE WHEN FIRST PROFIT OR STOP LOSS IS TAKEN, THE ALGORITHM RECALCULATES AND SET NEWW FIRST PROFIT/ STOP LOSS LEVEL AND ERASES THE THE LAST ONE OR PREVIOUS ONE CONTUEOUSLY.

Jing Bo Wu
6536
Reply from developer Jing Bo Wu 2023.04.06 13:48
Thank you for your feedback. I will check for duplicate issues with fibo lines. At present, you can click on Fibo Line and right-click to delete duplicates without reloading the indicators.
pitpitrowski
917
pitpitrowski 2023.04.05 12:39 
 

Sehr gutes Produkt. Nur zu den Alarmen hätte ich einige Fragen

123
Reply to review
Version 10.6 2023.06.02
Resolve MTF dashboard function bugs caused by adding new features.

The market structure algorithm 2 can more accurately label the reversal of market structure. If you choose this algorithm, it is recommended to set the maxbars for structure smaller.
Version 10.5 2023.06.01
Add an algorithm for market structure, and the second algorithm strictly calculates and annotates according to the definition of market structure breakthroughs and reversals.
Version 10.4 2023.05.25
Modify some spelling errors in the settings and add an option to show or hide the strong high/low label.
Version 10.3 2023.05.19
Enable real-time updates of KILLZONE's high and low range.
Version 10.2 2023.05.18
Update Asia Killzone, London Killzone, New York Killzone, London Close Killzone, default to using standard definitions start and end times, the user can customize the start and end times.
Version 10.1 2023.05.17
Add London Killzone, AM New York Killzone, PM New York Killzone. Please set the start and end times for Killzone yourself.
Version 10.0 2023.05.16
Maxbars for swing and internal structures of MTF dashboard set to the current setting.
Version 9.9 2023.05.15
Implement CHoCH+ feature on the MTF dashboard.
Version 9.8 2023.05.10
Add Feature: Delete IMBs When filled.
Version 9.7 2023.05.08
Modify ZigZag algorithm.
Error modifying supply/demand zone.
Version 9.6 2023.05.05
Add Internal/Swing CHoCH+ formed alerts.
Version 9.5 2023.05.05
Add CHoCH+ Feature: When there is a formation of CHOCH, the structural high and low points do not break through the previous high and low points, and such CHOCH is labeled as CHOCH+.

Add more Style Options for PDL/PDH PWH/PWL PMH/PML PDC/PDO.
Version 9.4 2023.04.29
Add features of display internal OBs with volume metrics.
Version 9.3 2023.04.28
Fix a bug that labeling N-lines delay in the Breaker Blocks Feature.
Version 9.2 2023.04.27
Add Option for remove Asia Range Label text.
Add Style Options for PDHL/PDCO Lines.
Version 9.1 2023.04.27
Optimize and improve the Breaker blocks algorithm.
Version 9.0 2023.04.26
Add Breaker Blocks function and Breaker Blocks formed alert.
Version 8.9 2023.04.23
Add Volume Imbalance.
Optimize Asia Range function.
Version 8.8 2023.04.22
Modify Asian Range function:

Allow the start/end time of the Asian Range to be self-defined.
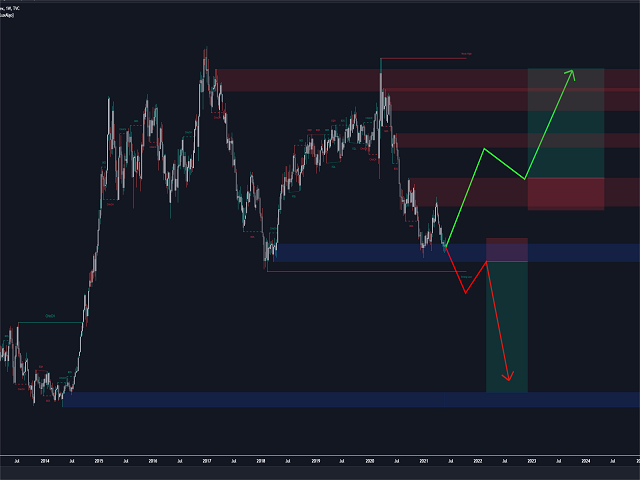
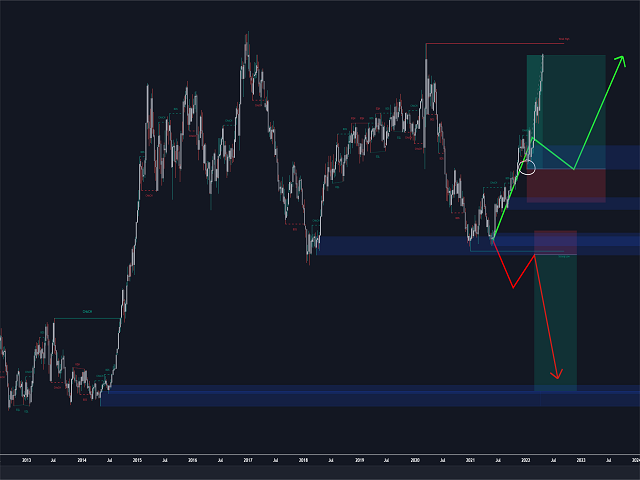
Add Prediction Lines for Price movement target.
Version 8.7 2023.04.19
Optimize the code to solve the problem of MTF Dashboard function slowing down the running speed of indicators.
Version 8.6 2023.04.19
Add Alerts for Bullish/Bearish OB formed.
Add Alerts for Supply/Demand OB formed.
Optimize some of the code.
Version 8.5 2023.04.18
Add Alerts for Price Touch Premium/Discount Zone.
Version 8.4 2023.04.18
Add Fibo-Retracement-OTE Alert.
Add Bullish/Bearish Strong Imbalance Alert.
Version 8.3 2023.04.17
Optimization structure breakthrough algorithm.
Add Strong Imbalance Detection and Labeling.
Version 8.2 2023.04.13
Applied the Structure Break Type settings to the HTF&MTF Dashboard.
Version 8.1 2023.04.11
Add 3 types of breakthroughs for internal structure and swing structure, the users can choose the type they want.
Version 8.0 2023.04.10
Add Supply&Demand OB Touch/Break Alert.
Version 7.9 2023.04.09
Add Supply&Demand Zone/OrderBlocks Detect. This function aims to identify areas of strong market imbalances and mark corresponding supply and demand regions.
Version 7.8 2023.04.04
Add OB Display Option: Display OB With Top-Bottom Lines.
Version 7.7 2023.04.01
Modify Fibo OTE function when the user double-click the fibo level line, the fibo level is taken out of program control, and only the user can modify and delete it.
Version 7.6 2023.03.31
Fix MTF Dashboard bugs(Sorry, this feature has caused a lot of bugs).
Version 7.5 2023.03.30
Add function for MTF Dashboard to display the number of consecutive BOS/iBOS occurrences.
Version 7.4 2023.03.30
Add option to change the style of the OB mean threshold.
Add FVG threshold for the users to filter out those too small and insignificant.
Rewrite the fractal point algorithm.
Fix some bugs.
Version 7.3 2023.03.29
Fix bug when setting True only for the Fibo OTE.
Version 7.2 2023.03.29
Fix the problem of FIBO repeatedly drawing lines.
Version 7.1 2023.03.28
Add Fibo levels for OTE and Profit target, the user can manually adjust the Fibo high and low points.
Version 7.0 2023.03.27
fix MTF Dashboard bug.
Version 6.9 2023.03.27
Add MTF Dashboard function.
Version 6.8 2023.03.24
Add HTF Premium&Discount Zone.
Add Option to extend NWOG/NDOG to current candle.
Version 6.7 2023.03.23
Add Options for internal structure and swing structures, user can set the label text size and line width.
Version 6.6 2023.03.23
Change the style of OB mean threshold.
Version 6.5 2023.03.22
Add Option to Time Zone / Asian Range / NWOG / NDOG, The user can set to display only the latest few results to avoid cluttering CHART with all of them displayed.
Version 6.4 2023.03.22
Fixed spelling errors in the settings panel.
Improved NWOG/NDOG algorithm.
Version 6.3 2023.03.22
Fix Trend Candle color setting bug.

Add HTF Strong/Weak High/Low
Version 6.2 2023.03.21
Add NWOG/NDOG function
Version 6.1 2023.03.20
Add Fractal Points & ZigZag Line
Version 6.0 2023.03.20
Add NY Midnight open line
Version 5.9 2023.03.19
Version 5.9

Add options for HTF OB style
Add options for Aisan Range
Version 5.8 2023.03.18
Version 5.8

Optimize Time Zone Function.
Add Asia Range function for day trade.
Version 5.7 2023.03.13
Version 5.7

Add HTF OB iOB function
Version 5.6 2023.03.12
Version 5.6

Add Continue to improve HTF functions.
Version 5.5 2023.03.11
Version 5.5

Add High Timeframe Structure ability.

BigBar, HTF iBOS, HTF BOS, HTF iCHoCH, HTF CHoCH
Version 5.3 2023.03.07
Version 5.3

Add Previous Day High/Low Price touch detect.
Input parameters verification.
Optimize some codes to make the indicator calculation faster.
Version 5.2 2023.03.06
Version 5.2

Update Time Zone algorithm
Version 5.1 2023.03.04
Version 5.1

Optimizing Candle Timer, not display the error countdown when there is no market data.
Version 5.0 2023.03.03
Version 4.9.1

Fix Candle Timer bug
Version 4.9 2023.03.03
Version 4.9

Optimize Time Zone and Candle Timer
Version 4.8 2023.03.02
Version 4.8

Add Candle Timer
Add Time Zone
Version 4.7 2023.03.01
Version 4.7

Add Liquidity Voids Detect
Version 4.6 2023.02.28
Version 4.6

Add Alerts to Email function
Version 4.5 2023.02.28
Version 4.5

Add FVG Touch alert
Version 4.4 2023.02.27
Version 4.4

Add Display full Fibo Levels Option
Version 4.3 2023.02.27
Version 4.3

Add FVG Extend Option: FVG extend to the current candle
Version 4.2 2023.02.25
Version 4.2

Add BSL/SSL Taken Alert
Version 4.1 2023.02.24
Version 4.1

fix BSL/SSL Taken bug
Version 4.0 2023.02.24
Version 4.0

Add BSL/SSL Taken Detect
Version 3.9 2023.02.22
Version 3.9

Add Fibonacci Retracement
Version 3.8 2023.02.20
Version 3.8

Fix bug of CHoCH BOS label text display options
Version 3.7 2023.02.20
Version 3.7

Add CHoCH BOS label text display options
Version 3.6 2023.02.20
Version 3.6
Add Alert when LW formed
Add Alert when LW filled
Add LW display options for filled
Version 3.5 2023.02.19
Version 3.5

Add Long Wicks detect function

Optimize OB mean threshold display
Version 3.4 2023.02.19
Version 3.4

Add OB iOB touch Alert
OB mean threshold and FVG Consequent Encroachment color Options
Version 3.3 2023.02.18
Version 3.3

Add OB mean threshold
Add FVG mean threshold
Version 3.2 2023.02.18
Version 3.2

Add Previous Day Open/Close
More concise OB display
Version 3.1 2023.02.15
Version 3.1

Optimize code
Version 3.0 2023.02.13
Version 3.0

Optimize code
Optimize FVG functions and support high timeframe FVG
Version 2.8 2023.02.12
FVG filled and FVG formed detect without delay.

Fixed some bugs
Version 2.7 2023.02.10
Version 2.7

Set alerts for BOS OB CHOCH etc separately
Support setting to send Alert to mobile devices.
Version 2.6 2023.02.09
Version 2.6
Version 2.5 2023.02.09
Version 2.5
Version 2.4 2023.02.08
Version 2.4

Fix Trend Candles bug
Version 2.3 2023.02.08
Version 2.3

Draw Candles by Trend
Previous day/week/monthly high/low
Version 2.2 2023.02.08
version 2.2

Modify Premium & Discount Zones
Version 2.1 2023.02.07
version 2.1

fix bug
Version 2.0 2023.02.07
version 2.0

Modify Fair Value Gap Detection
Version 1.3 2023.02.05
version 1.3

fix alert bug
Version 1.2 2023.02.03
version 1.2

EQH/EQL bug fix
add Alert function
Version 1.1 2023.02.03
version 1.0.1 :

fix bug