• Overview
  • Reviews
  • Comments

UR Bands MT5

UR Bands MT5
(with a Formula used in Machine Learning systems)

UR Bands MT5 is an indicator derived through a formula that incorporates market volatility is similar in principle to those used in machine learning systems. This mathematical representation of market conditions offers a precise analysis of price trends and dynamics, taking into account the inherent volatility of financial markets. By incorporating volatility as a variable, the indicator provides a more accurate and dependable representation of market conditions, allowing traders and investors to make informed decisions and manage risk effectively. Additionally, the use of a volatility-based formula makes the indicator highly reactive to market changes, providing early signals for potential trades or investments.

Advantages of using UR Bands MT5 :

  1. Visually pleasant and easy-to-understand on-chart bands
  2. Adapted to every kind of asset and timeframe
  3. Bands always showing tops and bottoms of trends
  4. Great addition and standalone indicator for trend or reversal trading systems

There is a special telegram chat on which you can stay up-to-date with the tools updates and also send request if you feel there is something missing!


Why UR 
Bands MT5 
?

  • Improved accuracy: The incorporation of market volatility into the indicator formula results in a more precise analysis of market conditions.
  • Better risk assessment: By taking volatility into account, the indicator can help traders and investors assess market risk more accurately.
  • Early signals: The use of a volatility-based formula makes the indicator highly reactive to market changes, providing early signals for potential trades or investments.
  • Data-driven decisions: The indicator provides a more reliable representation of market conditions, allowing traders and investors to make data-driven decisions.
  • Relevance in dynamic markets: The volatility-based indicator is designed to handle the dynamic nature of financial markets, providing a more relevant analysis.


How to use UR Bands MT5 ?

UR Bands MT5 shows a multi-level exhaustion for the price. You can:

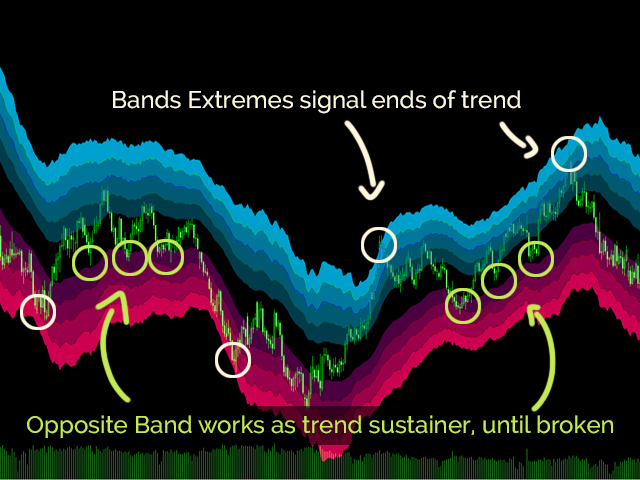
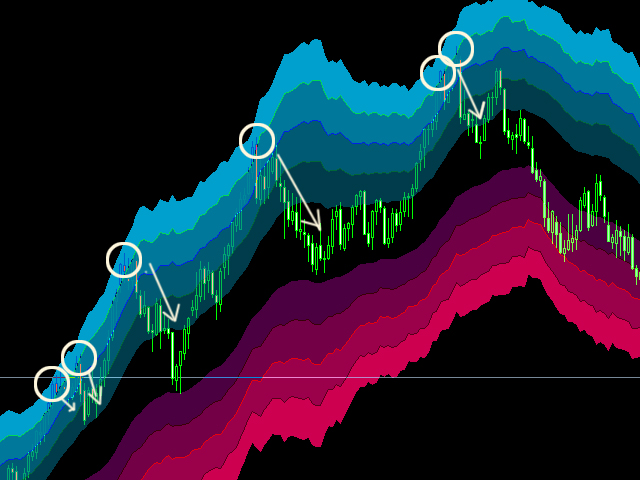
  • Spot extreme exhaustions and counter-trade (reversal trading) - basically when the price reaches the outter edge of the band.
  • Spot beginnings of trends, when you see the price bouncing on a band or showing signs of reversal with higher lows / lower highs.
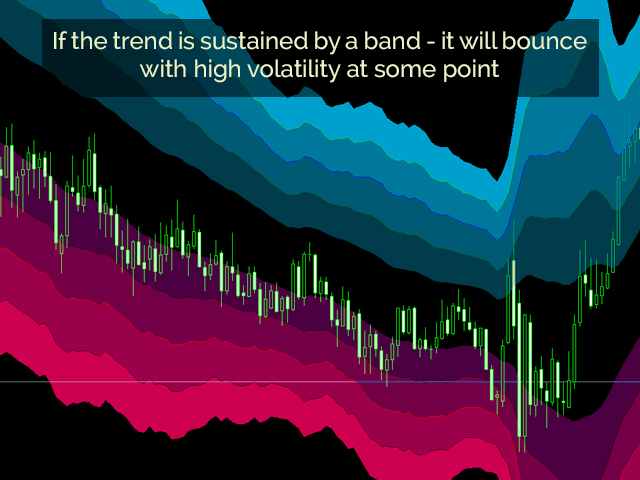
  • Spot trend continuation in strong trends when the price bounces on the opposite band


DISPLAY

  • Two sided Bands: Show levels of exhaustion of the trend - the extremes being the absolute exhaustion.


Recommended products
The best time to trade Using this Indicator is when the time reach exactly hour,half,45 minutes,15 minutes and sometimes 5 minutes.. This indicators is helpful to those who trade boom and crash indecies.How to read this indicator first you'll see Blue allow and Red allow all these allows used to indicate or to detect the spike which will happen so the allow happens soon before the spike happen.This indicator works properly only in boom and crash trading thing which you have to consider when
Easy GOLD MT5
Franck Martin
4.71 (7)
Easy Gold is the latest addition to the BotGPT family. It is surprising and very powerful. It is ideal for beginners due to its simplicity.  There is absolutely nothing to do, it's 100% automated, simply indicate the percentage of risk you want to take per trade and the EA is ready. Whatever your capital, the EA takes care of everything. Optimized on (XAUUSD).  Unleash all the power with the professional version (AGI Gold) and its connection to the neural network, available in my store. My othe
FREE
Perfect Sniper
Ignacio Agustin Mene Franco
Perfect Sniper! is a triple indicator with support resistance detection, downtrend channel, uptrend channel Bands included! where he hunts the rebounds in the red lines for sale, in the green lines mark purchase, in the lower bands that are the breaks gives another second entry either buy or sell, perfect to take advantage of the double entrance, It is used in any temporality, It is used to scalp and long on h1 or h4 to D1. It works for Forex markets, All pairs. It is used for the synthetic inde
The new update makes this indicator a complete tool for studying, analyzing and operating probabilistic patterns. It includes: On-chart Multi-asset percentage monitor. Configurable martingales. Twenty-one pre-configured patterns, including Mhi patterns and C3. An advanced pattern editor to store up to 5 custom patterns. Backtest mode to test results with loss reports. Trend filter. Hit operational filter. Martingale Cycles option. Various types of strategies and alerts. Confluence between patter
This innovative indicator for measuring the strength of currencies from INFINITY is an indispensable assistant for scalpers and traders trading for a long time. The system for analyzing the Strength / weakness of currencies has long been known and used in the market by the world's leading traders. Any arbitrage trading is not complete without this analysis. Our indicator easily determines the strength of the base currencies in relation to each other. It displays line charts for all or the curre
Follow The Line MT5
Oliver Gideon Amofa Appiah
4.4 (30)
This indicator obeys the popular maxim that: "THE TREND IS YOUR FRIEND" It paints a GREEN line for BUY and also paints a RED line for SELL. (you can change the colors). It gives alarms and alerts of all kinds. IT DOES NOT REPAINT and can be used for all currency pairs and timeframes. Yes, as easy and simple as that. Even a newbie can use it to make great and reliable trades. NB: For best results, get my other premium indicators for more powerful and reliable signals. Get them here: https://www.m
FREE
Best SAR MT5
Ashkan Hazegh Nikrou
5 (1)
Description :  we are happy to introduce our new free indicator based on one of professional and popular indicators in forex market (Parabolic SAR) this indicator is new modification on original Parabolic SAR indicator, in pro SAR indicator you can see cross over between dots and price chart, this crossover is not signal but talk about end of movement potential, you can start buy by new blue dot, and place stop loss one atr before first blue dot, and finally you can exit as soon as dots cross
FREE
Quarter EMA
Jithin Sajan Sajan
Kindly rate and comment about the product for upgradation & Support The 5 EMA is plotted in green color ( Lime ). The 14 EMA is plotted in red color ( Red ). The 20 EMA is plotted in blue color ( Blue ). The 200 EMA is plotted in yellow color ( Yellow ). The Quarter EMA that provided calculates and plots four Exponential Moving Averages (EMAs) on the chart using different periods: 5, 14, 20, and 200. Each EMA is represented by a different color on the chart. Here's a description of each
FREE
Quintet EMA
Jithin Sajan Sajan
Kindly rate and comment about the product for upgradation & Support The   5 EMA   is plotted in   green   color ( Lime ). The  14 EMA  is plotted in  red  color ( Red ). The   20 EMA   is plotted in   blue   color ( Blue ). The  200 EMA  is plotted in  black  color ( Black ). The   200 EMA   is plotted in   yellow   color ( Yellow ). The Quarter EMA that provided calculates and plots four Exponential Moving Averages (EMAs) on the chart using different periods: 5, 14, 20, and 200. Each EMA
FREE
GIVE A LOOK TO MY OTHER PRODUCTS ! 100 % PER MONTH PROFIT---- MY NEW SIGNAL HERE ------->   https://www.mql5.com/en/signals/2162238?source=Site+Signals+My# BROKEN TRENDLINE ALERT IS A SIMPLE TOOL INDICATOR. JUST DRAW IN YOUR CHART A DYNAMIC OR STATIC TRENDLINE,AND THE INDICATOR WILL SEND YOU ALERT WHENEVER THE PRICE CROSSES BELOW OR ABOVE YOUR DRAWN TRENDLINE. IT WORKS IN ANY TIMEFRAME AND ANY CHART YOU WANT.JUST GOT A VPS AND DON'T STRESS IN FRONT OF YOUR COMPUTER. FOR ANY KIND OF QUESTION
WAPV Weis Wave Chart Forex
Eduardo Da Costa Custodio Santos
The Weis Wave Chart Forex for MT5 is a Price and Volume indicator. The Price and Volume reading was widely disseminated through Richard Demille Wyckoff based on the three laws created by him: Supply and Demand, Cause and Effect and Effort vs. Result. In 1900 R.Wyckoff already used the wave chart in his analyses. Many years later, around 1990, David Weis Automated R. Wyckoff's wave chart and today we bring you the evolution of David Weis' wave chart. It shows the amount of Volume and the amount o
Wolfe Wave Scanner MT5
Reza Aghajanpour
5 (3)
**  All Symbols  x  All Timeframes  scan just by pressing scanner button ** *** Contact me after the purchase to send you instructions and add you in "Wolfe Wave Scanner group" for sharing or seeing experiences with other users. Introduction: A Wolfe Wave is created with five-wave patterns in price. It shows supply and demand and a fight towards a balance price. T hese waves of price actions can help traders identify the boundaries of   the trend . Also  It helps forecast how the price will mo
PZ Trend Trading MT5
PZ TRADING SLU
3.67 (3)
Trend Trading is an indicator designed to profit as much as possible from trends taking place in the market, by timing pullbacks and breakouts. It finds trading opportunities by analyzing what the price is doing during established trends. [ Installation Guide | Update Guide | Troubleshooting | FAQ | All Products ] Trade financial markets with confidence and efficiency Profit from established trends without getting whipsawed Recognize profitable pullbacks, breakouts and early reversals The ind
KT Renko Patterns MT5
KEENBASE SOFTWARE SOLUTIONS
KT Renko Patterns scans the Renko chart brick by brick to find some famous chart patterns that are frequently used by traders across the various financial markets. Compared to the time-based charts, patterns based trading is easier and more evident on Renko charts due to their uncluttered appearance. KT Renko Patterns features multiple Renko patterns, and many of these patterns are extensively explained in the book titled Profitable Trading with Renko Charts by Prashant Shah. A 100% automate
This indicator will show you the TP and SL Values (in that currency) that you already set  for every orders on the charts  ( closed to the transaction/order line)  that will help you a lot to estimated your profit and loss for every order.    And it also show you the PIPs values too.  the shown format  is      " Currency Values of our Profit or Loss /  PIPs values ".    The TP Value will be shown in Green Color and  the SL Value  will be shown in Red Color.  For any question or more information,
HMA Trend Professional MT5
Pavel Zamoshnikov
4.4 (5)
Improved version of the free HMA Trend indicator (for MetaTrader 4) with statistical analysis. HMA Trend is a trend indicator based on the Hull Moving Average (HMA) with two periods. HMA with a slow period identifies the trend, while HMA with a fast period determines the short-term movements and signals in the trend direction. The main differences from the free version: Ability to predict the probability of a trend reversal using analysis of history data. Plotting statistical charts for analyz
Xtrade Trend Detector
Dago Elkana Samuel Dadie
Xtrade Trend Detector is an indicator capable of finding the best opportunities to take a position in any stock market. Indeed, it is a great tool for scalpers but also for Daytraders. You could therefore use it to identify areas to trade, it fits easily on a chart. I use it to detect trends on Big timeframes and take positions on Small timeframes. Don't hesitate to give me a feedback if you test it.
CryptoEA
Dragan Drenjanin
CryptoEA. Sticking to the same vibe, but this bot's got a bit of a twist in its crypto money management system. This is some brand-new stuff, and, only this bot's got this feature integrated. Anyways, the bot's rockin' a slick, minimalist design, but it's packing all the top-notch features – works with all order types, flips positions, makes decisions on the fly, goes for the buy or the sell, and all exit rules are calculated base on six independent ATR indicators. This robot's geared up to trad
Free automatic Fibonacci is an indicator that automatically plots a Fibonacci retracement based on the number of bars you select on the BarsToScan setting in the indicator. The Fibonacci is automatically updated in real time as new highest and lowest values appears amongst the selected bars. You can select which level values to be displayed in the indicator settings. You can also select the color of the levels thus enabling the trader to be able to attach the indicator several times with differe
FREE
Long Waiting
Aleksandr Davydov
5 (1)
Expert description Algorithm optimized for Nasdaq trading The Expert Advisor is based on the constant maintenance of long positions with daily profit taking, if there is any, and temporary interruption of work during the implementation of prolonged corrections The Expert Advisor's trading principle is based on the historical volatility of the traded asset. The values of the Correction Size (InpMaxMinusForMarginCallShort) and Maximum Fall (InpMaxMinusForMarginCallLong) are set manually. Reco
FREE
Franken
Aleksei Grebenkin
Multifunctional universal trading system . Suitable for all Forex and Crypto markets. ---- Franken.ex5 is additional executable used for trading with TS_DayTrader system. See the GUI version Frankenstein.ex5 and fast Frank.ex5 engine for optimization. You will find more info on the system in the descriptions there. Franken is built with features from both Frankenstein.ex5 and Frank.ex5: it is almost as fast as Frank(many features stripped off) but has the controls and statistics
Orders SL and TP Values Show
Nelson Queiros De Almeida
Orders SL and TP Values Show is an indicator that shows the values of Profit and Loss over the lines in the main chart. In addition, the distance in points will be shown. In the current version, the code has been remodeled and improved, now offering new options and features such as: Option to include swape values to more precise calculation of your order StopLoss and Takeprofit values. (Activated by default) Option to include the ticket number on the left of price value. This is useful to identi
Exclusive FOREX account HEDGE FuzzyLogicTrendEA is based on fuzzy logic strategy based on  analysis 5 indicators and filters. When the EA analysis all this indicators, it decides, based on its fuzzy strategy, which trade will be better: sell or buy. As additional functions, it´s possible defines spread maximum, stop loss and others. Recomm. Symbol: EURUSD, AUDUSD, GBPUSD, NZDUSD, USDCAD, AUDCAD, EURCAD e USDJPY Recomm. timeframe: H1. Backtest were done on EURUSD, H1, 01/07/2023 - 26/0
Noize Absorption Index - is the manual trading system that measures the difference of pressure between bears forces and bulls forces. Green line - is a noize free index that showing curent situation. Zero value of index shows totally choppy/flat market.Values above zero level shows how powerfull bullish wave is and values below zero measures bearish forces.Up arrow appears on bearish market when it's ready to reverse, dn arrow appears on weak bullish market, as a result of reverse expectation.
Bollinger Bands B
Flavio Javier Jarabeck
5 (3)
John Bollinger created this indicator in 2010 as a way to read the original indicator (Bollinger Bands) in a more "technical" way, shown as an oscillator. The typical range of the Bollinger Bands %B is 0 - 0.5 - 1.0, where "0" represents the lower band, the "0.5" the middle band, and "1" the upper band. The line on the indicator represents the Closing prices. As simple as that. SETTINGS Bollinger Bands period of analysis Standard Deviation multiplier Shift Price type to be analyzed If you
FREE
Weis Wave Double Side
Eduardo Da Costa Custodio Santos
The Weis Wave Bouble Side Indicator for MT5 is part of the toolkit (Wyckoff Academy Wave Market) The Weis Wave Bouble side Indicator for MT5 was created based on the already established Weis Wave created by David Weis. The Weis Wave Double Side indicator reads the market in waves as it was done by R. Wyckoff in 1900. It helps in the identification of effort x result, cause and effect, and Supply and demand Its differential is that it can be used below the zero axis, further improving plus operat
Signals Supply and Demand Force
Claudio Angelo Chumpitaz Flores
Este Indicador esta basado en el rebote de un soporte o resistencia fuerte con un indicador que tiene interno de fuerza de movimiento. Tiene la opción de ver el soporte y resistencia actual y ver la fuerza que tiene dicho soporte o resistencia.(Activando el parámetro Ver_Sop_Res ) Parámetros: Sop o Res, Fuerza Mayor a...: Con este parámetro podrás ajustar la fuerza del soporte o resistencia, con la cual el indicador evaluara si es una señal bajista o alcista. Velas Historial: Con este parámetro
GapFinder Pro - Unleashing Market Opportunities Discover and capitalize on market gaps with precision using GapFinder Pro, the ultimate MetaTrader 5 indicator designed for novice and astute traders. Unveil hidden opportunities in the market and elevate your trading strategy with this powerful tool. Key Features: Any Currency! Any Time-Frame! Gap Detection and Visualization: Identify market gaps effortlessly with a visual representation on your MetaTrader 5 chart. Instantly recognize gaps, painte
Exclusive Limited Time Offer! Grab this useful indicator for a lifetime at just $49. Note: It is requested that purchases must be refrained from if the buyer is from India, Bangladesh, or Pakistan, as developer support for these regions is unavailable due to legal restrictions. Volatility indicator dashboard designed to revolutionize how traders perceive and navigate market volatility. Track volatile for multiple currency pairs one at time for multiple timeframes. Works best with Forex Market,
Super Trend eu
Emin Ulucanli
5 (3)
SUPERTREND; It is a trend following indicator based on the SuperTrend ATR created by Olivier Seban. It can be used to detect changes in trend direction and locate stops. When the price falls below the indicator curve, it turns red and indicates a downtrend. Conversely, when the price moves above the curve, the indicator turns green, indicating an uptrend. Like other indicators, it works well on SuperTrend when used in conjunction with other indicators such as MACD, parabolik SAR, Bollinger Band
FREE
Buyers of this product also purchase
Atomic Analyst MT5
Issam Kassas
3.64 (11)
First of all Its worth emphasizing here that this Trading Indicator is   Non-Repainting ,   Non-Redrawing   and   Non-Lagging   Indicator, Which makes it ideal from both manual and robot trading.  The Atomic Analyst  is a PA Price Action Indicator that uses Strength and Momentum of the price to find a better edge in the market. Equipped with an AI filter which help remove noises and false signals, and Increase Trading Potential. Using Multiple layers of complex Indicators, the Atomic Analyst
First of all Its worth emphasizing here that this Trading System is Non-Repainting , Non-Redrawing and Non-Lagging Indicator , Which makes it ideal from both manual and robot trading .  The Smart Trend Trading System MT5 is a comprehensive trading solution tailored for new and experienced traders . It combines over 10 premium indicators and features more than 7 robust trading strategies , making it a versatile choice for diverse market conditions . Trend Following Strategy : Provides precise ent
Quantum Trend Sniper
Bogdan Ion Puscasu
5 (37)
Introducing   Quantum Trend Sniper Indicator , the groundbreaking MQL5 Indicator that's transforming the way you identify and trade trend reversals! Developed by a team of experienced traders with trading experience of over 13 years,   Quantum Trend Sniper Indicator   is designed to propel your trading journey to new heights with its innovative way of identifying trend reversals with extremely high accuracy. ***Buy Quantum Trend Sniper Indicator and you could get Quantum Breakout Indicator fo
RelicusRoad Pro MT5
Relicus LLC
4.81 (21)
How many times have you bought a trading indicator with great back-tests, live account performance proof with fantastic numbers and stats all over the place but after using it, you end up blowing your account? You shouldn't trust a signal by itself, you need to know why it appeared in the first place, and that's what RelicusRoad Pro does best! NOW $147 (increasing to $499 after a few updates) - UNLIMITED ACCOUNTS (PCs or MACs) **  User Manual + Strategies + Training Videos + Private Group with
FX Volume MT5
Daniel Stein
4.94 (17)
Visit our all-new   Stein Investments Welcome Page   to get the latest information, updates and trading strategies. FX Volume is the FIRST and ONLY volume indicator that provides a REAL insight into the market sentiment from a broker's point of view. It provides awesome insights into how institutional market participants, like brokers, are positioned in the Forex market, much faster than COT reports. Seeing this information directly on your chart is the real game-changer and breakthrough solut
FX Power MT5 NG
Daniel Stein
5 (4)
Trading GOLD, and currencies, with the dog walk strategy  - super smart Trading GOLD, and currencies, with the breakout strategy  - super easy Visit our all-new   Stein Investments Welcome Page   to get the latest information, updates and trading strategies. FX Power MT5 NG  is the next generation of our long-time very popular currency strength meter, FX Power.  And what does this next-generation strength meter offer? Everything you have loved about the original FX Power  PLUS GOLD/XAU st
Advanced Supply Demand MT5
Bernhard Schweigert
4.53 (15)
Best Solution for any Newbie or Expert Trader! This indicator is a unique, high quality and affordable trading tool because we have incorporated a number of proprietary features and a new formula. With this update, you will be able to show double timeframe zones. You will not only be able to show a higher TF but to show both, the chart TF, PLUS the higher TF: SHOWING NESTED ZONES. All Supply Demand traders will love it. :) Important Information Revealed Maximize the potential of Advanced Suppl
Volume by Price MT5
Brian Collard
5 (3)
The Volume by Price Indicator for MetaTrader 5 features Volume Profile and Market Profile TPO (Time Price Opportunity). Get valuable insights out of currencies, equities and commodities data. Gain an edge trading financial markets. Volume and TPO histogram bar and line charts. Volume Footprint charts. TPO letter and block marker charts including split structures. Versatile segmentation and compositing methods. Static, dynamic and flexible ranges with relative and/or absolute visualizations. Lay
XQ Indicator MetaTrader 5
Marzena Maria Szmit
5 (1)
Step into the realm of Forex trading with confidence and precision using XQ, a cutting-edge Forex indicator designed to elevate your trading game to unprecedented heights. Whether you're a seasoned trader or just stepping into the world of currency exchange, XQ Forex Indicator empowers you with the insights and signals needed to make informed trading decisions. The signal conditions are a combination of three indicators, and XQ Forex Indicator only display  medium and long-term trends . The ind
Top indicator for MT5   providing accurate signals to enter a trade without repainting! It can be applied to any financial assets:   forex, cryptocurrencies, metals, stocks, indices .  Watch  the video  (6:22) with an example of processing only one signal that paid off the indicator! MT4 version is here It will provide pretty accurate trading signals and tell you when it's best to open a trade and close it. Most traders improve their trading results during the first trading week with the help of
Introducing   Quantum Breakout PRO , the groundbreaking MQL5 Indicator that's transforming the way you trade Breakout Zones! Developed by a team of experienced traders with trading experience of over 13 years,   Quantum Breakout PRO   is designed to propel your trading journey to new heights with its innovative and dynamic breakout zone strategy. Quantum Breakout Indicator will give you signal arrows on breakout zones with 5 profit target zones and stop loss suggestion based on the breako
TPSproTREND PrO MT5
Roman Podpora
5 (5)
TPSpro TRENDPRO  - is a trend indicator that automatically analyzes the market and provides information about the trend and each of its changes, as well as giving signals for entering trades without redrawing! The indicator uses each candle, analyzing them separately. referring to different impulses - up or down impulse. Exact entry points into transactions for currencies, crypto, metals, stocks, indices!  -  Version MT4                  DETAILED DESCRIPTION        /       TRADING SETUPS       
TrendMaestro5
Stefano Frisetti
note: this indicator is for METATRADER4, if you want the version for METATRADER5 this is the link:  https://www.mql5.com/it/market/product/108106 TRENDMAESTRO recognizes a new TREND in the bud, he never makes mistakes. The certainty of identifying a new TREND is priceless. DESCRIPTION TRENDMAESTRO identifies a new TREND in the bud, this indicator examines the volatility, volumes and momentum to identify the moment in which there is an explosion of one or more of these data and therefore the mome
Owl Smart Levels MT5
Sergey Ermolov
4.47 (36)
MT4 version  |   FAQ The Owl Smart Levels Indicator is a complete trading system within the one indicator that includes such popular market analysis tools as Bill Williams' advanced fractals , Valable ZigZag which builds the correct wave structure of the market, and Fibonacci levels which mark the exact levels of entry into the market and places to take profits. Detailed description of the strategy Instructions for working with the indicator Advisor-assistant in trading Owl Helper Private User
Quantum Heiken Ashi PRO MT5
Bogdan Ion Puscasu
4.5 (8)
Introducing the Quantum Heiken Ashi PRO charts with integrated alerts Designed to provide clear insights into market trends, the Heiken Ashi candles are renowned for their ability to filter out noise and eliminate false signals. Say goodbye to confusing price fluctuations and hello to a smoother, more reliable chart representation. What makes the Quantum Heiken Ashi PRO truly unique is its innovative formula, which transforms traditional candlestick data into easy-to-read colored bars. Red and g
Gartley Hunter Multi
Siarhei Vashchylka
5 (5)
Gartley Hunter Multi - An indicator for searching for harmonic patterns simultaneously on dozens of trading instruments and on all classic timeframes: (m1, m5, m15, m30, H1, H4, D1, Wk, Mn). Manual (Be sure to read before purchasing) | Version for MT4 Advantages 1. Patterns: Gartley, Butterfly, Shark, Crab. Bat, Alternate Bat, Deep Crab, Cypher 2. Simultaneous search for patterns on dozens of trading instruments and on all classic timeframes 3. Search for patterns of all possible sizes. Fr
Was: $249  Now: $99   Market Profile defines a number of day types that can help the trader to determine market behaviour. A key feature is the Value Area, representing the range of price action where 70% of trading took place. Understanding the Value Area can give traders valuable insight into market direction and establish the higher odds trade. It is an excellent addition to any system you may be using. Inspired by Jim Dalton’s book “Mind Over Markets”, this indicator is designed to suit the
Golden Spikes Detector
Batsirayi L Marango
5 (1)
Golden Spikes Detector This indicator is based on an advanced strategy primarily for trading spikes on Boom and Crash Indices. Complex algorithms were implemented to detect high probability entries only. It alerts on potential Buy and Sell entries. To trade spikes on the Deriv or Binary broker, only take Buy Boom and Sell Cash alerts. It was optimised to be loaded on 5-minute timeframe although multiple timeframe analysis is done in the background. Features ·             Desktop pop up and sound
Blahtech Supply Demand MT5
Blahtech Limited
4.57 (14)
Was: $299  Now: $99   Supply Demand uses previous price action to identify potential imbalances between buyers and sellers. The key is to identify the better odds zones, not just the untouched ones. Blahtech Supply Demand indicator delivers functionality previously unavailable on any trading platform. This 4-in-1 indicator not only highlights the higher probability zones using a multi-criteria strength engine, but also combines it with multi-timeframe trend analysis, previously confirmed swings
Golden Gate Algo MT5
James David Lane
4 (6)
Introducing GoldenGate Algo: A Cutting-Edge Trading Solution!  Discover a revolutionary approach to trading with GoldenGate Algo (GGA), an advanced indicator designed to elevate your trading experience. GGA provides a comprehensive set of features to empower users with precision and confidence in their trading decisions. No re-painting! Pairs:   Any TimeFrames:   15m up to H1 Key Features: Buy and Sell Arrow Indications:   Receive Buy and Sell arrow indications accompanied by pop-up alerts,
Trend Forecaster
Alexey Minkov
5 (3)
The Trend Forecaster indicator utilizes a unique proprietary algorithm to determine entry points for a breakout trading strategy. The indicator identifies price clusters, analyzes price movement near levels, and provides a signal when the price breaks through a level. The Trend Forecaster indicator is suitable for all financial assets, including currencies (Forex), metals, stocks, indices, and cryptocurrencies. You can also adjust the indicator to work on any time frames, although it is recommen
Bill Williams Advanced
Siarhei Vashchylka
5 (3)
Bill Williams Advanced is designed for automatic chart analysis using Bill Williams' "Profitunity" system. The indicator analyzes four timeframes at once. Manual (Be sure to read before purchasing) Advantages 1. Automatically analyzes the chart using the "Profitunity" system of Bill Williams. The found signals are placed in a table in the corner of the screen. 2. Equipped with a trend filter based on the Alligator indicator. Most of the system signals are recommended to be used only accordi
PZ Swing Trading MT5
PZ TRADING SLU
5 (4)
Swing Trading is the first indicator designed to detect swings in the direction of the trend and possible reversal swings. It uses the baseline swing trading approach, widely described in trading literature. The indicator studies several price and time vectors to track the aggregate trend direction and detects situations in which the market is oversold or overbought and ready to correct. [ Installation Guide | Update Guide | Troubleshooting | FAQ | All Products ] Profit for market swings with
Professional Scalping Tool on Deriv Attention! The indicator will be sold in limited quantities!!! Description: This trading indicator is designed for professional traders focused on scalping. Designed with the market in mind, it provides highly accurate spike trading signals. It works on the M1 timeframe and supports the following symbols: Boom 300 Index, Boom 500 Index, Boom 1000 Index, Crash 300 Index, Crash 500 Index, Crash 1000 Index. Functional Features: - Direction: - Trading is ca
Trade Assistant MetaTrader System  — a multi-timeframe system that is based on three standard indicators:   Stochastic oscillator ,   RSI   (Relative Strength Index), and   CCI   (Commodity Channel Index). It displays current trend directions for M1, M5, M15, M30, H1, H4, D1, W1, and MN1 timeframes. When you follow such an indicator you have a clear picture of the trends across all important timeframes. It doesn't matter which timeframe you attach this indicator to. Input parameters CheckCandl
A key element in trading is zones or levels from which decisions to buy or sell a trading instrument are made. Despite attempts by major players to conceal their presence in the market, they inevitably leave traces. Our task was to learn how to identify these traces and interpret them correctly. Reversal First Impulse levels (RFI)   -  Version MT4                  INSTRUCTIONS                 RUS                 ENG                         R ecommended to use with an indicator   -  TREND PRO  
Gartley Hunter MT5
Siarhei Vashchylka
5 (13)
Gartley Hunter - An indicator for searching for harmonic patterns (Gartley patterns) and their projections. The indicator is equipped with a system of alerts and push notifications. Manual (Be sure to read before purchasing) | Version for MT4 Advantages 1. 12 harmonic patterns: 7 classical and 5 exotic. New patterns will be added as the indicator develops. 2. Constant automatic search for harmonic patterns. The indicator is capable of finding from the smallest to the largest patterns. 3. Autom
TPA True Price Action indicator reveals the true price action of the market makers through 100% non-repainting signals strictly at the close of a candle! TPA shows entries and re-entries, every time the bulls are definitely stronger than the bears and vice versa. Not to confuse with red/green candles. The shift of power gets confirmed at the earliest stage and is ONE exit strategy of several. There are available now two free parts of the TPA User Guide for our customers. The first "The Basics"
IVISTscalp5
Vadym Zhukovskyi
5 (3)
We present you the iVISTscalp5 indicator, which is not only unique, but also effective in the analysis of trading operations. This indicator is based on time data and is the result of many years of experience and deep analysis of financial markets. The iVISTscalp5 indicator is an excellent assistant for manual trading. Convenience, simplicity and visualization. All the most difficult is hidden inside. We have simplified the settings and use of the iVISTscalp5 indicator as much as possible. The i
MetaBands M5
Vahidreza Heidar Gholami
4.67 (3)
MetaBands uses powerful and unique algorithms to draw channels and detect trends so that it can provide traders with potential points for entering and exiting trades. It’s a channel indicator plus a powerful trend indicator. It includes different types of channels which can be merged to create new channels simply by using the input parameters. MetaBands uses all types of alerts to notify users about market events. Features Supports most of the channel algorithms Powerful trend detection algorith
More from author
UR Basket
Krzysztof Jan Debski
UR Basket   The best you can do is to protect your orders from turning into losses. You can now relax and let UR Basket take care of it. Advantages of using UR Basket: All parameters are dynamically changeable in the graphic panel on your chart - You DON'T need to restart the EA to change the parameters or recall what settings you used! You can track your orders through:  - Magic Number  - EA Comment  - Both of the above  - All of your trades at once UR Basket can track your profits through
UR Control Panel
Krzysztof Jan Debski
5 (2)
UR Control Panel   UR   Control Panel is a tool I want to share with you for FREE. It is an interactive Panel that helped me in my trading and boosted my market scanning each day. Hope it suits your needs aswell! How to use UR   Control Panel  ? It is an movable, resizable double panel of which: - One of them shows the currency strenght on the given timeframe - The other enables options to move between symbols and timeframes way quicker, using the same chart, and additionally shows resistance
FREE
UR DivergenceSpotter
Krzysztof Jan Debski
UR DivergenceSpotter   UR   DivergenceSpotter is the result of many years of experience and sometimes the easiest ways are the best. There is a good correlation between a few indicators, but when they mismatch - the price tries to "re-adjust" - and it's at that moment when we get a signal with UR DivergenceSpotter. Advantages of using UR Divergence Spotter: No parameters Doesn't repaint after the candle is created Signals when the signal is not valid anymore (meaning that you can hold your trade
UR VolumeTrend
Krzysztof Jan Debski
UR VolumeTrend   UR  VolumeTrend is the clearest volume indicator showing the ongoing trend in terms of volume. Works perfectly with other indicators just like UR TrendExhaustion to signal local tops and bottoms. Limited to just 2 parameters - the higher values, the longer trends it will show.  Gradient extremes show possible exhaustions of volume to catch a potential reversal. Two lines - The Volume trend and It's average. The best advantage: Easy and adjusted to all assets. There is a special
UR TrendExhaustion
Krzysztof Jan Debski
UR TrendExhaustion   UR   TrendExhaustion is the best solution for traders who don't want to deal with parameter values nor other set-ups - it is both easy and visually-understandable for everyone. Advantages of using UR TrendExhaustion: No parameters You have 3 lines that describe best what's going on on the chart:   Trend Exhaustion Line ,   Whale Money Line   and   Retail Money Line . The interface showcases the exhaustion of either line on both extremes (red areas) The best advantage: Easy a
UR HighsAndLows
Krzysztof Jan Debski
UR Highs&Lows   UR   Highs&Lows does an in-depth analysis of price movement and its volatility, and creates a channel within which the price is moving. That channel moves now as an oscillator and is overlayed with price's deviation to signal potential exhaustions and possible reversals. Advantages of using UR Highs&Lows : No parameters You have 3 lines that describe the price movement - White Line which is an average of the price, and Blue Lines which are its extremes The histogram is a visualiz
UR Momenter
Krzysztof Jan Debski
UR Momenter   UR   Momenter calculates perfectly the momentum of the price in correlation to the exhaustion of the price movement represented as an oscillator. Therefore this gives us really early signals of potential reversals or retracements. This formula was discovered in 2018 after market bubble burst. Advantages of using UR   Momenter   : No parameters You have 2 lines that describe the price movement - White Line which is the Momentum of the price in correlation to price's moving average d
UR FrontEndBackEnd
Krzysztof Jan Debski
UR FrontEndBackEnd   UR FrontEndBackEnd   is my favorite formula for finding the most accurate levels of support and resistance. I have also splitted those into different categories (dashed lines, solid lines and areas) to mark how strong they are. All is stored in buffers so they are easy to access and implement within other tools. Addition : The tool may need to be adjusted to the asset it is applied on - asset's differ in terms of nr of digis in the price which affects the tool. The needed
UR Gamma
Krzysztof Jan Debski
UR Gamma (powered by similar calculations found in Machine Learning systems) UR Gamma is a cutting-edge financial analysis tool that offers a new and improved take on the classic WaveTrend indicator. By incorporating advanced Digital Signal Processing techniques, UR Gamma addresses some of the limitations of traditional WaveTrend algorithms and provides a more accurate, robust and dynamic approach to identifying and measuring trends in price action. Advantages of using UR Gamma: Minimalist
UR Bands
Krzysztof Jan Debski
UR Bands (with a Formula used in Machine Learning systems) UR Bands   is a n indicator derived through a formula that incorporates market volatility is similar in principle to those used in machine learning systems. This mathematical representation of market conditions offers a precise analysis of price trends and dynamics, taking into account the inherent volatility of financial markets. By incorporating volatility as a variable, the indicator provides a more accurate and dependable representa
UR Vortex
Krzysztof Jan Debski
UR Vortex The Probabilistic UR Vortex Formula: An Accurate System for Predictive Market Analysis using Volatility and Standard Deviation Calculations. The   UR Vortex   indicator is a technical analysis tool that uses volatility and standard deviation calculations to predict potential tops and bottoms in a market. It measures the strength of a trend by calculating the distance between the current price and a moving average, and then standardizing this distance by dividing it by the average true
UR PulseScalp
Krzysztof Jan Debski
UR PulseScalp A calibrated trading indicator for scalpers seeking the ultimate edge in fast-paced markets UR PulseScalp is a cutting-edge trading solution for scalpers seeking the ultimate edge in fast-paced markets. This innovative indicator is built on a scientifically-calibrated formula that blends the power of Volatility, MoneyFlow and Relative Strength to create a highly accurate and reliable signal. Advantages of using UR  PulseScalp : Comfortable Interactive Panel Highly Accurate on
UR Basket MT5
Krzysztof Jan Debski
UR Basket MT5   The best you can do is to protect your orders from turning into losses. You can now relax and let UR Basket take care of it. Advantages of using UR Basket: All parameters are dynamically changeable in the graphic panel on your chart - You DON'T need to restart the EA to change the parameters or recall what settings you used! You can track your orders through:  - Magic Number  - EA Comment  - Both of the above  - All of your trades at once UR Basket can track your profits thro
UR DivergenceSpotter MT5   UR   DivergenceSpotter MT5 is the result of many years of experience and sometimes the easiest ways are the best. There is a good correlation between a few indicators, but when they mismatch - the price tries to "re-adjust" - and it's at that moment when we get a signal with UR DivergenceSpotter MT5. Advantages of using UR Divergence Spotter MT5: No parameters Doesn't repaint after the candle is created Signals when the signal is not valid anymore   (meaning that you c
UR VolumeTrend MT5
Krzysztof Jan Debski
UR VolumeTrend MT5   UR  VolumeTrend MT5 is the clearest volume indicator showing the ongoing trend in terms of volume. Works perfectly with other indicators just like UR TrendExhaustion to signal local tops and bottoms. Limited to just 2 parameters - the higher values, the longer trends it will show.  Gradient extremes show possible exhaustions of volume to catch a potential reversal. Two lines - The Volume trend and It's average. The best advantage: Easy and adjusted to all assets. There is a
UR TrendExhaustion MT5   UR   TrendExhaustion  MT5 is the best solution for traders who don't want to deal with parameter values nor other set-ups - it is both easy and visually-understandable for everyone. Advantages of using UR TrendExhaustion MT5: No parameters You have 3 lines that describe best what's going on on the chart:   Trend Exhaustion Line ,   Whale Money Line   and   Retail Money Line . The interface showcases the exhaustion of either line on both extremes (red areas) The best adva
UR HighsAndLows MT5
Krzysztof Jan Debski
UR Highs&Lows MT5   UR   Highs&Lows MT5 does an in-depth analysis of price movement and its volatility, and creates a channel within which the price is moving. That channel moves now as an oscillator and is overlayed with price's deviation to signal potential exhaustions and possible reversals. Advantages of using UR   Highs&Lows MT5   : No parameters You have 3 lines that describe the price movement - White Line which is an average of the price, and Blue Lines which are its extremes The histogr
UR Momenter MT5
Krzysztof Jan Debski
UR Momenter MT5   UR   Momenter  MT5 calculates perfectly the momentum of the price in correlation to the exhaustion of the price movement represented as an oscillator. Therefore this gives us really early signals of potential reversals or retracements. This formula was discovered in 2018 after market bubble burst. Advantages of using UR     Momenter MT5   : No parameters You have 2 lines that describe the price movement - White Line which is the Momentum of the price in correlation to price's m
UR FrontEndBackEnd MT5   UR FrontEndBackEnd MT5   is my favorite formula for finding the most accurate levels of support and resistance. I have also splitted those into different categories (dashed lines, solid lines and areas) to mark how strong they are. All is stored in buffers so they are easy to access and implement within other tools. Addition : The tool may need to be adjusted to the asset it is applied on - asset's differ in terms of nr of digis in the price which affects the tool. Th
UR Gamma MT5
Krzysztof Jan Debski
UR Gamma MT5 (powered by similar calculations found in Machine Learning systems) UR Gamma MT5   is a cutting-edge financial analysis tool that offers a new and improved take on the classic WaveTrend indicator. By incorporating advanced Digital Signal Processing techniques, UR Gamma addresses some of the limitations of traditional WaveTrend algorithms and provides a more accurate, robust and dynamic approach to identifying and measuring trends in price action. Advantages of using UR Gamma MT5
UR Vortex MT5
Krzysztof Jan Debski
UR Vortex MT5 The Probabilistic UR Vortex Formula: An Accurate System for Predictive Market Analysis using Volatility and Standard Deviation Calculations. The UR Vortex MT5 indicator is a technical analysis tool that uses volatility and standard deviation calculations to predict potential tops and bottoms in a market. It measures the strength of a trend by calculating the distance between the current price and a moving average, and then standardizing this distance by dividing it by the average
UR PulseScalp MT5
Krzysztof Jan Debski
UR PulseScalp MT5 A calibrated trading indicator for scalpers seeking the ultimate edge in fast-paced markets UR PulseScalp MT5   is a cutting-edge trading solution for scalpers seeking the ultimate edge in fast-paced markets. This innovative indicator is built on a scientifically-calibrated formula that blends the power of Volatility, MoneyFlow and Relative Strength to create a highly accurate and reliable signal. Advantages of using UR  PulseScalp MT5 : Comfortable Interactive Panel Highly
Filter:
No reviews
Reply to review