Deviation Index
- Indicators
- Francisco De A Vilar Enriquez
- Version: 7.2
- Updated: 22 April 2024
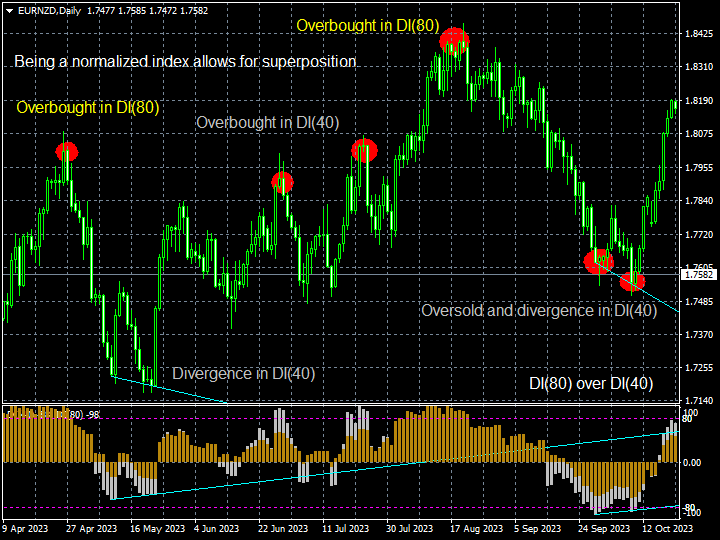
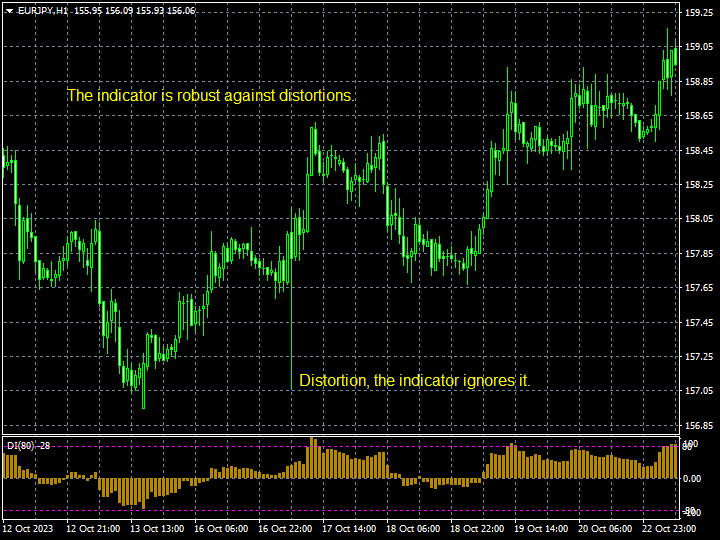
Normalized indicator. It measures the relative deviation of the price from its moving average. It is extremely reliable. Accurately determine overbought and oversold price areas and divergences.
Features.
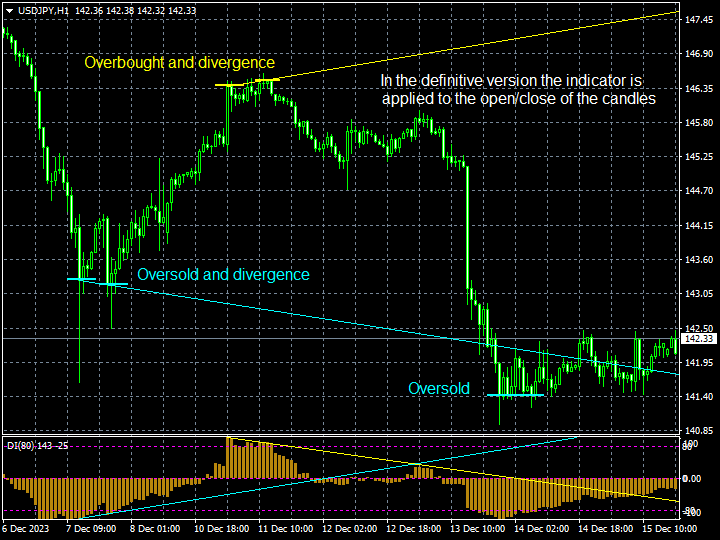
The indicator has a range of -100 to 100. The overbought zone is above 80 and the oversold zone is below -80.
Zones of overvalue, indicate possible reversal.
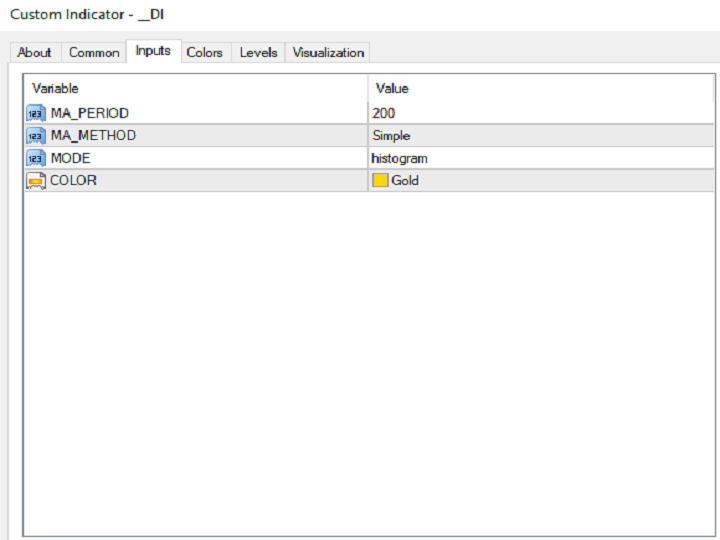
Mode: histogram/line.
MA method: simple, exponential, smoothed, linear weighted.
By default, the indicator is calculated on an SMA of 200.
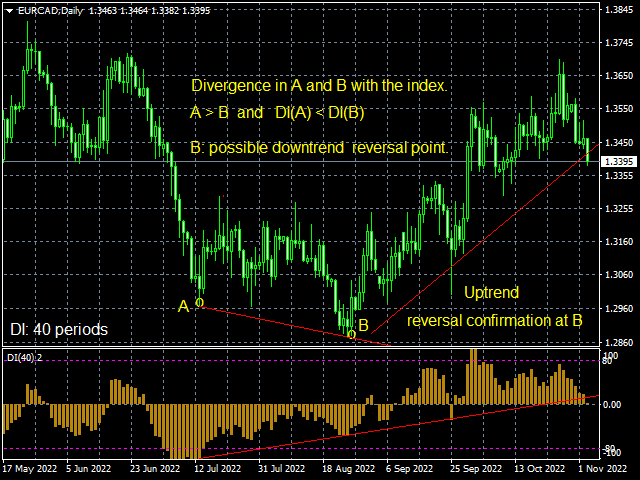
Reversal.
When there is overvalue with divergence, it is a clear sign of reversal.
Index formula.
DI = 100 x deviation to the moving average of n periods / maximum deviation in the current n periods.
Recommended indicators: Deviation Index mt5, The Oscillometer, Digital Trend Detector.
Contact email: fve2022@hotmail.com