UPD1 Rsi Dots Dashboard
- Indicators
- Vitaliy Kuznetsov
- Version: 3.51
- Updated: 20 December 2023
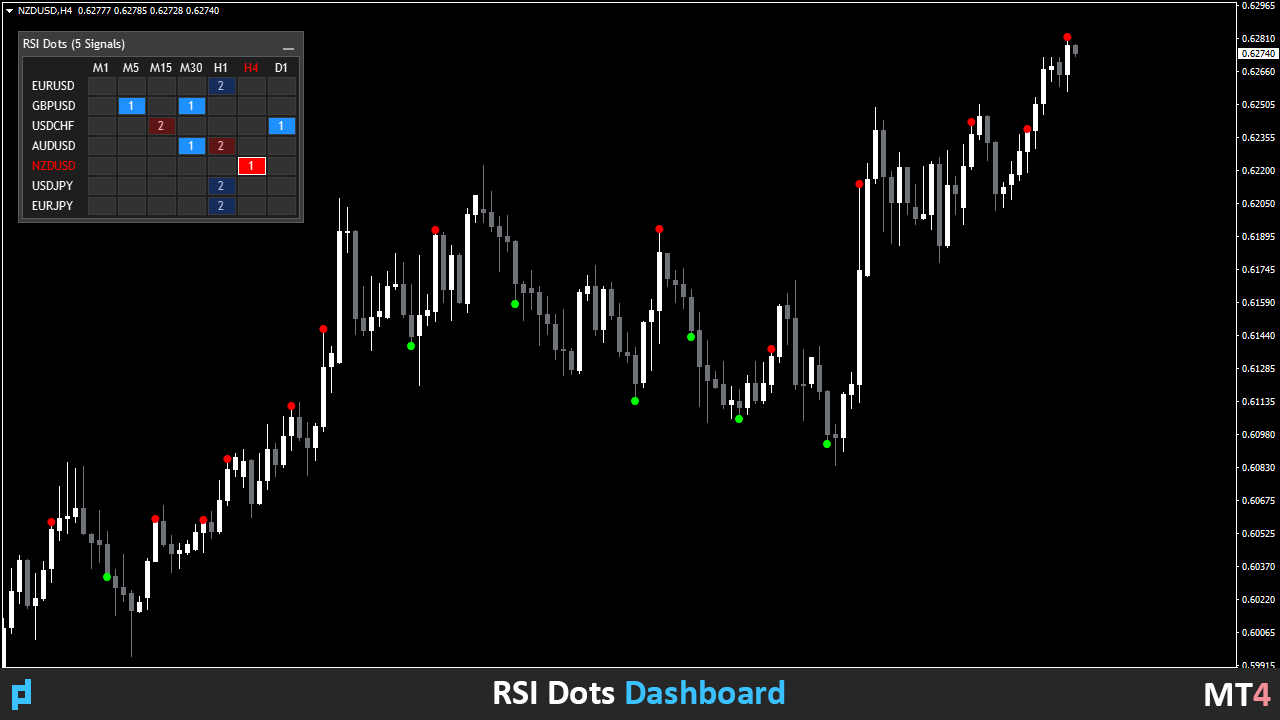
The indicator shows signals based on the terminal RSI oscillator on the chart. It is possible to filter out repeated signals.
Here the oscillator is used to search for a reverse signal. It is recommended as an entry point in swing strategies and trading from levels.
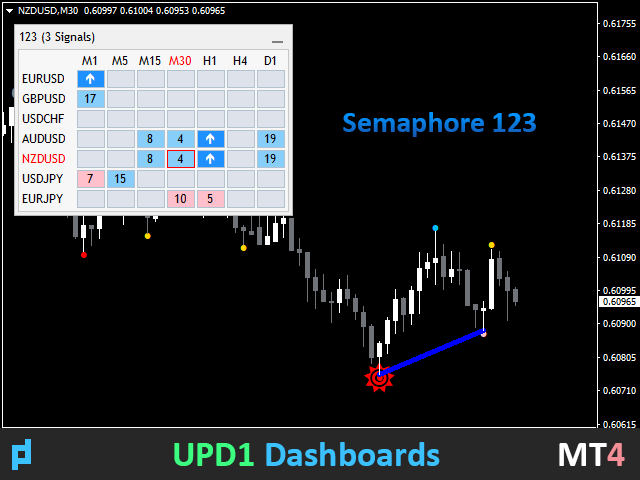
A multi-currency dashboard is available. With it, you can easily switch between charts.
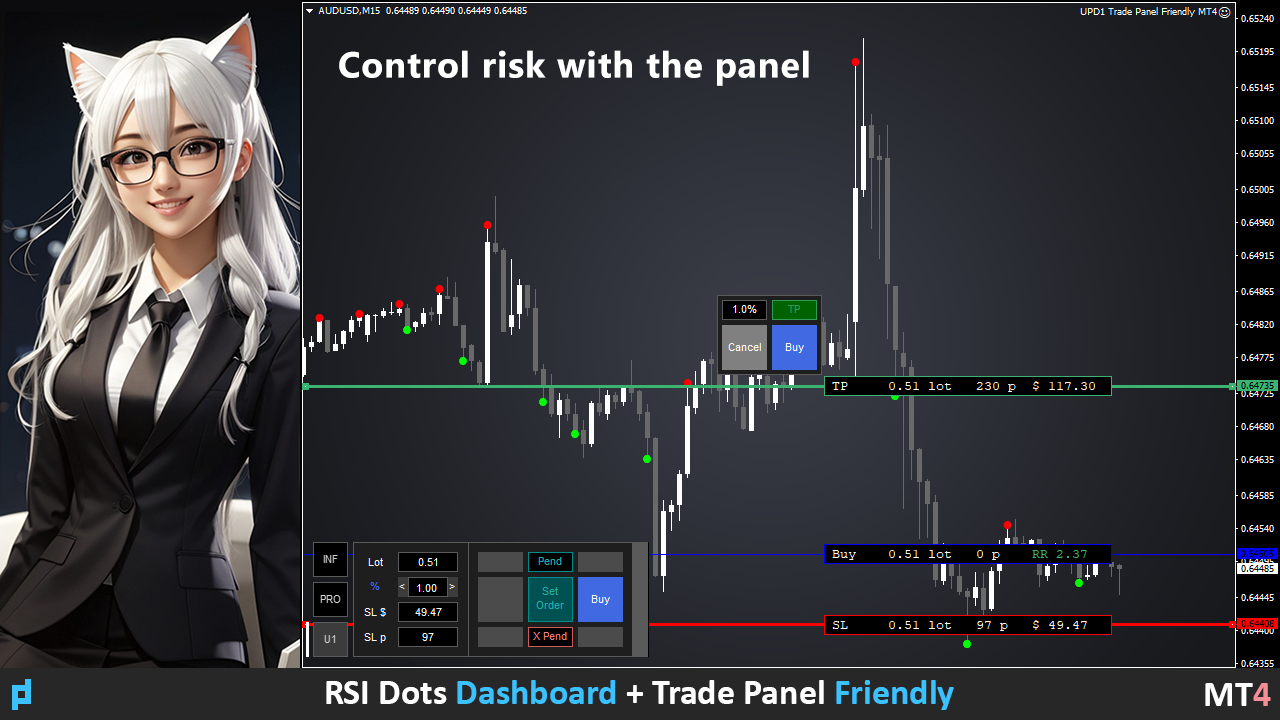
In product discussions, you can suggest an algorithm in which you can embed a dashboard.
Input parameters.
Main Settings.
Bars Count – the number of history bars on which the indicator will work.
RSI Period – oscillator period.
RSI Level – the level of the oscillator. The oscillator goes between 0 and 100. If you select 10, the signal will be above 10 and below 90.
RSI Applied Price.
Repeat Signal.
Enable – all repeated signals will be with arrows/icons.
No Signal – all repeated ones will be ignored.
Visual Arrows.
Sell Code – the code number of the Sell RSI icon.
Sell Color – the color of the Sell RSI icon.
Buy Code – the code number of the Buy RSI icon.
Buy Color – the color of the Buy RSI icon.
Indent Coeff – indent from the shadow by the volatility coefficient.
Size – icon size.
Dashboard.
Dashboard - enable / disable multicurrency dashboard.
Scan Bars - how many candles to monitor per history.
Dashboard Zoom % (0 -auto) - choose any zoom.
Color Theme - automatic or manual selection of the panel color theme (light and dark).
Symbol Lyst - write down the instruments to be monitored.
View M1-MN - enter the timeframes to be monitored.
Alert Settings.
Alert - enable / disable notification settings.
Current Chart – alert only on the current chart, ignoring dashboard signals.
Dashboard List – alert when new signals appear in the dashboard.
Alert Work Time - specify the time period when the alert will be active.
Alert Pop Up - enable / disable alert popup.
Alert Push - enable / disable notification to phone.
Alert E-mail - enable / disable email notification.
Alert Sound - enable / disable sound notification.
Alert Sound Name - select sound alert file.


Very interesting tool.
Interesting to see multiple timeframes at the same time. Would it be possible to code something similar for indexes?