Delta Volume VolScalping
- Indicators
- Angelo Capoferri
- Version: 1.0
- Activations: 5
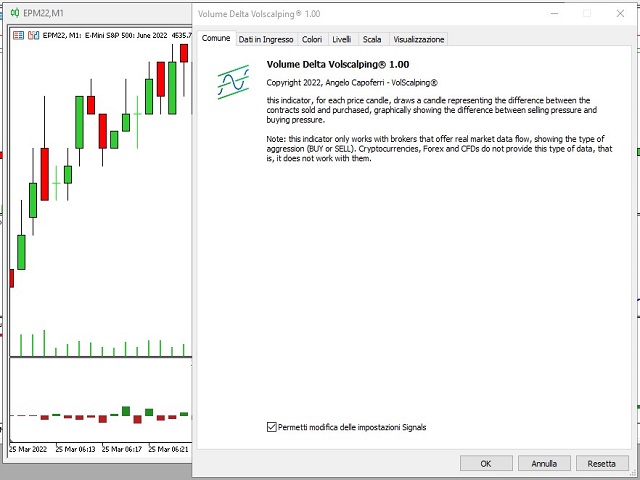
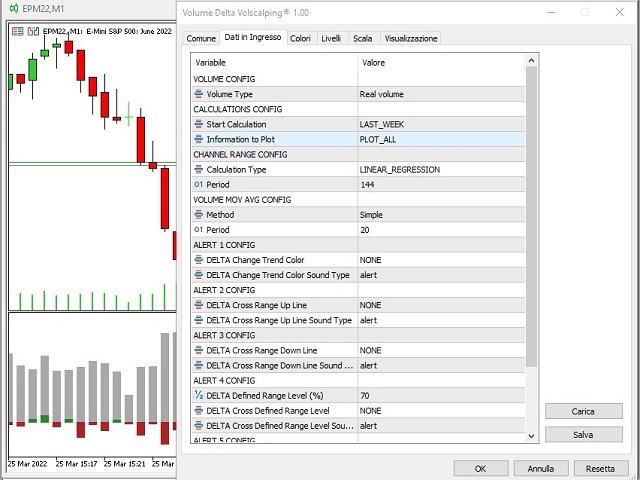
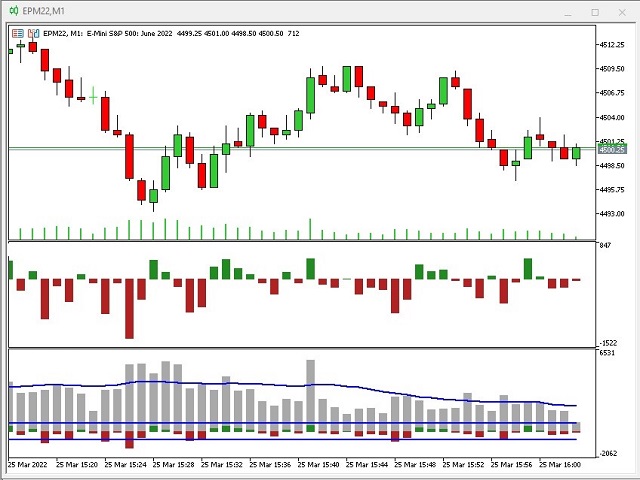
DELTA VOLUME Volscalping®
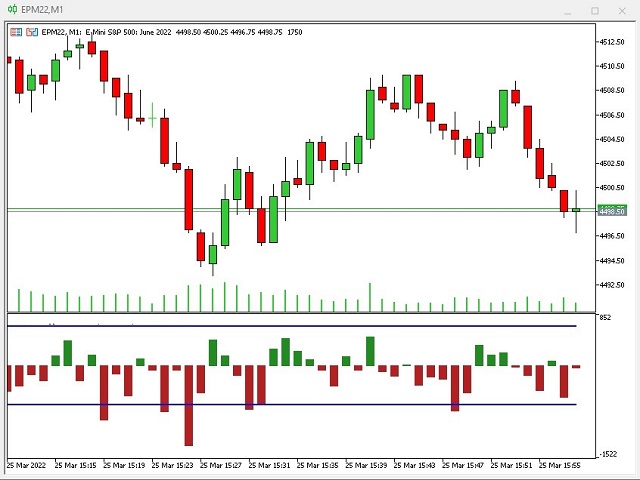
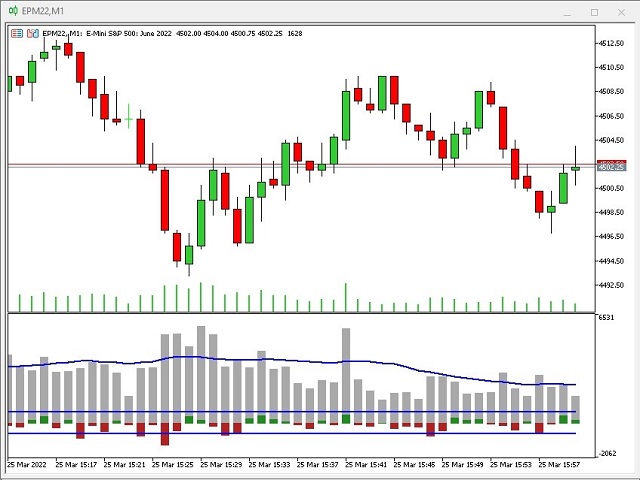
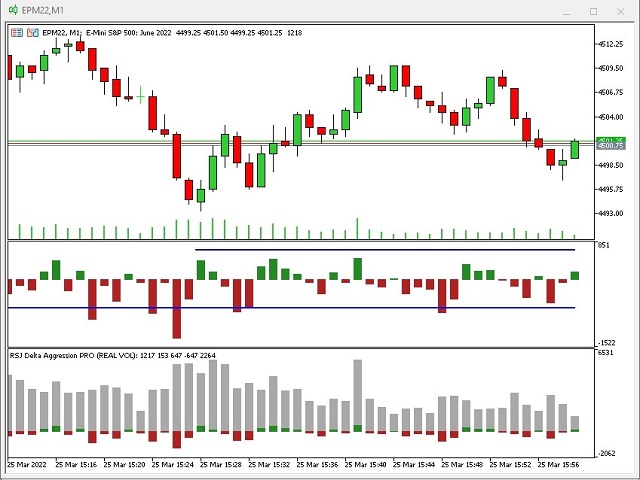
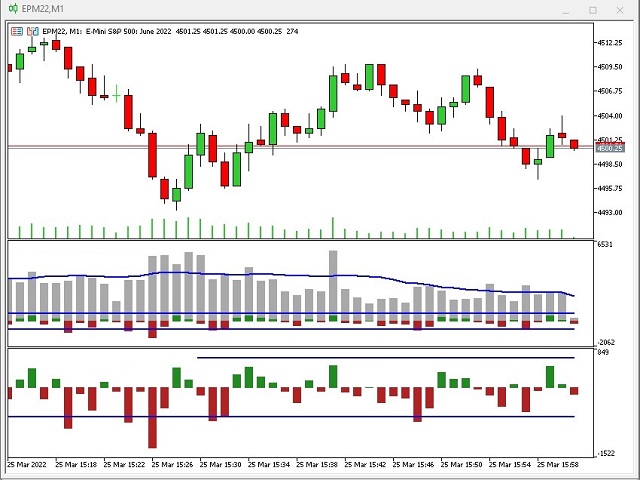
This indicator, for each price candle, draws a Delta candle, which is the difference between the contracts bought and sold. The candle will be red and negative if the contracts traded in the bid (sold) exceed those in the ask, on the contrary, the candle will be green and positive if the contracts traded in ASK (bought) exceed those in the bid.
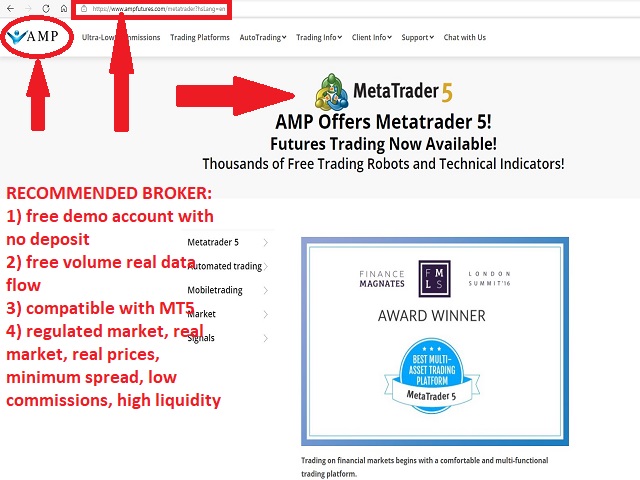
ATTENTION: The indicator only works with brokers that provide real market data flow, and that divide the contracts struck into BID and ASK. Forex, CFDs and Cryptocurrencies belong to the synthetic market, they have no real market data flow and therefore the indicator WILL NOT WORK with them. A broker that provides real market data flow, even with demo accounts, with no deposit, is the AMP FUTURE broker. Works on indices, commodities, commodities traded on the real market (e.g. CME, EUREX, ICE ...)