Basic Harmonic Patterns Dashboard MT5
- Indicators
- Mehran Sepah Mansoor
- Version: 1.70
- Updated: 23 February 2024
- Activations: 5
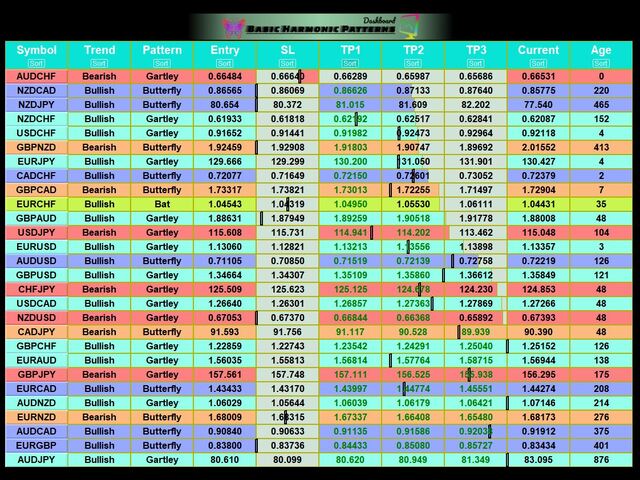
This dashboard shows the latest available Harmonic Patterns for selected symbols.
Free Indicator : Basic Harmonic Pattern
Columns
- Symbol
- Trend (Bullish/ Bearish)
- Pattern Type (Gartley/ Butterfly/ Bat/ Crab)
- Entry (Entry Price)
- SL (Stop Loss Price)
- TP1 (1st Take Profit Price)
- TP2 (2nd Take Profit Price)
- TP3 (3rd Take Profit Price)
- Current (Current Price)
- Age (Age of pattern in Bars)
- Alert Settings (Set an alert if a new pattern is found)
Main Inputs
- Symbols: Select "28 Major Forex Pairs" or "Selected Symbols"
- Selected Symbols : Desired symbols which you want to monitor separated by comma. ("EURUSD,GBPUSD,XAUUSD");
- Max Iteration: The Maximum number of iteration to fine a patterns (Lower value --> Faster Performance and Less Patterns and Higher value --> Slower Performance and More Patterns )
- Allowed Deviation: Limit patterns to have Maximum allowed deviation from the ideal ratios for each pattern.
The color scheme is completely customizable according to taste.
Warning: Using the first input, you can choose to receive delayed but valid signals. If you are familiar with harmonic patterns, you know that repainting may be better than delaying.
Important Note
The strategy tester cannot open a new chart, so clicking on the symbol and showing the pattern is for live mode only.


GREAT product. was able to make profits same day as purchase. very verse indicator with lots of GOODIES. support system is also 10 out of 10.