Heikin Ashi Volume Weighted for MT5
- Indicators
- Fernando Carreiro
- Version: 1.3
- Updated: 1 October 2023
- Activations: 20
Most traders are aware of the famous Japanese Heikin-Ashi indicator, created in 1700s by Munehisa Homma. It is sometimes spelled Heiken-Ashi, but its meaning remains the same, namely “average bar” in Japanese.
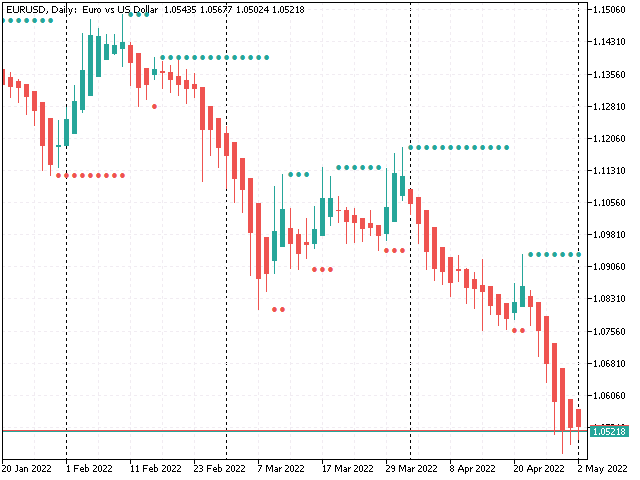
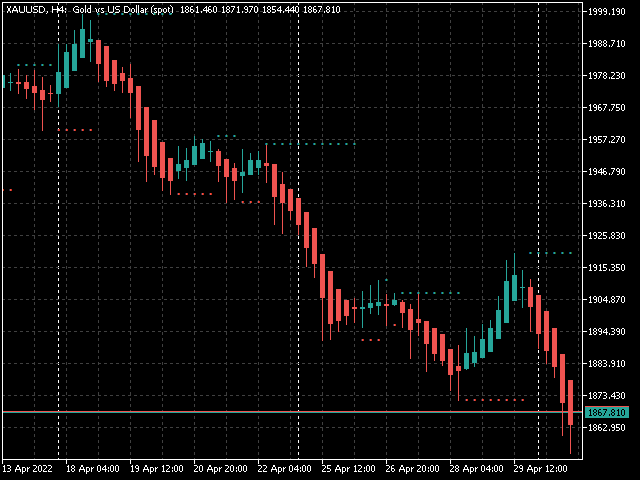
This is an implementation of that very well known Heikin Ashi indicator, but with a few added features.
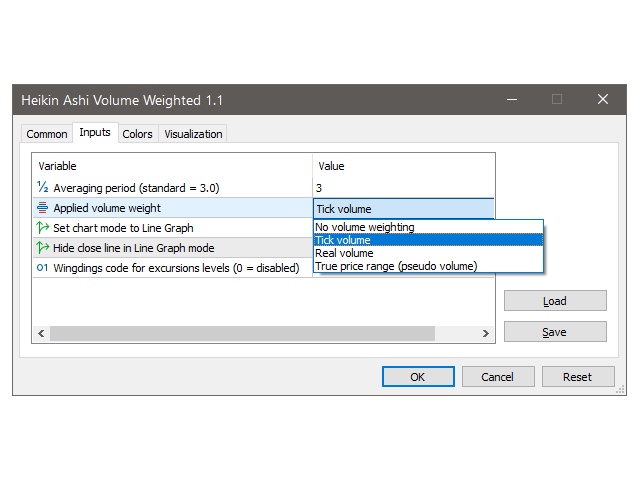
For one, it allows for its values to be weighted by the volume, be it the tick-count volume, real volume, or pseudo-volume based on the true range. The major benefit is to reduce the number of false reversals, especially during low-volume periods. It also helps to slow down the trailing of the highs and lows.
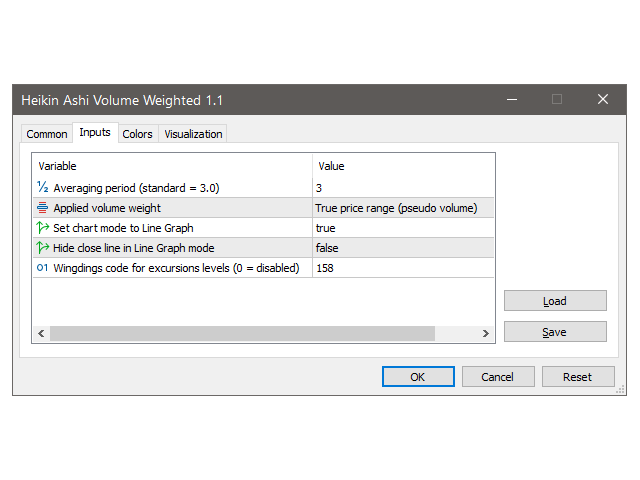
As an option, it allows the use of pseudo-volume based on the true range of the bar. This is useful for symbols that have neither real volume nor tick-count volume data available.
As an extra feature, this indicator also shows levels of maximum excursion, which can be used for stops.
Few traders understand the basis of its calculation, but the Heikin Ashi is in fact based on an exponential moving average. This implementation also allows the period to be adjusted, instead of having at a fixed pre-defined period as in the original.
It will, by default, set the underlying chart to Line-Graph. This helps reduce the display clutter, while still showing the original closing prices. You can, however, change the behaviour in its parameters.
Please note, that this indicator is available for both the MetaTrader 5 and MetaTrader 4 platforms.


I see great potential in this indicator. Fernando's experience supports it, he has gathered in a visually simple indicator, a perfect way to create a solid strategy. Thank you