• Overview
  • Reviews (2)
  • Comments (4)

RSI Currencies MT5

5

RSI Currencies is an indicator that is based on the RSI concept but with a totally different approach.

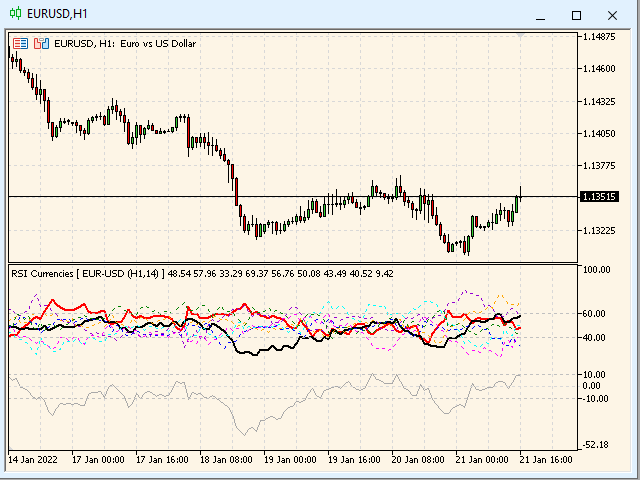
It calculates its values calculating all RSI values of all pairs related to the same currency and making an average between them: the goal is to obtain a more solid and trustable information about what each currency are doing lowering the impact of market noise and extreme euphory on a particular pair to analyze the whole basket.

It works on 28 forex majors and minor pairs related to these currencies: EUR, USD, GBP, CHF, JPY, AUD, CAD, NZD

There is also a Delta line that is nothing else than the difference of values of 2 currencies RSI for the chart pair.


Example of usage: I'm analyzing EURUSD and I see that RSI for EURUSD is around an interesting overbought area. It can be usefull to check also RSI currencies to check if both EUR is around an overbought area and USD is around an oversold area: if yes, we can consider our initial analysis "EURUSD is around an overbought area" more trustable because RSI of all pairs related to EUR and USD agree with this information.


A simple looking indicator, but full of potential.

What else to say? Try it!

Reviews 2
Maurizio Francia
255
Maurizio Francia 2022.01.25 12:13 
 

Good indicator that helps a lot in improoving analysis on forex market

Recommended products
Free automatic Fibonacci is an indicator that automatically plots a Fibonacci retracement based on the number of bars you select on the BarsToScan setting in the indicator. The Fibonacci is automatically updated in real time as new highest and lowest values appears amongst the selected bars. You can select which level values to be displayed in the indicator settings. You can also select the color of the levels thus enabling the trader to be able to attach the indicator several times with differe
FREE
Follow The Line MT5
Oliver Gideon Amofa Appiah
4.4 (30)
This indicator obeys the popular maxim that: "THE TREND IS YOUR FRIEND" It paints a GREEN line for BUY and also paints a RED line for SELL. (you can change the colors). It gives alarms and alerts of all kinds. IT DOES NOT REPAINT and can be used for all currency pairs and timeframes. Yes, as easy and simple as that. Even a newbie can use it to make great and reliable trades. NB: For best results, get my other premium indicators for more powerful and reliable signals. Get them here: https://www.m
FREE
PZ Penta O MT5
PZ TRADING SLU
4 (6)
The Penta-O is a 6-point retracement harmonacci pattern which usually precedes big market movements. Penta-O patterns can expand and repaint quite a bit. To make things easier this indicator implements a twist: it waits for a donchian breakout in the right direction before signaling the trade. The end result is an otherwise repainting indicator with a very reliable trading signal. The donchian breakout period is entered as an input. [ Installation Guide | Update Guide | Troubleshooting | FAQ | A
FREE
Are you tired of drawing trendlines every time you're analyzing charts? Or perhaps you would like more consistency in your technical analysis. Then this is for you. This indicator will draw trend lines automatically when dropped on a chart. How it works Works similar to standard deviation channel found on mt4 and mt5. It has 2 parameters: 1. Starting Bar 2. Number of bars for calculation The   starting bar   is the bar which drawing of the trend lines will begin, while the   number of bars for c
FREE
What is this indicator? This indicator is the MACD (Moving Average Convergence/Divergence) supporting Virtual Trading mode of  Knots Compositor . When the mode is turned on, the indicator will be recalculated based on the displayed candlesticks. When the mode is turned off, the indicator will be recalculated based on the original chart candlesticks. Types of the applied price - Close - Open - High - Low - Median Price (HL/2) - Typical Price (HLC/3) - Weighted Price (HLCC/4) KC-Indicators
FREE
LT Donchian Channel
Thiago Duarte
4.75 (4)
Donchian Channel is an indicator created by Richard Donchian. It is formed by taking the highest high and the lowest low of the last specified period in candles. The area between high and low is the channel for the chosen period. Its configuration is simple. It is possible to have the average between the upper and lower lines, plus you have alerts when price hits one side. If you have any questions or find any bugs, please contact me. Enjoy!
FREE
Important Lines
Terence Gronowski
4.88 (26)
This indicator displays Pivot-Lines, preday high and low, preday close and the minimum and maximum of the previous hour. You just have to put this single indicator to the chart to have all these important lines, no need to setup many single indicators. Why certain lines are important Preday high and low : These are watched by traders who trade in a daily chart. Very often, if price climbs over or falls under a preday low/high there is an acceleration in buying/selling. It is a breakout out of
FREE
Mitimom
Danil Poletavkin
The indicator is based on Robert Miner's methodology described in his book "High probability trading strategies" and displays signals along with momentum of 2 timeframes. A Stochastic oscillator is used as a momentum indicator. The settings speak for themselves period_1 is the current timeframe, 'current' period_2 is indicated - the senior timeframe is 4 or 5 times larger than the current one. For example, if the current one is 5 minutes, then the older one will be 20 minutes The rest of the
FREE
Trend Fibonacci is a unique indicator that combines a power of Fibonacci sequences and ranges. Channel Group:   Click Here How to read: - There are three zones --> red, gold and green - Red candlestick = downtrend - Green candlestick = uptrend   - Gold candlestick = no established trend Inputs: Per = number of bars used for calculations FirstRatio = first Fibonacci ratio (Or use any ratio you want) SecondRatio = second Fibonacci ratio (Or use any ratio you want) !! IF YOU PURCHASE TH
FREE
Value Chart Candlesticks
Flavio Javier Jarabeck
4.75 (8)
The idea of a Value Chart indicator was presented in the very good book I read back in 2020 , " Dynamic Trading Indicators: Winning with Value Charts and Price Action Profile ", from the authors Mark Helweg and David Stendahl. The idea is simple and the result is pure genius: Present candlestick Price analysis in a detrended way! HOW TO READ THIS INDICATOR Look for Overbought and Oversold levels. Of course, you will need to test the settings a lot to find the "correct" one for your approach.
FREE
Dual RSI
Paul Conrad Carlson
Indicator alerts for Dual Relative strength index rsi. Large rsi preset at 14 is below 30 small rsi preset at 4 is below 10 for buy bullish signals . Large rsi preset are 14 is above 70 small rsi preset at 4 is above 90 for sell bearish signals . Includes mobile and terminal alerts. draws lines when alerts. This indicator can help identify extremes and then the tops or bottoms of those extremes .
FREE
DALA Forecast
Grigorii Matsnev
About the indicator: DALA Forecast is a universal tool for predicting the dynamics of time series of any nature. For prediction, modified methods of nonlinear dynamics analysis are used, on the basis of which a predictive model is built using machine learning methods.  To get the trial version of the indicator, you can contact me in private messages. How to use the indicator: Apply the indicator to your chosen financial instrument or indicator with the settings you need. The prediction will b
FREE
TradeQL
Abdiel Aviles Jimenez
The TradeQL Indicator is a customizable tool that highlights specific trading patterns on candlestick charts. Users can define patterns through TradeQL queries, which the indicator then applies to the chart, visually representing matches and captured groups. Ideal for identifying complex trade setups in real-time. TradeQL queries are specified using the TradeQL Language. See https://github.com/abdielou/tradeql for more details. This language is expressed as a regular expression. The language a
FREE
Donchian Pro
Paulo Henrique Faquineli Garcia
5 (2)
The Donchian Channel Channels are among the most popular tools of technical analysis, as they visually convey to the analyst the limits within which most price movement tends to occur. Channel users know that valuable information can be obtained at any time, whether prices are in the central region of a band or close to one of the border lines. One of the best known techniques to explore these concepts is Bollinger Bands. However, John Bollinger was not the only one to research the applicatio
FREE
PZ Pivot Points MT5
PZ TRADING SLU
4.95 (22)
This indicator displays pivot points in the chart, including historical vales, and supports many calculation modes for Pivot Points and S/R levels. [ Installation Guide | Update Guide | Troubleshooting | FAQ | All Products ] It plots historical levels for backtesting purposes It allows you to select the reference timeframe It implements different Pivot Point calculation modes It implements different SR calculation modes It implements customizable colors and sizes Calculation Modes The indi
FREE
The indicator identifies when a divergence occurs between price and an indicator or oscillator. It identifies both regular and hidden divergences. Combined with your own rules and techniques, this indicator will allow you to create (or enhance) your own powerful system. Features Can detect divergences for the following oscillators/indicators:   MACD, OsMA, Stochastics, RSI, CCI, RVI, Awesome, ADX, ATR, OBV, Composite index, MFI and Momentum. Only one oscillator/indicator can be selected. Draws
FREE
Indicator measures strength of each currency in your list. Main idea: It simply iterates through all combinations of pairs and adds difference between open and close in percent. Parameters: List of currencies - what currencies will be calculated (maximum is 8) Calculation type - from which data will be strength calculated Calculation data input - used as input related to calculation type Symbol suffix - used in case of suffix on symbols, e.g: when your symbols look like EURUSDm, EURUSDmicro et
FREE
This indicator is a zero-lag indicator and displays  strength of trend change . True Trend  Oscillator Pro works best in combination with True Trend Moving Average Pro that displays exact trend as is. Oscillator value is exact price change in given direction of the trend. True Trend Moving Average Pro: https://www.mql5.com/en/market/product/103586 If you set PERIOD input parameter to 1 this indicator becomes a sharpshooter for binary options. Developers can use True Trend Oscillator in E
FREE
This indicator is especially for the binary trading. Time frame is 1 minutes and exp time 5 or 3 minutes only. You must be use martingale 3 step. So you must put lots size is 10 % at most. You should use Mt2 trading platform to connect with my indicator to get more signal without human working. This indicator wining rate is over 80% but you may get 100% of profit by using martingale 3 step. You should use MT2 Trading Platform to connect meta trader platform and binary platform . You can get mt2
FREE
Bar Color Trend
Germano Chagas
4.5 (10)
Combining the best of Price Action , Directional Movement , and Divergence/Convergence analysis, Candle Color Trend is a easy and reliable way to identify trend direction. The indicator automatically paints the candles according to the assumption that an uptrend is defined by prices that form a series of higher highs and higher lows. In contrast, a downtrend is defined by prices that form a series of lower highs and lower lows. Additionally, ADX Wilder indicator is used to measure trend weakness
FREE
Rainbow MT5
Jamal El Alama
4.33 (3)
Description : Rainbow MT5 is a technical indicator based on Moving Average with period 34 and very easy to use. When price crosses above MA and MA changes color to green, then this is a signal to buy. When price crosses below MA and MA changes color to red, then this is a signal to sell. The Expert advisor ( Rainbow EA MT5 ) based on Rainbow MT5 indicator is now available here . MT4 version is available here .
FREE
Introduction This indicator detects volume spread patterns for buy and sell opportunity. The patterns include demand and supply patterns. You might use each pattern for trading. However, these patterns are best used to detect the demand zone (=accumulation area) and supply zone (=distribution area). Demand pattern indicates generally potential buying opportunity. Supply pattern indicates generally potential selling opportunity. These are the underlying patterns rather than direct price action. T
FREE
This is a buyer and seller aggression indicator that analyzes the shape of each candle and project this data in a histogram form. There are 4 histograms in one. On the front we have two: Upper - Buyer force. Lower - Seller force. At the background we also have two histogram, both with same color. They measure the combined strenght of buyers and sellers. This histograms can be turned off in Input Parameters. It is also possible to have the real or tick volume to help on this force measurement. IN
FREE
Weis Waves
Flavio Javier Jarabeck
3.15 (26)
The original author is David Weis, an expert in the Wyckoff Method. The Weis Wave is a modern adaptation of the 1930's Wyckoff Method, another expert in Tape Reading techniques and Chart Analysis. Weis Waves takes market volume and stacks it into waves according to price conditions giving the trader valuable insights about the market conditions. If you want to learn more about this subject you can find tons of videos in YouTube. Just look for "The Wickoff Method", "Weis Wave" and "Volume Spread
FREE
Donchian Channel DC is the indicator of Donchian Channels, that plots maximum and minimum values of a specific period, besides mean value line. It´s possible to configure simple period for analysis and the indicator will plot all three values. You can trade with this indicator as trend or reversal, according to each strategy. Do not let to test others indicators as soon as others expert advisors.
Reversal Composite Candles
MetaQuotes Ltd.
3.43 (23)
The idea of the system is to indentify the reversal patterns using the calculation of the composite candle. The reversal patterns is similar to the "Hammer" and "Hanging Man" patterns in Japanese candlestick analysis. But it uses the composite candle instead the single candle and doesn't need the small body of the composite candle to confirm the reversal. Input parameters: Range - maximal number of bars, used in the calculation of the composite candle. Minimum - minimal size of the composite can
FREE
ZigZag Support Resistance
Emmanuel Tshepang Mosweu
5 (3)
This indicator uses the Zigzag indicator to identify swing highs and swing lows in the price chart.  Once it has identified the swing highs and swing lows, it can use them to determine potential support and resistance levels. A support level is formed when the price drops and bounces back up from a swing low, indicating that there is buying pressure at that level. A resistance level is formed when the price rises and reverses downward from a swing high, suggesting selling pressure at that level.
FREE
Forex Indicator Arrows
NGUYEN NGHIEM DUY
1 (1)
Forex Indicator Arrows is an arrow Indicator used as an assistant tool for your trading strategy. The indicator analyzes the standard deviation of bar close for a given period and generates a buy or sell signals if the deviation increases. It good to combo with Martingale EA to follow Trend and Sellect Buy Only/Sell Only for EA work Semi-Automatic. You can use this  Indicator with any EAs in my Products.
FREE
Cumulative Delta MT5
Evgeny Shevtsov
4.47 (57)
The indicator analyzes the volume scale and splits it into two components - seller volumes and buyer volumes, and also calculates the delta and cumulative delta. The indicator does not flicker or redraw, its calculation and plotting are performed fairly quickly, while using the data from the smaller (relative to the current) periods. The indicator operation modes can be switched using the Mode input variable: Buy - display only the buyer volumes. Sell - display only the seller volumes. BuySell -
FREE
This indicator is an automated version of the Fibonacci retracement (Fib) indicator. Deciding the best areas to use when drawing the fib can be tricky and this  indicator was made with that in mind. When you drop it on the chart it will automatically choose the best points to draw the fib with, but in case you aren't satisfied with those regions, you can adjust it as you wish.
FREE
Buyers of this product also purchase
Atomic Analyst MT5
Issam Kassas
5 (8)
First of all Its worth emphasizing here that this Trading Indicator is   Non-Repainting ,   Non-Redrawing   and   Non-Lagging   Indicator, Which makes it ideal from both manual and robot trading.  The Atomic Analyst  is a PA Price Action Indicator that uses Strength and Momentum of the price to find a better edge in the market. Equipped with an AI filter which help remove noises and false signals, and Increase Trading Potential. Using Multiple layers of complex Indicators, the Atomic Analyst
First of all Its worth emphasizing here that this Trading System is Non-Repainting , Non-Redrawing and Non-Lagging Indicator , Which makes it ideal from both manual and robot trading .  The Smart Trend Trading System MT5 is a comprehensive trading solution tailored for new and experienced traders . It combines over 10 premium indicators and features more than 7 robust trading strategies , making it a versatile choice for diverse market conditions . Trend Following Strategy : Provides precise ent
Quantum Trend Sniper
Bogdan Ion Puscasu
5 (36)
Introducing   Quantum Trend Sniper Indicator , the groundbreaking MQL5 Indicator that's transforming the way you identify and trade trend reversals! Developed by a team of experienced traders with trading experience of over 13 years,   Quantum Trend Sniper Indicator   is designed to propel your trading journey to new heights with its innovative way of identifying trend reversals with extremely high accuracy. ***Buy Quantum Trend Sniper Indicator and you could get Quantum Breakout Indicator fo
Trend Screener Pro MT5
STE S.S.COMPANY
4.88 (60)
Unlock the Power of  Trends trading with Trend Screener Indicator: Your Ultimate Trend Trading Solution powered by fuzzy logic and Multi-currencies System ! Elevate your trend trading with Trend Screener, the revolutionary trend indicator powered by   fuzzy logic.  It is a powerful trend-following indicator that combines over  13 premium tools and features and 3 trading strategies  , making it a versatile choice to   make your Metatrader a Trend Analyzer. LIMITED TIME OFFER : Trend Screener Indi
Gold Stuff mt5
Vasiliy Strukov
4.88 (162)
Gold Stuff mt5 is a trend indicator designed specifically for gold and can also be used on any financial instrument. The indicator does not redraw and does not lag. Recommended time frame H1. Contact me immediately after the purchase to get   personal bonus! Settings  and manual   here   SETTINGS Draw Arrow - on off. drawing arrows on the chart. Alerts -   on off audible alerts. E-mail notification - on off. email notifications. Puch-notification - on off. Push notifications. Next, adjust the co
Advanced Supply Demand MT5
Bernhard Schweigert
4.53 (15)
Best Solution for any Newbie or Expert Trader! This indicator is a unique, high quality and affordable trading tool because we have incorporated a number of proprietary features and a new formula. With this update, you will be able to show double timeframe zones. You will not only be able to show a higher TF but to show both, the chart TF, PLUS the higher TF: SHOWING NESTED ZONES. All Supply Demand traders will love it. :) Important Information Revealed Maximize the potential of Advanced Suppl
First of all Its worth emphasizing here that this Trading Tool is Non Repainting , Non Redrawing and Non Lagging Indicator , Which makes it ideal for professional trading . The Smart Price Action Concepts Indicator is a very powerful tool for both new and experienced traders . It packs more than 20 useful indicators into one , combining advanced trading ideas like Inner Circle Trader Analysis and Smart Money Concepts Trading Strategies . This indicator focuses on Smart Money Concepts , prov
RelicusRoad Pro MT5
Relicus LLC
4.81 (21)
How many times have you bought a trading indicator with great back-tests, live account performance proof with fantastic numbers and stats all over the place but after using it, you end up blowing your account? You shouldn't trust a signal by itself, you need to know why it appeared in the first place, and that's what RelicusRoad Pro does best! NOW $147 (increasing to $499 after a few updates) - UNLIMITED ACCOUNTS (PCs or MACs) **  User Manual + Strategies + Training Videos + Private Group with
FX Volume MT5
Daniel Stein
4.94 (17)
Visit our all-new   Stein Investments Welcome Page   to get the latest information, updates and trading strategies. FX Volume is the FIRST and ONLY volume indicator that provides a REAL insight into the market sentiment from a broker's point of view. It provides awesome insights into how institutional market participants, like brokers, are positioned in the Forex market, much faster than COT reports. Seeing this information directly on your chart is the real game-changer and breakthrough solut
FX Power MT5 NG
Daniel Stein
5 (4)
Trading GOLD, and currencies, with the dog walk strategy  - super smart Trading GOLD, and currencies, with the breakout strategy  - super easy Visit our all-new   Stein Investments Welcome Page   to get the latest information, updates and trading strategies. FX Power MT5 NG  is the next generation of our long-time very popular currency strength meter, FX Power.  And what does this next-generation strength meter offer? Everything you have loved about the original FX Power  PLUS GOLD/XAU st
XQ Indicator MetaTrader 5
Marzena Maria Szmit
5 (1)
Step into the realm of Forex trading with confidence and precision using XQ, a cutting-edge Forex indicator designed to elevate your trading game to unprecedented heights. Whether you're a seasoned trader or just stepping into the world of currency exchange, XQ Forex Indicator empowers you with the insights and signals needed to make informed trading decisions. The signal conditions are a combination of three indicators, and XQ Forex Indicator only display  medium and long-term trends . The ind
Top indicator for MT5   providing accurate signals to enter a trade without repainting! It can be applied to any financial assets:   forex, cryptocurrencies, metals, stocks, indices .  Watch  the video  (6:22) with an example of processing only one signal that paid off the indicator! MT4 version is here It will provide pretty accurate trading signals and tell you when it's best to open a trade and close it. Most traders improve their trading results during the first trading week with the help of
Introducing   Quantum Breakout PRO , the groundbreaking MQL5 Indicator that's transforming the way you trade Breakout Zones! Developed by a team of experienced traders with trading experience of over 13 years,   Quantum Breakout PRO   is designed to propel your trading journey to new heights with its innovative and dynamic breakout zone strategy. Quantum Breakout Indicator will give you signal arrows on breakout zones with 5 profit target zones and stop loss suggestion based on the breako
Bill Williams Advanced
Siarhei Vashchylka
5 (3)
Bill Williams Advanced is designed for automatic chart analysis using Bill Williams' "Profitunity" system. The indicator analyzes four timeframes at once. Manual (Be sure to read before purchasing) Advantages 1. Automatically analyzes the chart using the "Profitunity" system of Bill Williams. The found signals are placed in a table in the corner of the screen. 2. Equipped with a trend filter based on the Alligator indicator. Most of the system signals are recommended to be used only accordi
AW Trend Predictor MT5
AW Trading Software Limited
4.76 (54)
The combination of trend and breakdown levels in one system. An advanced indicator algorithm filters market noise, determines the trend, entry points, as well as possible exit levels. Indicator signals are recorded in a statistical module, which allows you to select the most suitable tools, showing the effectiveness of the signal history. The indicator calculates Take Profit and Stop Loss marks. Manual and instruction ->  HERE  / MT4 version ->  HERE How to trade with the indicator:  Trading wit
TPSproTREND PrO MT5
Roman Podpora
5 (5)
TPSpro TRENDPRO  - is a trend indicator that automatically analyzes the market and provides information about the trend and each of its changes, as well as giving signals for entering trades without redrawing! The indicator uses each candle, analyzing them separately. referring to different impulses - up or down impulse. Exact entry points into transactions for currencies, crypto, metals, stocks, indices!  -  Version MT4                  DETAILED DESCRIPTION        /       TRADING SETUPS       
Owl Smart Levels MT5
Sergey Ermolov
4.47 (36)
MT4 version  |   FAQ The Owl Smart Levels Indicator is a complete trading system within the one indicator that includes such popular market analysis tools as Bill Williams' advanced fractals , Valable ZigZag which builds the correct wave structure of the market, and Fibonacci levels which mark the exact levels of entry into the market and places to take profits. Detailed description of the strategy Instructions for working with the indicator Advisor-assistant in trading Owl Helper Private User
Profit from market structure changes as price reverses and pulls back. The market structure reversal alert indicator identifies when a trend or price move is approaching exhaustion and ready to reverse. It alerts you to changes in market structure which typically occur when a reversal or major pullback are about to happen. The indicator identifies breakouts and price momentum initially, every time a new high or low is formed near a possible exhaustion point. The indicator draws in a rectangle on
Auto Order Block with break of structure based on ICT and Smart Money Concepts Futures Break of Structure ( BoS )             Order block ( OB )            Higher time frame Order block / Point of Interest ( POI )    shown on current chart           Fair value Gap ( FVG ) / Imbalance   ,  MTF      ( Multi Time Frame )    Volume Imbalance     ,  MTF          vIMB Gap’s Equal High / Low’s     ,  MTF             EQH / EQL Liquidity               Current Day High / Low           HOD /
TrendDecoder Premium MT5
Christophe, Pa Trouillas
5 (1)
Identify ranges  | Get earliest signals of Trends  | Get clear exits before reversal  | Spot the Fibo levels the price will test Non-repainting, non-delayed indicator - ideal for manual and automated trading - for all assets and all time units $69   for launch - then back to >>   $149 After purchase,   please contact me on this channel   for recommended and personalised settings MT4   version:  Click here Get our full method with  BladeSCALPER  and   PowerZONES What is it about? TrendDECODER
Golden Gate Algo MT5
James David Lane
4 (6)
Introducing GoldenGate Algo: A Cutting-Edge Trading Solution!  Discover a revolutionary approach to trading with GoldenGate Algo (GGA), an advanced indicator designed to elevate your trading experience. GGA provides a comprehensive set of features to empower users with precision and confidence in their trading decisions. No re-painting! Pairs:   Any TimeFrames:   15m up to H1 Key Features: Buy and Sell Arrow Indications:   Receive Buy and Sell arrow indications accompanied by pop-up alerts,
ICT, SMC, SMART MONEY CONCEPTS, SMART MONEY, Smart Money Concept, Support and Resistance, Trend Analysis, Price Action, Market Structure, Order Blocks, BOS/CHoCH,   Breaker Blocks ,  Momentum Shift,   Supply&Demand Zone/Order Blocks , Strong Imbalance,   HH/LL/HL/LH,    Fair Value Gap, FVG, Inversion FVG, IFVG,  Premium  &   Discount   Zones, Fibonacci Retracement, OTE, Buy Side Liquidity, Sell Side Liquidity, BSL/SSL Taken, Equal Highs & Lows, MTF Dashboard, Multiple Time Frame, BigBar, HTF OB
TrendLine PRO MT5
Evgenii Aksenov
4.78 (49)
The Trend Line PRO indicator is an independent trading strategy. It shows the trend change, the entry point to the transaction, as well as automatically calculates three levels of Take Profit and Stop Loss protection Trend Line PRO is perfect for all Meta Trader symbols: currencies, metals, cryptocurrencies, stocks and indices Advantages of Trend Line PRO Never redraws its signals The possibility of using it as an independent strategy It has three automatic levels Take Profit and Stop Loss lev
Gartley Hunter MT5
Siarhei Vashchylka
5 (13)
Gartley Hunter - An indicator for searching for harmonic patterns (Gartley patterns) and their projections. The indicator is equipped with a system of alerts and push notifications. Manual (Be sure to read before purchasing) | Version for MT4 Advantages 1. 12 harmonic patterns: 7 classical and 5 exotic. New patterns will be added as the indicator develops. 2. Constant automatic search for harmonic patterns. The indicator is capable of finding from the smallest to the largest patterns. 3. Autom
Gartley Hunter Multi
Siarhei Vashchylka
5 (5)
Gartley Hunter Multi - An indicator for searching for harmonic patterns simultaneously on dozens of trading instruments and on all classic timeframes: (m1, m5, m15, m30, H1, H4, D1, Wk, Mn). Manual (Be sure to read before purchasing) | Version for MT4 Advantages 1. Patterns: Gartley, Butterfly, Shark, Crab. Bat, Alternate Bat, Deep Crab, Cypher 2. Simultaneous search for patterns on dozens of trading instruments and on all classic timeframes 3. Search for patterns of all possible sizes. Fr
A key element in trading is zones or levels from which decisions to buy or sell a trading instrument are made. Despite attempts by major players to conceal their presence in the market, they inevitably leave traces. Our task was to learn how to identify these traces and interpret them correctly. Reversal First Impulse levels (RFI)   -  Version MT4                  INSTRUCTIONS                 RUS                 ENG                         R ecommended to use with an indicator   -  TREND PRO  
IX Power MT5
Daniel Stein
5 (1)
IX Power   finally brings the unbeatable precision of FX Power to non-Forex symbols. It accurately determines the intensity of short, medium and long-term trends in your favourite indices, stocks, commodities, ETFs, and even cryptocurrencies. You can   analyse everything   your terminal has to offer. Try it out and experience how   your timing improves significantly   when trading. Read about our latest strategic development -  Easy scalping with IX Power Visit our all-new   Stein Investments
Was: $249  Now: $99   Market Profile defines a number of day types that can help the trader to determine market behaviour. A key feature is the Value Area, representing the range of price action where 70% of trading took place. Understanding the Value Area can give traders valuable insight into market direction and establish the higher odds trade. It is an excellent addition to any system you may be using. Inspired by Jim Dalton’s book “Mind Over Markets”, this indicator is designed to suit the
Volume by Price MT5
Brian Collard
5 (3)
The Volume by Price Indicator for MetaTrader 5 features Volume Profile and Market Profile TPO (Time Price Opportunity). Get valuable insights out of currencies, equities and commodities data. Gain an edge trading financial markets. Volume and TPO histogram bar and line charts. Volume Footprint charts. TPO letter and block marker charts including split structures. Versatile segmentation and compositing methods. Static, dynamic and flexible ranges with relative and/or absolute visualizations. Lay
The RSI / TDI alert dashboard allows you to monitor RSIs at once (selectable by you) on every major pair you trade. You can use it in two ways: 1.   Select multiple time frames and the dash will show you when there are multiple time frames extended beyond normal trading conditions. A great indicator that price has pushed hard recently as it has achieved an overbought or oversold level across multiple time frames so a pullback or reversal is due soon. 2.   Use one time frame (your favourite to tr
More from author
The Forex Exchanger MT5
Fabio Cavalloni
5 (6)
All explainations about the strategy:  https://www.mql5.com/en/blogs/post/747470 Live signals:  Main account:  https://www.mql5.com/en/signals/1416185 Second account:  https://www.mql5.com/en/signals/2111323 Here I will explain only the EA inputs part. This EA will be consistently updated with new and unpredictable things that can bring its performance to a better level every day! Buying this EA you will not only got a powerful automatic trading system, but also all knowledge and experience I'
Relax EA MT5
Fabio Cavalloni
5 (1)
Live monitoring   signal NOTE: This is for monitoring only, do not subscribe to signal! This EA trade in a very delicate way during very delicate time, be smart and don’t use copy signals service. Discrepancies in quotations, spreads, trading hours and delay in copying trades will make almost impossible to have same results. Relax EA open trades at the end of Friday trading session looking for specific patterns, volatility and momentum on several timeframes: main idea is to catch quickly and pr
Quick Trade MT5
Fabio Cavalloni
4.94 (18)
Quick Trade is a simple but needful utility for MT5 that allows to set SL, TP and entry price for a trade in a couple of seconds, allowing also shaping right position size based on risk wanted. It provide shortcuts to save more time and of course, you can also put values typing with keyboard or drag lines at your desired value! Shortcut Action CTRL + Click Set SL Shift + Click Set TP z + Click Set Price A simple utility that you will start to love if you do manual trading. Stop calculating ris
FREE
Thermo MAP MT5
Fabio Cavalloni
4 (5)
Thermo MAP is a multicurrency and multitimeframe indicator that display a smart heat map based on proprietary calculations. Watch how Forex market moved and is currently moving with a single dashboard and have a consistent and good idea of what is happening! It can be suitable for both scalping or medium/long term, just select options that better fit your trading style Symbols list are automatically sorted based on the preferred column. There is the possibility to click on: First row, timefram
FREE
Spread Monitor MT5
Fabio Cavalloni
5 (1)
This is a usefull utility for monitoring spread and also for recording informations to a file. (Files will be placed into "Common\Files\Spread Monitor"). There is the possibility to let the indicator calculate high/low into the past thanks to downloading ticks. (It's a slow and approsimate thing! The best way to use it is to attach to a chart and let it recording spread in real time). There is also a buffer with the average of spread in latest X periods. Easy and effective.
FREE
OnBoard stats MT5
Fabio Cavalloni
5 (5)
OnBoard stats is a panel that show in a single view a lot of usefull information about working orders and trading account. It has 4 different sub-panels (from left to right): Symbols order statistics : it can be found symbols for which there are orders (market or pendings). Symbol with pendings are colored with "Pendings color". Clicking on a specific symbol row, chart will be changed to that symbol. Current symbol statistics : informations about the "current" symbol, the one which is opened in
FREE
OnBoard stats
Fabio Cavalloni
5 (9)
OnBoard stats is a panel that show in a single view a lot of usefull information about working orders and trading account. It has 4 different sub-panels (from left to right): Symbols order statistics : it can be found symbols for which there are orders (market or pendings). Symbol with pendings are colored with "Pendings color". Clicking on a specific symbol row, chart will be changed to that symbol. Current symbol statistics : informations about the "current" symbol, the one which is opened in
FREE
Forex Meter Oscillator
Fabio Cavalloni
5 (4)
Forex Meter Oscillator is an indicator that can give a whole view of forex market from a single chart, measuring currency strenghts among 28 forex pairs (majors and minors). The "oscillator" word is very meaningful: it normalizes currency strenghts in order to provide values in a predefined range (from -1 to 1). What are normalization's advantages? It's so simple, values will always be in a pre-defined range that reflect exactly the current value compared to the last N values. In this way you
Filter:
Milko Vivaldi
309
Milko Vivaldi 2023.05.27 11:10 
 

Why I have this problem? cannot load indicator 'Relative Strength Index' [4805] Handle failed!

Maurizio Francia
255
Maurizio Francia 2022.01.25 12:13 
 

Good indicator that helps a lot in improoving analysis on forex market

Reply to review