• Overview
  • Reviews (4)
  • Comments

One Moving Average

3.75

This indicator was created based on posts from forex factory thread titled There is no Magic Moving Average - You need only one - by @andose2 a.k.a Andrei Florin.

If you want to know about how to use this trading strategy please go and read https://www.forexfactory.com/thread/691864-there-is-no-magic-moving-average-you.


Note: Below are extracts some of the posts.


Estabilish a trend, based on Market Cycles, then go only long in the Markup Phase and only short in the Decline phase, stay out in Accumulation and Distribution phases.

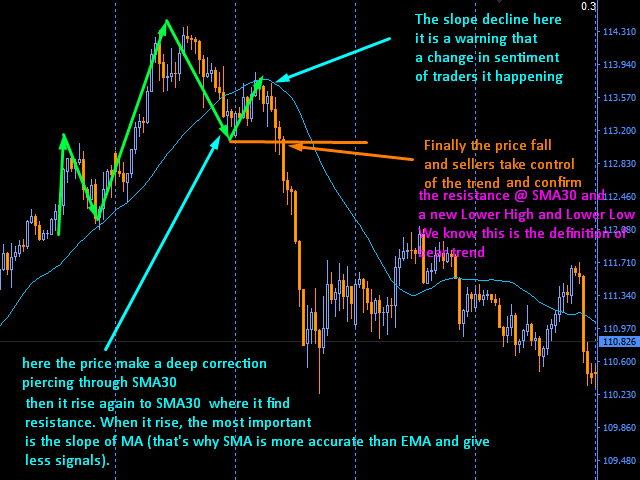
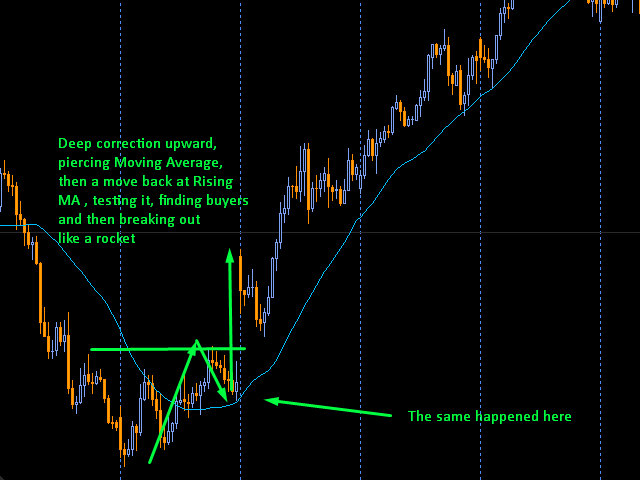
Markup - Market phase with Higher Highs and Higher Lows => Bulls are controlling the trend.
Decline - Market phase with Lower Highs and Lower Lows => Bears are controlling the trend.
Accumulation - Market phase where bears and bulls are fighting with bulls as  potential winners.
Distribution - Market phase where bulls and bears are fighting with bears as  potential winners.
Sell the Distribution within fresh confirmed Decline to maximize gains.
Buy the Accumulation within fresh confirmed Markup to maximize gains.
Avoid to sell Distribution and Decline within Markup Phase.
Avoid to buy Accumulation and Markup within Distribution Phase.

Question : Wich Moving averages do you recommend ?
Answer : Depending of the timeframe you use.

Question : is this the Holy Grail ?
Answer : If you are searching for Holy Grail on a public trading forum, then I wish you sweet dreams.

Question : Why ?
Answer : You need to practice and also create your own risk-management strategy

For Day trades :
switch on 15m with a Simple Moving Average set on CLOSE with period of 48 (app.50) (12h Timeframe)
switch on 5m with a Simple Moving Average set on CLOSE with period of 96 (app.100) (8h Timeframe)
switch on 5m with a Simple Moving Average set on CLOSE with period of 72 (6h Timeframe)
switch on 5m with a Simple Moving Average set on CLOSE with period of 36 (3h Timeframe)

Swing Trades :

switch on 4h with a Simple Moving Average set on CLOSE with period of 30 (1w Timeframe)
switch on 1h with a Simple Moving Average set on CLOSE with period of 96 (4D Timeframe)
switch on 1h with a Simple Moving Average set on CLOSE with period of 72 (3D Timeframe)
switch on 1h with a Simple Moving Average set on CLOSE with period of 48 (2D Timeframe)

Position Trades :

switch on 1D with a Simple Moving Average set on CLOSE with period of 60 (3Mo Timeframe)
switch on 1D with a Simple Moving Average set on CLOSE with period of 120 (6 Mo Timeframe)
switch on 1W with a Simple Moving Average set on CLOSE with period of 48 (1Y Timeframe)
switch on 1Mo with a Simple Moving Average set on CLOSE with period of 24 (2Y Timeframe)

For more please visit the forex faxtory thread here

Reviews 4
Birds_eye
239
Birds_eye 2023.06.16 17:57 
 

A very useful indicator. Excellent work as always

Zé Roberto
657
Zé Roberto 2022.11.16 22:04 
 

Obrigado por compartilhar

Mauritz Lourens
708
Mauritz Lourens 2022.06.04 11:05 
 

Good to use with other indicators in a strategy. Seems to be in harmony with order blocks. It is a nice MA. It is an MA, but a very user friendly one. A bit like Fourier extrapolated MA with some very nice custom settings for timeframes. Would like to see author perhaps include Fourier extrapolated moving average into this indicator. Imagine a multi timeframe Fourier. Would be awesome.

Recommended products
YY Mono Waves MT5
Yuryi Yatsenko
4 (2)
The Mono Waves indicator is designed to display the wave behavior of the market on a chart. Its appearance is presented on slide 1.   This indicator uses the PPPC (Point-Percent Price Channel) indicator, which can be downloaded for free from the  Market .              When the market moves up, the upper border of the price channel is built on High candlestick prices (for more details, see the description of the PPPC indicator at the link given above). The higher the High prices rise
FREE
Heikin Ashi MACD
Wojciech Daniel Knoff
5 (2)
Check my version of the moving average convergence divergence (MACD) indicator based on Heikin Ashi calculations. Here you find multi-colored histogram which corresponds to bull (green) / bear(red) trend. Dark and light colors describes weakness/strenght of price trend in time. Also you can switch calculations between normal and Heikin Ashi price type. Note: Buffers numbers for iCustom: 0-MACD, 2-Signal line
FREE
Moving Average  ******************* Moving Average для платформы секундных графиков Micro . ********************* Секундный график на порядок увеличит точность ваших входов и выходов. Секундный период , в привычном формате,   позволит увидеть то, что ранее было скрыто. Бесплатные индикаторы, дополнят визуальную картину, что, в совокупности выведет вашу торговлю на новый уровень. Идеально подходит как скальперам, так и трейдерам торгующим внутри дня.  Индикатор  Moving Average для платформы Micr
FREE
TickChart Indicator plots tick line on the main window of MetaTrader. In the Lite version, the number of ticks is limited to 20 and the alert function described below is omitted.  The tick-line shows the most detailed, fastest and real-time activities of the market, which are usually hidden in bars or candles longer than 1 minute. Usually, several new tick-line segments appear while a bar of M1 time frame is completed. After the release of an important economic indicator, the number of ticks pe
FREE
Estratégia de negociação MACD O cálculo do MACD é executado uma vez a cada tick, e são considerados para fim de cálculo os três últimos resultados, para analisar o cruzamento da linha de zero, ou seja quando o último resultado for maior que 0 e o antepenúltimo não então há um cruzamento para cima e analogamente para baixo, quando um cruzamento é constatado o estado de uma variável de controle é alterado de "false" para "true", permitindo o abertura de uma posição caso a média de sinal também cru
FREE
This indicator is a zero-lag indicator and displays  strength of trend change . True Trend  Oscillator Pro works best in combination with True Trend Moving Average Pro that displays exact trend as is. Oscillator value is exact price change in given direction of the trend. True Trend Moving Average Pro: https://www.mql5.com/en/market/product/103586 If you set PERIOD input parameter to 1 this indicator becomes a sharpshooter for binary options. Developers can use True Trend Oscillator in E
FREE
EasyBot Bollinger Bands
MARIO DANIELE SCRETI
About the Bollinger Bands The Bollinger Bands indicator was invented by John Bollinger in the 1980s. The Bollinger Bands consist of a Moving Average, an Upper and a Lower Band and is included in Metatrader 5. The default settings are 20 for the period and 2 for the deviation. EasyBot Bollinger Bands is an expert advisor developed with the idea to be useful for traders who love to trade using the popular indicator Bollinger Bands. EasyBot Bollinger Bands has very simple trading logic. When the
FREE
Ichimoku Trend Alert is the Ichimoku Kinko Hyo indicator with Alerts and signal filters. Ichimoku Trend Alert features: Optional check of Ichimoku cloud, Tenkan sen(Conversion Line), Kijun sen(Base Line), Senkou span A, Senkou span B, and Chikou span relative to price, and more. Popup, email, and phone notification alerts for selected symbols and timeframes. There are 9 classic Ichimoku trend filters you can enable/disable in settings: Price/Cloud Order:   Checks the price position relative
FREE
RSI Scanner Sheet Pro
Arkadii Zagorulko
3 (2)
The RSI (Relative Strength Index) scanner is a powerful technical analysis tool designed to help traders and investors identify potential trading opportunities in the forex, stocks, and cryptocurrency markets. RSI is a popular momentum oscillator that measures the speed and change of price movements and helps determine overbought or oversold conditions in an asset. The scanner takes advantage of this indicator to streamline the process of finding trading signals and opportunities. The RSI value
FREE
This indicator is a zero-lag indicator and displays exact trend as is. True Trend Moving Average Pro works best in combination with  True Trend Oscillator Pro that displays strength of trend change. True Trend Oscillator Pro: https://www.mql5.com/en/market/product/103589 If you set PERIOD input parameter to 1 this indicator becomes a sharpshooter for binary options. Default input parameters: TT_Period = 10; TT_Meth = MODE_SMA; TT_Price = PRICE_MEDIAN; Before you buy this product, please
FREE
Features Indicator for Fibonacci Retracement Trading A Fibonacci chart is drawn based on the previous bar selected among 1H, 4H, 1D, and 1W. When the market price touches the Fibonacci level, the color changes and the touch time is displayed. The Fibonacci graph is drawn at -23.6, 0, 23.6, 38.2, 50, 61.8, 76.4, 100, and 123.6 levels and the chart refreshes when the bar is updated. Variables Timeframe : A Fibonacci chart is drawn with the selected time frame among 1H, 4H, 1D, and 1W. Fib
FREE
RSI Chart Levels
Nikolay Mitrofanov
5 (6)
The indicator draws levels based on the overbought and oversold values ​​of the RSI indicator. The maximum values ​​are taken into account, which are equal to or exceeded certain limits. That is, for example, when the price has gone into the overbought zone, the highest price is selected from all prices in this zone for this period of time, and as soon as the indicator value returns to a value below the overbought value, the level is fixed and the calculation of new values ​​begins. The sam
FREE
Multi-timeframe trend indicator based on the ADX / ADXWilder indicator with Fibonacci levels The indicator shows trend areas using ADX or ADXWilder indicator data from multiple timeframes. The impulse mode of the indicator allows you to catch the beginning of a trend, and several "Screens" with different timeframes allow you to filter out market noise. Fibonacci levels are added to the price chart, which have flexible settings. How the indicator works: if PDI is greater than NDI, then   it`
FREE
Bulls Bears Force
Flavio Javier Jarabeck
5 (4)
Welcome to the Minions Labs' reinterpretation of the Classic Bulls & Bears Power , developed by Alexander Elder a long ago. Since the 2 indicators: Bull Power and Bear Power were histogram-based indicators and having 2 indicators in the same chart and occupy too much screen, we decided to mix them into ONE Line and Color-based indicator, which give us all the information we need. The Bull & Bear Power indicators help you determine the strength of BUYERS (Bulls) vs. SELLERS (Bears). Basically, it
FREE
Micro MACD
Aleksandr Goryachev
MACD  ******************** MACD для платформы секундных графиков Micro . ********************* Секундный график на порядок увеличит точность ваших входов и выходов. Секундный период , в привычном формате,   позволит увидеть то, что ранее было скрыто. Бесплатные индикаторы, дополнят визуальную картину, что, в совокупности выведет вашу торговлю на новый уровень. Идеально подходит как скальперам, так и трейдерам торгующим внутри дня.  Индикатор  MACD для платформы Micro. Входные параметры:
FREE
YY PP Price Channel MT5
Yuryi Yatsenko
4.75 (4)
The Point-Percent Price Channel (PPPC or PP Price Channel) indicator is designed to display on the chart a channel whose width is specified both as a percentage of the current price and in points. Its appearance is presented on slide 1.             When the market moves up, the upper border of the channel is built at the price of High candles. In this case, the lower boundary follows the upper one at a strictly specified distance. When the price touches the lower border of the channe
FREE
Investment Castle Support and Resistance
Ahmed Alaaeldin Abdulrahman Ahmed Elherzawi
5 (5)
Investment Castle Support and Resistance Indicator has the following features: 1.  Dictates the direction of Buy or Sell trades based on Support and Resistance Levels automatically . 2.  Candles stick colors will change to Red for Sell and Blue for Buy (Default settings, user can change from the inputs). 3. This indicator is built-in the Support & Resistance based Investment Castle EA which works with Psychological Key Levels "Support & Resistance".
FREE
LT Force
Thiago Duarte
5 (6)
For those who like trend the Force will be a very useful indicator. This is because it is based on the famouse ADX, which measure the strenght of a trend, but without its 3 confusing lines. Force has its very simple interpretation: if the histogram is above zero level the trend is up, otherwise it is down. You can use it to find divergences too, which is very profitable. Thanks to Andre Sens for the version 1.1 idea. If you have any doubt or suggestion, please, contact me. Enjoy! This is a fre
FREE
Demo Version of Strategy Manager Plus ! This Demo is a simply view of the Dashboard with the followings strategy :    - if SMA 6 is upper than SMA 18 --> Blue color    - if SMA 6 is lower than SMA 18 --> Red Color No need of the external GUI, Load configuration is not available, no manual trading is available. Visit  https://www.mql5.com/en/market/product/46420  for full version !
FREE
Floating peaks oscillator - it the manual trading system. It's based on Stochastik/RSI type of oscillator with dynamic/floating  overbought and oversold levels. When main line is green - market is under bullish pressure, when main line is red - market is under bearish pressure. Buy arrow appears at the floating bottom and sell arrow appears at floating top. Indicator allows to reverse signal types. Main indicator's adjustable inputs : mainTrendPeriod; signalTrendPeriod; smoothedTrendPeriod; tre
GoldTrader
Yashar Seyyedin
Please backtest with the exact balance of your live account before applying to real money. ==> If account balance is too low it may not trade at all! For MT4 version please contact via private message. martingale version is available here . Strategy description - Detect trend based on EMA18-EMA50-SMA200 alignment in three time frames: M15, H1, H4 - Trade in trend direction and exit when above alignment is broken. - The bot is tuned to trade XAUUSD(Gold). - The bot output is break even in rangi
FREE
Engulfing Candle Detector Detectable pattern Double Candlestick Patterns Bullish Engulfing The first candle is black candle. The second candle opens with a gap below the real body of the black candle but rallies upwards to close above the real body of the black candle. In other words, the second candle's real body completely engulfs the first candle's real body Bearish Engulfing The first candle is white candle. The second candle opens with a gap above the real body of the white candle but
FREE
Analyze potential   Covered Call   structures in the Brazilian market. Define where you want the break-even of your structure and see what structure to use. It works for any asset that has authorized series of options on B3 (Brazilian Stock Exchange). Associate the indicator to the asset you want to set up the Covered Call. *** ATENTION *** For the robot to work, the service that consults the authorized series of B3 options must be running on your terminal. Download the utility for free from
FREE
Tillson TMA T3
Emin Ulucanli
5 (5)
TILLSON MOVING AVERAGE Also known as TMA or T3 indicator. It is a moving average that uses EMA and DEMA in its formula and is calculated with the 3rd degree Binomial expansion.       ...    int      handle1;     //Handle of the Tillson TMA T3.EX5 custom indicator    double   euBuff1[];    int TMAperiod= 12 ;    int TMSshift= 0 ;    double VolumeFactor= 0.618 ;    int OnInit ()    {    ...    handle1= iCustom ( NULL , PERIOD_CURRENT , "Market\\Tillson TMA T3.EX5" ,0,TMAperiod,0,0,TMSshift,0,0,Vol
FREE
MP Heatmap for MT5
Pierre Ksachikian
4 (2)
A heatmap is a graphical representation of data in two dimensions, using colors to display different factors. Heatmaps are a helpful visual aid for viewers, enabling the quick dissemination of statistical or data-driven information. The MP Heatmap indicator provides a graphical representation of the relative strengths of major currencies compared to others, organizing data from pairs into color-coded results and producing a clear overview of the entire Forex market. The MP Heatmap indicator dis
FREE
Menora Indicator
Arnold Kurapa
4 (1)
Menora (All In One) Indicator. This is the advanced and premium indicator for the Magic Trend, a free indicator.  It has 3 output signals driven by different market conditions. This indicator has a double function of working as an indicator and utility at the same time. Specifications  1]  3 output signals a) Slow Moving Average with color change - The MA has a non-repaint color change, which makes it perfect for entry signals. b) Fast Moving Average (the original Magic Trend line) - Give
FREE
Best SAR MT5
Ashkan Hazegh Nikrou
5 (1)
Description :  we are happy to introduce our new free indicator based on one of professional and popular indicators in forex market (Parabolic SAR) this indicator is new modification on original Parabolic SAR indicator, in pro SAR indicator you can see cross over between dots and price chart, this crossover is not signal but talk about end of movement potential, you can start buy by new blue dot, and place stop loss one atr before first blue dot, and finally you can exit as soon as dots cross
FREE
Simple Long Term MACD
Stephen Carmody
1 (1)
Long Term Double MACD Strategy with EMA Trend Confirmation This strategy uses a leading and lagging MACD indicator. The leading indicator gives the entry signals, and the lagging indicator gives the exit signals. This Expert does not use any account management and as such you should make sure to set good stop losses. Works best on longer timeframes on low volatility pairs.
FREE
Standard PVSR
Ashok Kumar Singha
Standard PVSR is based on Pivot Points. Steps to Setup the Indicator: Install the Custom Indicator; Set all the Lines Color, Width and Styles; Set visualization to All Timeframe; and DONE It can be used for: All Pairs: Forex, Cryptocurrencies, Metals, Stocks, Indices etc. All Timeframe All Brokers All type of Trading Style like Scalping, Swing, Intraday, Short-Term, Long-Term etc. Multiple Chart -->> For any Type of Support, Guidance, Setup Issue, EA Optimization, Input Setup etc.
FREE
Leave a comment if you would like me to write an EA to trade these trendlines... if enough interest, will write an EA. Automatic Trendlines, updated automatically. To Set up 3 different (or mroe) Trendlines on chart, simply load the indicator as many times and name it differntly.. the example in the picture below is indicator 1 (loaded 1st time): Name: Long, StartBar: 50, BarCount: 500, Color: Pink indicator 2 (loaded 2nd time): Name: Short, StartBar: 20, BarCount: 200, Color: Green indicator 3
FREE
Buyers of this product also purchase
Atomic Analyst MT5
Issam Kassas
4.22 (9)
First of all Its worth emphasizing here that this Trading Indicator is   Non-Repainting ,   Non-Redrawing   and   Non-Lagging   Indicator, Which makes it ideal from both manual and robot trading.  The Atomic Analyst  is a PA Price Action Indicator that uses Strength and Momentum of the price to find a better edge in the market. Equipped with an AI filter which help remove noises and false signals, and Increase Trading Potential. Using Multiple layers of complex Indicators, the Atomic Analyst
First of all Its worth emphasizing here that this Trading System is Non-Repainting , Non-Redrawing and Non-Lagging Indicator , Which makes it ideal from both manual and robot trading .  The Smart Trend Trading System MT5 is a comprehensive trading solution tailored for new and experienced traders . It combines over 10 premium indicators and features more than 7 robust trading strategies , making it a versatile choice for diverse market conditions . Trend Following Strategy : Provides precise ent
Quantum Trend Sniper
Bogdan Ion Puscasu
5 (36)
Introducing   Quantum Trend Sniper Indicator , the groundbreaking MQL5 Indicator that's transforming the way you identify and trade trend reversals! Developed by a team of experienced traders with trading experience of over 13 years,   Quantum Trend Sniper Indicator   is designed to propel your trading journey to new heights with its innovative way of identifying trend reversals with extremely high accuracy. ***Buy Quantum Trend Sniper Indicator and you could get Quantum Breakout Indicator fo
Trend Screener Pro MT5
STE S.S.COMPANY
4.88 (60)
Unlock the Power of  Trends trading with Trend Screener Indicator: Your Ultimate Trend Trading Solution powered by fuzzy logic and Multi-currencies System ! Elevate your trend trading with Trend Screener, the revolutionary trend indicator powered by   fuzzy logic.  It is a powerful trend-following indicator that combines over  13 premium tools and features and 3 trading strategies  , making it a versatile choice to   make your Metatrader a Trend Analyzer. LIMITED TIME OFFER : Trend Screener Indi
Gold Stuff mt5
Vasiliy Strukov
4.88 (162)
Gold Stuff mt5 is a trend indicator designed specifically for gold and can also be used on any financial instrument. The indicator does not redraw and does not lag. Recommended time frame H1. Contact me immediately after the purchase to get   personal bonus! Settings  and manual   here   SETTINGS Draw Arrow - on off. drawing arrows on the chart. Alerts -   on off audible alerts. E-mail notification - on off. email notifications. Puch-notification - on off. Push notifications. Next, adjust the co
Advanced Supply Demand MT5
Bernhard Schweigert
4.53 (15)
Best Solution for any Newbie or Expert Trader! This indicator is a unique, high quality and affordable trading tool because we have incorporated a number of proprietary features and a new formula. With this update, you will be able to show double timeframe zones. You will not only be able to show a higher TF but to show both, the chart TF, PLUS the higher TF: SHOWING NESTED ZONES. All Supply Demand traders will love it. :) Important Information Revealed Maximize the potential of Advanced Suppl
First of all Its worth emphasizing here that this Trading Tool is Non Repainting , Non Redrawing and Non Lagging Indicator , Which makes it ideal for professional trading . The Smart Price Action Concepts Indicator is a very powerful tool for both new and experienced traders . It packs more than 20 useful indicators into one , combining advanced trading ideas like Inner Circle Trader Analysis and Smart Money Concepts Trading Strategies . This indicator focuses on Smart Money Concepts , prov
RelicusRoad Pro MT5
Relicus LLC
4.81 (21)
How many times have you bought a trading indicator with great back-tests, live account performance proof with fantastic numbers and stats all over the place but after using it, you end up blowing your account? You shouldn't trust a signal by itself, you need to know why it appeared in the first place, and that's what RelicusRoad Pro does best! NOW $147 (increasing to $499 after a few updates) - UNLIMITED ACCOUNTS (PCs or MACs) **  User Manual + Strategies + Training Videos + Private Group with
FX Power MT5 NG
Daniel Stein
5 (4)
Trading GOLD, and currencies, with the dog walk strategy  - super smart Trading GOLD, and currencies, with the breakout strategy  - super easy Visit our all-new   Stein Investments Welcome Page   to get the latest information, updates and trading strategies. FX Power MT5 NG  is the next generation of our long-time very popular currency strength meter, FX Power.  And what does this next-generation strength meter offer? Everything you have loved about the original FX Power  PLUS GOLD/XAU st
FX Volume MT5
Daniel Stein
4.94 (17)
Visit our all-new   Stein Investments Welcome Page   to get the latest information, updates and trading strategies. FX Volume is the FIRST and ONLY volume indicator that provides a REAL insight into the market sentiment from a broker's point of view. It provides awesome insights into how institutional market participants, like brokers, are positioned in the Forex market, much faster than COT reports. Seeing this information directly on your chart is the real game-changer and breakthrough solut
AW Trend Predictor MT5
AW Trading Software Limited
4.76 (54)
The combination of trend and breakdown levels in one system. An advanced indicator algorithm filters market noise, determines the trend, entry points, as well as possible exit levels. Indicator signals are recorded in a statistical module, which allows you to select the most suitable tools, showing the effectiveness of the signal history. The indicator calculates Take Profit and Stop Loss marks. Manual and instruction ->  HERE  / MT4 version ->  HERE How to trade with the indicator:  Trading wit
Top indicator for MT5   providing accurate signals to enter a trade without repainting! It can be applied to any financial assets:   forex, cryptocurrencies, metals, stocks, indices .  Watch  the video  (6:22) with an example of processing only one signal that paid off the indicator! MT4 version is here It will provide pretty accurate trading signals and tell you when it's best to open a trade and close it. Most traders improve their trading results during the first trading week with the help of
TPSproTREND PrO MT5
Roman Podpora
5 (5)
TPSpro TRENDPRO  - is a trend indicator that automatically analyzes the market and provides information about the trend and each of its changes, as well as giving signals for entering trades without redrawing! The indicator uses each candle, analyzing them separately. referring to different impulses - up or down impulse. Exact entry points into transactions for currencies, crypto, metals, stocks, indices!  -  Version MT4                  DETAILED DESCRIPTION        /       TRADING SETUPS       
Introducing   Quantum Breakout PRO , the groundbreaking MQL5 Indicator that's transforming the way you trade Breakout Zones! Developed by a team of experienced traders with trading experience of over 13 years,   Quantum Breakout PRO   is designed to propel your trading journey to new heights with its innovative and dynamic breakout zone strategy. Quantum Breakout Indicator will give you signal arrows on breakout zones with 5 profit target zones and stop loss suggestion based on the breako
TrendDecoder Premium MT5
Christophe, Pa Trouillas
5 (1)
Identify ranges  | Get earliest signals of Trends  | Get clear exits before reversal  | Spot the Fibo levels the price will test   |  Non-repainting, non-delayed indicator - ideal for manual and automated trading - for all assets and all time units $69   for launch - then back to >>   $149 After purchase,   please contact me on this channel   for recommended and personalised settings MT4   version:  Click here Get our full method with  BladeSCALPER  and   PowerZONES What is it about? TrendDE
Bill Williams Advanced
Siarhei Vashchylka
5 (3)
Bill Williams Advanced is designed for automatic chart analysis using Bill Williams' "Profitunity" system. The indicator analyzes four timeframes at once. Manual (Be sure to read before purchasing) Advantages 1. Automatically analyzes the chart using the "Profitunity" system of Bill Williams. The found signals are placed in a table in the corner of the screen. 2. Equipped with a trend filter based on the Alligator indicator. Most of the system signals are recommended to be used only accordi
XQ Indicator MetaTrader 5
Marzena Maria Szmit
5 (1)
Step into the realm of Forex trading with confidence and precision using XQ, a cutting-edge Forex indicator designed to elevate your trading game to unprecedented heights. Whether you're a seasoned trader or just stepping into the world of currency exchange, XQ Forex Indicator empowers you with the insights and signals needed to make informed trading decisions. The signal conditions are a combination of three indicators, and XQ Forex Indicator only display  medium and long-term trends . The ind
Profit from market structure changes as price reverses and pulls back. The market structure reversal alert indicator identifies when a trend or price move is approaching exhaustion and ready to reverse. It alerts you to changes in market structure which typically occur when a reversal or major pullback are about to happen. The indicator identifies breakouts and price momentum initially, every time a new high or low is formed near a possible exhaustion point. The indicator draws in a rectangle on
Auto Order Block with break of structure based on ICT and Smart Money Concepts Futures Break of Structure ( BoS )             Order block ( OB )            Higher time frame Order block / Point of Interest ( POI )    shown on current chart           Fair value Gap ( FVG ) / Imbalance   ,  MTF      ( Multi Time Frame )    Volume Imbalance     ,  MTF          vIMB Gap’s Equal High / Low’s     ,  MTF             EQH / EQL Liquidity               Current Day High / Low           HOD /
IX Power MT5
Daniel Stein
5 (1)
IX Power   finally brings the unbeatable precision of FX Power to non-Forex symbols. It accurately determines the intensity of short, medium and long-term trends in your favourite indices, stocks, commodities, ETFs, and even cryptocurrencies. You can   analyse everything   your terminal has to offer. Try it out and experience how   your timing improves significantly   when trading. Read about our latest strategic development -  Easy scalping with IX Power Visit our all-new   Stein Investments
Volume by Price MT5
Brian Collard
5 (3)
The Volume by Price Indicator for MetaTrader 5 features Volume Profile and Market Profile TPO (Time Price Opportunity). Get valuable insights out of currencies, equities and commodities data. Gain an edge trading financial markets. Volume and TPO histogram bar and line charts. Volume Footprint charts. TPO letter and block marker charts including split structures. Versatile segmentation and compositing methods. Static, dynamic and flexible ranges with relative and/or absolute visualizations. Lay
TrendLine PRO MT5
Evgenii Aksenov
4.78 (49)
The Trend Line PRO indicator is an independent trading strategy. It shows the trend change, the entry point to the transaction, as well as automatically calculates three levels of Take Profit and Stop Loss protection Trend Line PRO is perfect for all Meta Trader symbols: currencies, metals, cryptocurrencies, stocks and indices Advantages of Trend Line PRO Never redraws its signals The possibility of using it as an independent strategy It has three automatic levels Take Profit and Stop Loss lev
ICT, SMC, SMART MONEY CONCEPTS, SMART MONEY, Smart Money Concept, Support and Resistance, Trend Analysis, Price Action, Market Structure, Order Blocks, BOS/CHoCH,   Breaker Blocks ,  Momentum Shift,   Supply&Demand Zone/Order Blocks , Strong Imbalance,   HH/LL/HL/LH,    Fair Value Gap, FVG, Inversion FVG, IFVG,  Premium  &   Discount   Zones, Fibonacci Retracement, OTE, Buy Side Liquidity, Sell Side Liquidity, BSL/SSL Taken, Equal Highs & Lows, MTF Dashboard, Multiple Time Frame, BigBar, HTF OB
Quantum Heiken Ashi PRO MT5
Bogdan Ion Puscasu
4.5 (8)
Introducing the Quantum Heiken Ashi PRO charts with integrated alerts Designed to provide clear insights into market trends, the Heiken Ashi candles are renowned for their ability to filter out noise and eliminate false signals. Say goodbye to confusing price fluctuations and hello to a smoother, more reliable chart representation. What makes the Quantum Heiken Ashi PRO truly unique is its innovative formula, which transforms traditional candlestick data into easy-to-read colored bars. Red and g
Gartley Hunter Multi
Siarhei Vashchylka
5 (5)
Gartley Hunter Multi - An indicator for searching for harmonic patterns simultaneously on dozens of trading instruments and on all classic timeframes: (m1, m5, m15, m30, H1, H4, D1, Wk, Mn). Manual (Be sure to read before purchasing) | Version for MT4 Advantages 1. Patterns: Gartley, Butterfly, Shark, Crab. Bat, Alternate Bat, Deep Crab, Cypher 2. Simultaneous search for patterns on dozens of trading instruments and on all classic timeframes 3. Search for patterns of all possible sizes. Fr
Was: $249  Now: $99   Market Profile defines a number of day types that can help the trader to determine market behaviour. A key feature is the Value Area, representing the range of price action where 70% of trading took place. Understanding the Value Area can give traders valuable insight into market direction and establish the higher odds trade. It is an excellent addition to any system you may be using. Inspired by Jim Dalton’s book “Mind Over Markets”, this indicator is designed to suit the
A key element in trading is zones or levels from which decisions to buy or sell a trading instrument are made. Despite attempts by major players to conceal their presence in the market, they inevitably leave traces. Our task was to learn how to identify these traces and interpret them correctly. Reversal First Impulse levels (RFI)   -  Version MT4                  INSTRUCTIONS                 RUS                 ENG                         R ecommended to use with an indicator   -  TREND PRO  
Owl Smart Levels MT5
Sergey Ermolov
4.47 (36)
MT4 version  |   FAQ The Owl Smart Levels Indicator is a complete trading system within the one indicator that includes such popular market analysis tools as Bill Williams' advanced fractals , Valable ZigZag which builds the correct wave structure of the market, and Fibonacci levels which mark the exact levels of entry into the market and places to take profits. Detailed description of the strategy Instructions for working with the indicator Advisor-assistant in trading Owl Helper Private User
Swing Scanner MT5
Reza Aghajanpour
5 (5)
**   All Symbols   x   All Time frames   scan just by pressing scanner button ** ***Contact me after the purchase to send you instructions and add you in "Swing scanner group" for sharing or seeing experiences with other users. Introduction: Swing Scanner   is the indicator designed to detect swings in the direction of the trend and possible reversal swings. The indicator studies several price and time vectors to track the aggregate trend direction and detects situations in which the market is o
Dark Power MT5
Marco Solito
4.84 (56)
Dark Power  is an Indicator for intraday trading. This Indicator is based on   Trend Following  strategy, also adopting the use of an histogram to determine the right power . We can enter in good price with this Indicator, in order to follow the   strong trend   on the current instrument. The histogram is calculated based on the size of the bars and two moving averages calculated on the histogram determine the direction of the signal Key benefits Easily visible take profit/stop loss lines Int
More from author
This is a simple order block locator. Searched for the existence of order blocks only at extremums. If you want multi criteria order block location check my other indicator which is more powerful here  These order blocks are ICT order blocks without any buttering. The indicator can be a useful tool for detecting reversals, continuations. You can also use the indicator as confluence with your other tools
FREE
Day Trader WorkTime
Aurthur Musendame
4.91 (22)
The worktime indicator helps you identify the most important times to day to trade the currency pairs. It was created based on the ICT day trading free tutorials that are freely vailable on his youtube channel.  You can use this indicator together with my other indicators that i have shared freely with you like the true day, custom periods, daily month, weekly open lines - they together complement each other very well. Nuggets from this indicator: 1. Draws the asian session box showinng you th
FREE
The Higher timeframe candle tracker is used to get a glimpse of what the selected higher time frame candle is like. It plot the candle after the current price. It can come in handy for day traders and short term traders that often worry about how the current higher timeframe candle may look like. You can select the higher time frame or lower time frame from the options provided: By default the color for bears is red and for bulls is green. You are able to change the width of the candle, its wick
FREE
The order block locator is powered by three main search algorithms thar can be used to find order blocks. Simple Fractal Search Algorithm Naive Fractal Movers Algorithm Candle Transition Algorithm You can even combine the power of your 2 favourite algorithms and get the best of both worlds: Mixed Algorithm (Naive Fractal + Candle transition) Mixed Algorithm (Simple Fractal + Candle Transition Simple Fractal Search Algorithm The algorithm finds the fractals based on your setting paramers fo
Dail Session Open Lines
Aurthur Musendame
4.4 (10)
Daily session open lines shows the traders three important trading session opens. By default it is set up to show you: Zero GMT Open Line London Open Session Line New York Open Session Line The default times are set according to GMT+2 and as such you are able to change and customise according to your specific time zone. The Indicator is usefull specially for the trader who trades the London and NewYork sessions.
FREE
Super Fractals
Aurthur Musendame
5 (4)
Think of the Super Fractal Indicator as the Bill WIlliams Indicator on Steroids. Indicator Abilities: 1. Adjust Candle around Fractal High or Low. 2. Adjust Lookback period and only plot for a specific number of history candles avoiding cluttering your trading desk. 3. The Indicator uses buffers so you call and use it from any EA. Note : The higher the candles around Fractal, the stronger the Turning point anfd viceversa is true.
FREE
Monthly Weekly Open Lines
Aurthur Musendame
5 (4)
The Monthly Weekly Open Line is an indicator that plots: The current month open line that will extend till the last week on the month. Weekly lines that span the look back days period that you have set . Each line will extend from the respective weekly Monday zero GMT till friday of the respective week. Monthly and Weekly open lines can be used to build very powerfull anc consistent trading strategies. They act as natural S/R price barriers.
FREE
True Day
Aurthur Musendame
5 (1)
True Days is a tool designed specifically for the trader who wants to catch intraday volatility in price charts.  True day makes it easier for the trader to avoid trading in the dead zone - a period in time where markets are considered dead or non volatile. The trader can concentrate on finding opportunities only during periods of profound market movements. By default the indicator gives you a true day starting at 02:00 to 19:00 hours GMT+2. You can adjust according to your Time Zone. By deafult
FREE
HoD LoD Time Price Studies
Aurthur Musendame
4.33 (3)
High of the Day and Low of the day Time and Price Fractal Studies is an indicator that will help you identify certain patterns that tend to repeat themseleves at certail times of the day or at certain prices.  It is used to study Daily Highs ad Lows in relation to time and price.  You will get to answer certail questions like: At what time of day does this market usually turn around. At what price does the market turn. Is it at round numbers etc
FREE
Period Seperators
Aurthur Musendame
5 (1)
The daily custom period seperator indicator allows you to draw period seperators for your lower time frame charts H1 and below.  The period seperator gives you options to set different colors for: Weekend - saturday/sunday Monday and Friday  Midweek - Tuesday to Thursday. By default the indicator plots the period seperator line at 00:00 hours for the last 10 days. Use Cases: The indicator can be used as a colourful alternative period seperator to the default MT5 period seperator. For those t
FREE
Time and Price Fractal Studies is an indicator that will help you identify certain patterns that tend to repeat themseleves at certail times of the day or at certain prices.  It is used to study Fractal Highs ad Lows in relation to time and price.  You will get to answer certail questions like: At what time of day does this market usually turn around. At what price does the market turn. Is it at round numbers etc.
FREE
Template Name
Aurthur Musendame
5 (1)
Template name allows you to write custom text that will show up on your charts. It allows you to position the text anywhere including selecting any color that you prefer. You can position the text at any of the 4 corners of your chart screen. This custom text can aid as a watermark for your screen shots. This text can act as a unique and true signature for your charts.
FREE
Filter:
Birds_eye
239
Birds_eye 2023.06.16 17:57 
 

A very useful indicator. Excellent work as always

Zé Roberto
657
Zé Roberto 2022.11.16 22:04 
 

Obrigado por compartilhar

Mauritz Lourens
708
Mauritz Lourens 2022.06.04 11:05 
 

Good to use with other indicators in a strategy. Seems to be in harmony with order blocks. It is a nice MA. It is an MA, but a very user friendly one. A bit like Fourier extrapolated MA with some very nice custom settings for timeframes. Would like to see author perhaps include Fourier extrapolated moving average into this indicator. Imagine a multi timeframe Fourier. Would be awesome.

Aurthur Musendame
69126
Reply from developer Aurthur Musendame 2022.06.24 22:24
Thank you. Will look into Fourier and read about it and see what i can do.
ThorstenKock
2584
ThorstenKock 2021.09.22 21:45 
 

Nothing new with moving averages. None of those strategies work

Aurthur Musendame
69126
Reply from developer Aurthur Musendame 2021.12.25 12:20
Its not about something new. Its an existing syetm that other people aready trade and believe in. The purpose of the indicator is to do the Multi timaframe calculation and plot a suitable moving average.
Reply to review