• Overview
  • Reviews (3)
  • Comments (1)
  • What's new

ADX Dashboard MT5

5
ADX indicator is used to determine the trend and its strength. The direction of the price is shown by the +DI and -DI values, and the ADX value shows the strength of the trend. If +DI is above -DI, then the market is in an uptrend, if on the contrary, it is a downtrend. If ADX is below 20, then there is no definite direction. As soon as the indicator breaks this level, a medium-strength trend begins. Values above 40 indicate a strong trend (a downtrend or an uptrend).

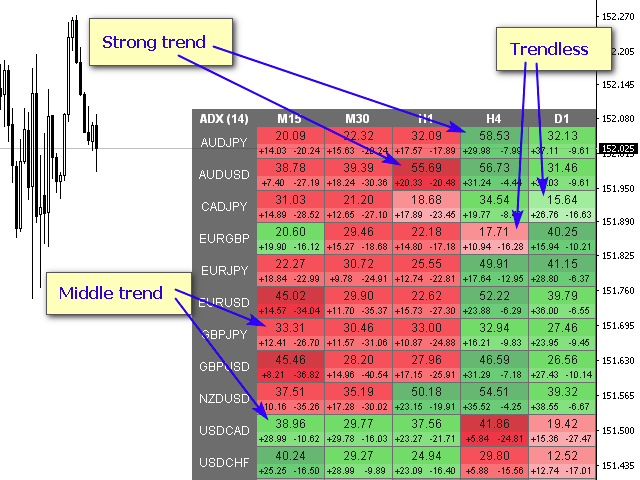
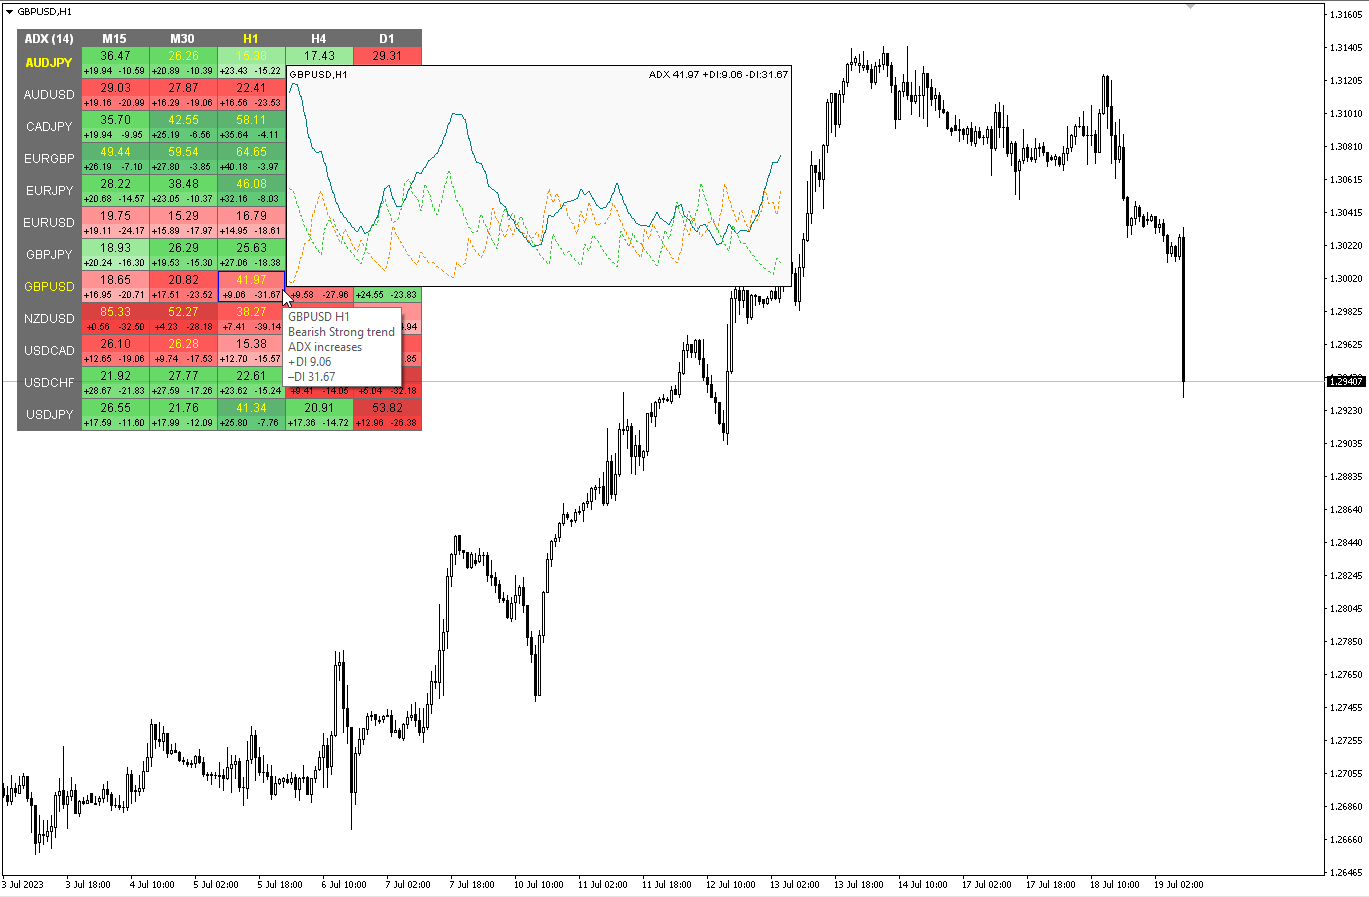
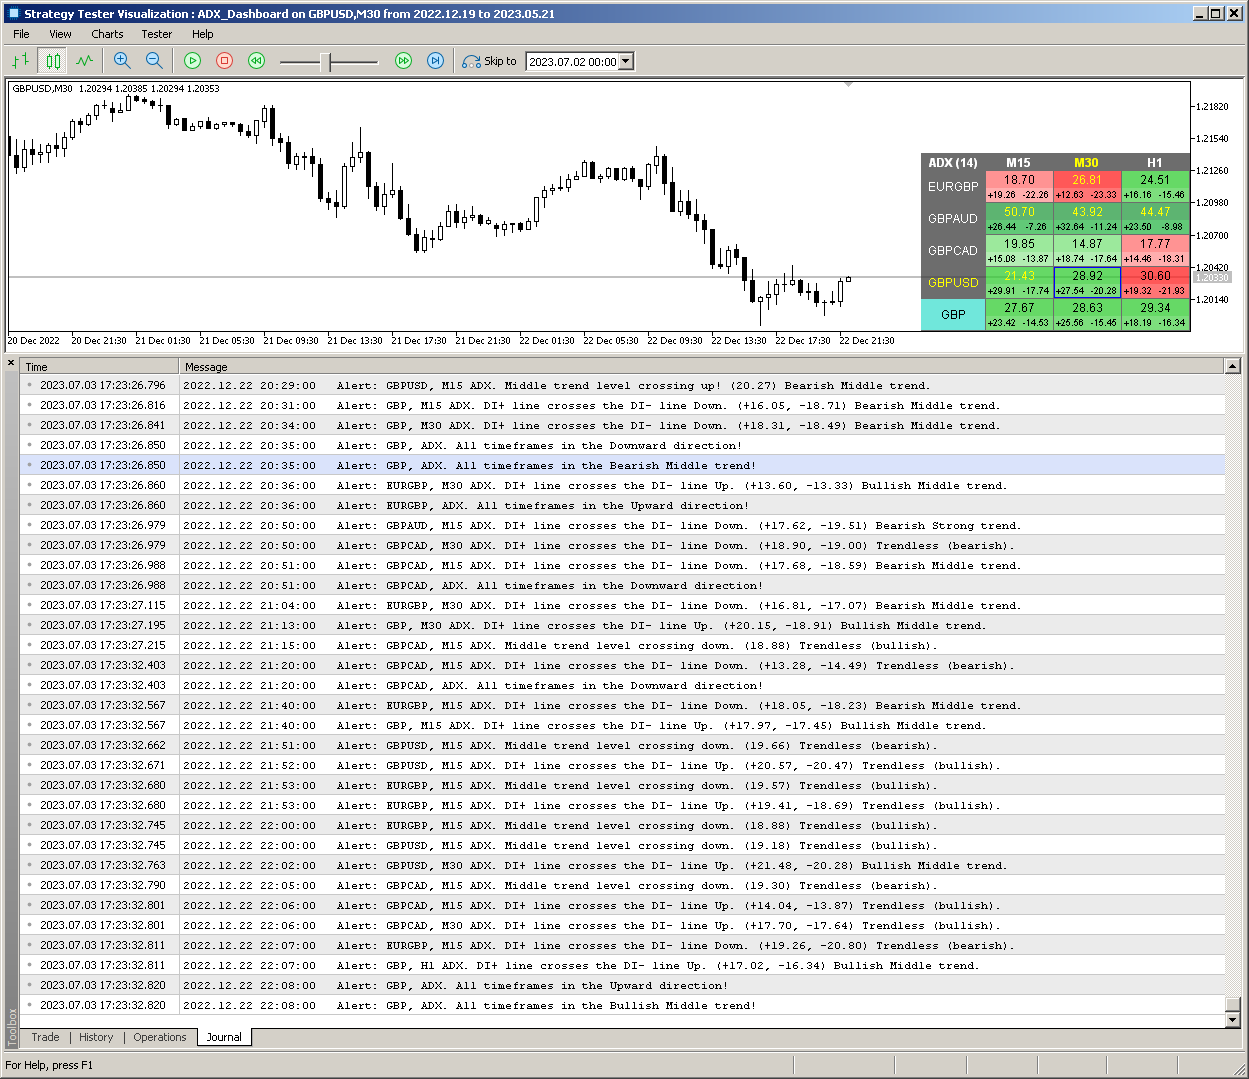
Multicurrency and multitimeframe modification of the Average Directional Movement Index (ADX) indicator. You can specify any desired currencies and timeframes in the parameters. Also, the indicator can send notifications when the trend strength levels are crossed, and when the +DI and -DI lines are crossed. By clicking on a cell with a period, this symbol and period will be opened. This is MTF Scanner.

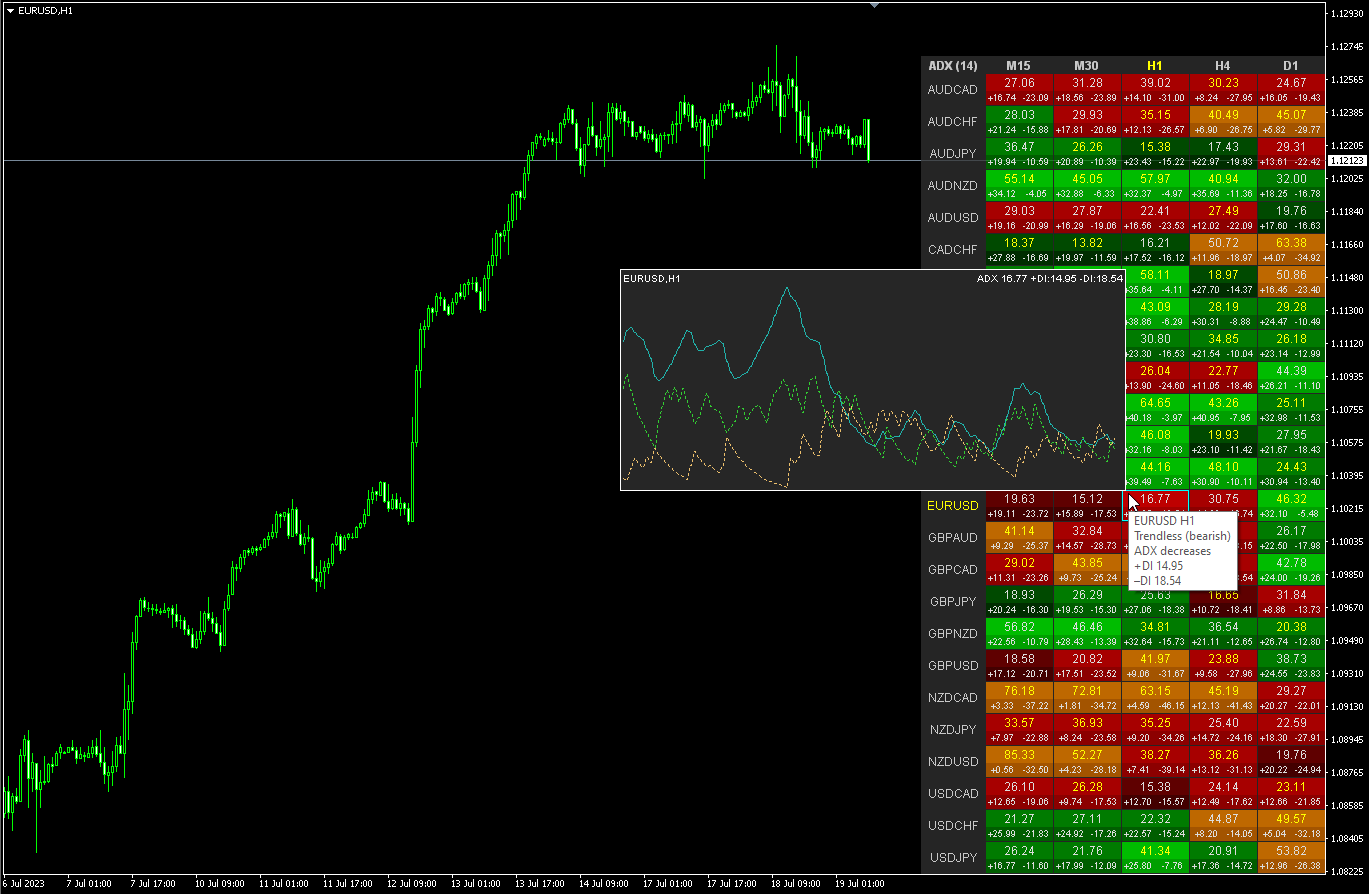
Similar to the Currency Strenghth Meter, the Dashboard can automatically select pairs containing the specified Currency or those pairs that have this Currency as the base. The indicator will also calculate the ADX for this Currency on a separate line.

The key to hide the dashboard from the chart is "D" by default.


Parameters

ADX Period — averaging period.
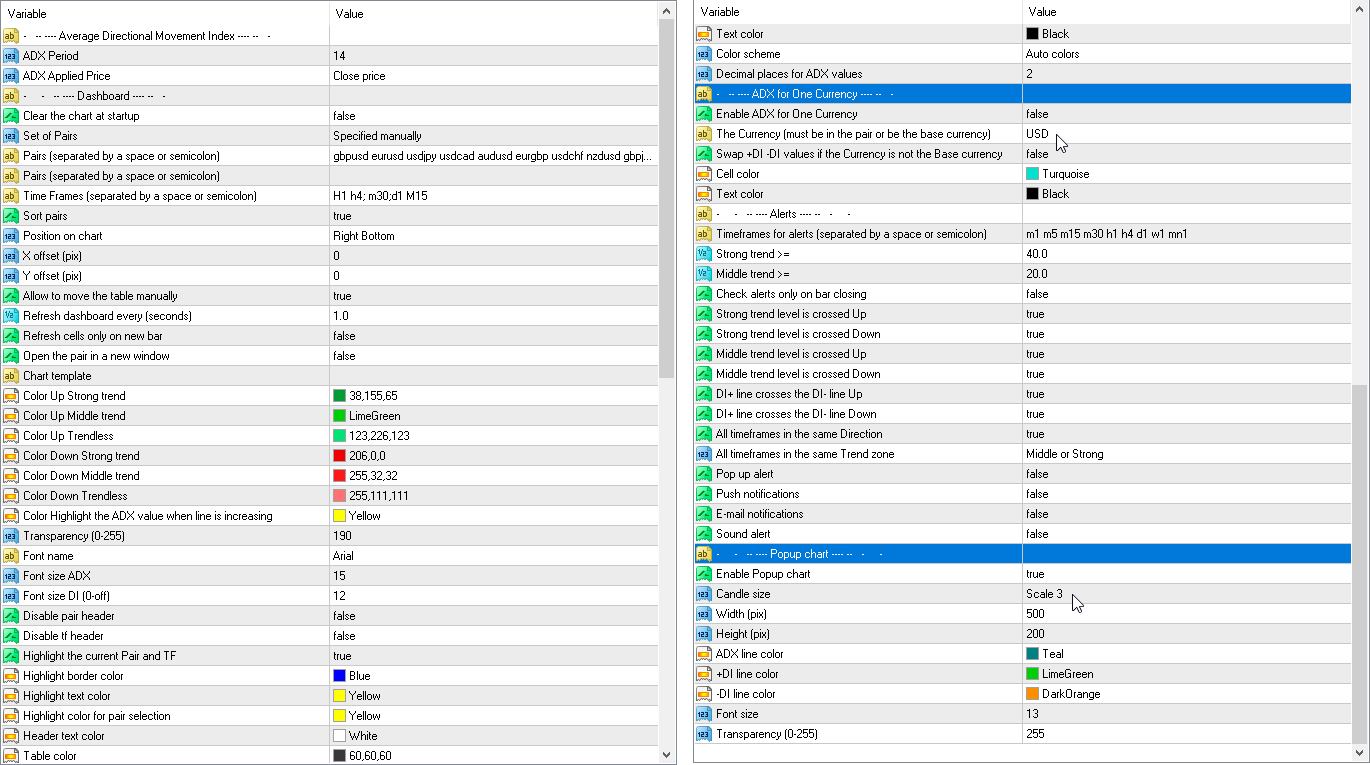
ADX Applied Price — price type.
Clear the chart at startup — clear the chart at startup.
Set of Pairs — set of symbols
    — Market Watch — pairs from the "Market Watch".
    — Specified manually — pairs specified manually, in the parameters "Pairs".
    — Current pair — show only the current pair.
    Pairs (separated by a space or semicolon) — list of symbols separated by spaces or semicolons. The currency names should be written exactly like the broker's, keeping the case and prefix/suffix.
    Time Frames (separated by a space or semicolon) — list of timeframes separated by spaces or semicolons (multi timeframe).
    Sort pairs — sorting the list of pairs.
    Position on chart — corner to display the panel on the chart.
    X offset (pix) — shift the panel along the X axis.
    Y offset (pix) — shift the panel along the Y axis.
    Allow to move the table manually — allow moving the table with the mouse.
    Refresh dashboard every (seconds) — update period for all pairs and timeframes.
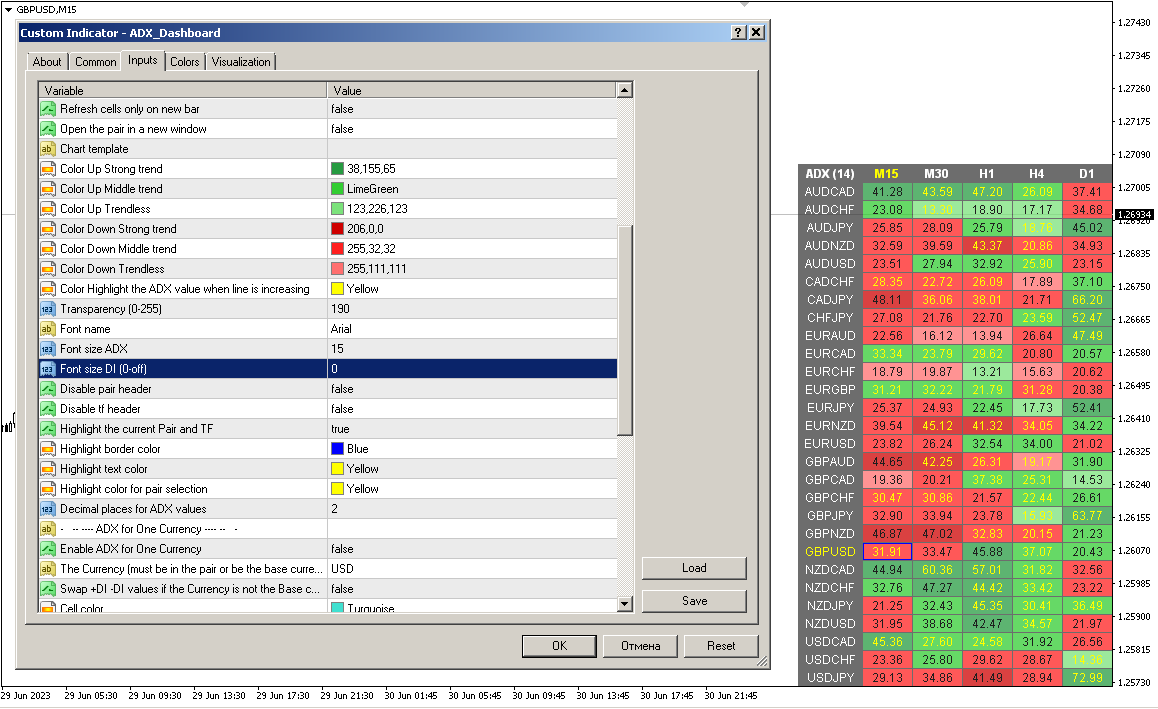
    Refresh cells only on new bar — cell updates (and alerts) will only occur when a new bar appears.
    Open the pair in a new window — open a symbol in a new chart window by clicking.
    Chart template — the name of the template for the chart, if the chart opens in a new window.
      Color settings
      Color Up Strong trend — cell color if there is a strong trend.
      Color Up Middle trend — cell color, if the middle trend.
      Color Up Trendless — cell color if there is no trend.
      Color Down Strong trend — cell color if there is a strong trend.
      Color Down Middle trend — cell color, if the average trend.
      Color Down Trendless — cell color if there is no trend.
      Transparency (0-255) — transparency of the panel.
      Font name.
      Font size ADX.
      Font size DI (0-off).
        Alerts

        Timeframes for alerts (separated by a space or semicolon) — list of periods for which the alert will be sent (separated by a space or semicolon).
        Strong trend >= — the level of a strong trend
        Middle trend >= — the level of the middle trend.
        Check alerts only on bar closing — check level crossing only after bar closing.
        Strong trend level is crossed Up — alert when ADX crosses the level of a strong trend up.
        Strong trend level is crossed Down — alert when ADX crosses the level of a strong trend down.
        Middle trend level is crossed Up — alert when the level of the middle trend is crossed upwards.
        Middle trend level is crossed Down — alert when the level of the middle trend is crossed downwards.
        DI+ line crosses the DI- line Up — alert when DI+ crosses DI- up.
        DI+ line crosses the DI- line Down — alert when DI+ crosses DI- down.
        All timeframes in the same direction — alert when all cells show the same direction.
        DI+ changes direction.
        DI- changes direction.
        DI+ crosses level X (0-off).
        DI- crosses level X (0-off).
        Pop up alert.
        Push notifications.
        E-mail notifications.
        Sound alert.

        Popup chart
        Enable Popup chart
        Candle size
        Width (pix)
        Height (pix)
        Font size
        Transparency (0-255)


        Reviews 3
        Adz trading
        100
        Adz trading 2024.04.06 21:11 
         

        Very fluid and precise indicator to never miss the start of a trend , it is a must to have $$$

        Baatar Bazar
        322
        Baatar Bazar 2024.03.24 19:18 
         

        Great indicator for ADX users. Thank you.

        Jason Perez Oconnor
        143
        Jason Perez Oconnor 2023.11.13 14:30 
         

        Extremely useful and underrated. Great for checking the ADX across different pairs and timeframes on one chart!

        Recommended products
        GIVE A LOOK TO MY OTHER PRODUCTS ! 100 % PER MONTH PROFIT---- MY NEW SIGNAL HERE ------->   https://www.mql5.com/en/signals/2162238?source=Site+Signals+My# BROKEN TRENDLINE ALERT IS A SIMPLE TOOL INDICATOR. JUST DRAW IN YOUR CHART A DYNAMIC OR STATIC TRENDLINE,AND THE INDICATOR WILL SEND YOU ALERT WHENEVER THE PRICE CROSSES BELOW OR ABOVE YOUR DRAWN TRENDLINE. IT WORKS IN ANY TIMEFRAME AND ANY CHART YOU WANT.JUST GOT A VPS AND DON'T STRESS IN FRONT OF YOUR COMPUTER. FOR ANY KIND OF QUESTION
        GapFinder Pro - Unleashing Market Opportunities Discover and capitalize on market gaps with precision using GapFinder Pro, the ultimate MetaTrader 5 indicator designed for novice and astute traders. Unveil hidden opportunities in the market and elevate your trading strategy with this powerful tool. Key Features: Any Currency! Any Time-Frame! Gap Detection and Visualization: Identify market gaps effortlessly with a visual representation on your MetaTrader 5 chart. Instantly recognize gaps, painte
        This indicator shows a candle combination based on dodge, dodge and pin bar. The logic of the pattern is to stand on the side of strength, after uncertainty. The indicator is universal and is useful for trading binary options, forex, ETFs, cryptocurrency, stocks. The indicator supports timeframes from M5 to MN, including non-standard TF presented in MT5. (М5,М6,М10,M12, M15, M20, M30, H1, H2, H3, H4, H6, H8, H12, D1, W1, MN). The ability to enable and disable TF is implemented. Sound alerts and
        This indicator allows you to enjoy the two most popular products for analyzing request volumes and market deals at a favorable price: Actual Depth of Market Chart Actual Tick Footprint Volume Chart This product combines the power of both indicators and is provided as a single file. The functionality of Actual COMBO Depth of Market AND Tick Volume Chart is fully identical to the original indicators. You will enjoy the power of these two products combined into the single super-indicator! Below is
        Mine Farm
        Maryna Kauzova
        5 (1)
        Mine Farm is one of the most classic and time-tested scalping strategies based on the breakdown of strong price levels. Mine Farm is the author's modification of the system for determining entry and exit points into the market... Mine Farm - is the combination of great potential with reliability and safety. Why Mine Farm?! - each order has a short dynamic Stop Loss - the advisor does not use any risky methods (averaging, martingale, grid, locking, etc.) - the advisor tries to get
        Owl Smart Levels MT5
        Sergey Ermolov
        4.47 (36)
        MT4 version  |   FAQ The Owl Smart Levels Indicator is a complete trading system within the one indicator that includes such popular market analysis tools as Bill Williams' advanced fractals , Valable ZigZag which builds the correct wave structure of the market, and Fibonacci levels which mark the exact levels of entry into the market and places to take profits. Detailed description of the strategy Instructions for working with the indicator Advisor-assistant in trading Owl Helper Private User
        Big Player Range
        Thalles Nascimento De Carvalho
        5 (2)
        Welcome to the "BigPlayerRange" indicator, a technical analysis tool developed to identify significant areas of interest by financial institutions in the markets. This indicator provides precise analysis of price ranges where major market players demonstrate considerable activity and interest. Key Features: Institutional Interest Area Mapping: The "BigPlayerRange" accurately highlights chart areas where financial institutions show strong activity. These points are strategically important, provi
        Trend Master Chart MT5
        Frederic Jacques Collomb
        5 (1)
        Trend Master Chart is the trend indicator you need. It overlays the chart and uses color coding to define different market trends/moves. It uses an algorithm that combines two moving averages and different oscillators. The periods of these three elements are modifiable. It works on any time-frame and any Pair. At a glance you will be able to identify an upward or downward trend and the different entry points into this trend. For example during a marked upward trend (light green color) the dif
        FREE
        PipFinite Trend PRO MT5
        Karlo Wilson Vendiola
        4.87 (664)
        Breakthrough Solution For Trend Trading And Filtering With All Important Features Built Inside One Tool! Trend PRO's smart algorithm detects the trend, filters out market noise and gives entry signals with exit levels. The new features with enhanced rules for statistical calculation improved the overall performance of this indicator. Important Information Revealed Maximize the potential of Trend Pro, please visit www.mql5.com/en/blogs/post/713938 The Powerful Expert Advisor Version Automa
        Your Trend Friend
        Luigi Nunes Labigalini
        The trend is your friend! Look at the color of the indicator and trade on that direction. It does not  repaint. After each candle is closed, that's the color of the trend. You can focus on shorter faster trends or major trends, just test what's most suitable for the symbol and timeframe you trade. Simply change the "Length" parameter and the indicator will automatically adapt. You can also change the color, thickness and style of the lines. Download and give it a try! There are big movements
        Volality Index Scalper
        Lesedi Oliver Seilane
        Volality Index scalper indicator  Meant for Volality pairs such as Volality 10, 25, 50, 75 and 100 The indicator works on all timeframes from the 1 minute to the monthly timeframe the indicator is non repaint the indicator has 3 entry settings 1 color change on zero cross 2 color change on slope change 3 color change on signal line cross Orange line is your sell signal Blue line is your buy signal.
        Rainbow EA MT5
        Jamal El Alama
        Description : Rainbow EA MT5 is a simple Expert advisor based on   Rainbow MT5 indicator witch is based on Moving average with period 34. The indicator is incorporated in the EA, therefore, it is not required for the EA to operate, but if you wish, you can download it from   my product page . The Expert Advisor settings are as follows : Suitable for Timeframes up to H1 The parameters below can be set according to your trading rules. StopLoss ( Stop Loss in pips) TakeProfit ( Take Profit in pi
        US30NinjaMT5
        Satyaseelan Shankarananda Moodley
        US30 Ninja is a 5 minute scalping indicator that will let know you when there is a trade set up (buy or sell). Once the indicator gives the trade direction, you can open a trade and use a 30 pip stop loss and a 30 pip to 50 pip take profit. Please trade at own own risk. This indicator has been created solely for the US30 market and may not yield positive results on any other pair. 
        PZ Trend Trading MT5
        PZ TRADING SLU
        3.67 (3)
        Trend Trading is an indicator designed to profit as much as possible from trends taking place in the market, by timing pullbacks and breakouts. It finds trading opportunities by analyzing what the price is doing during established trends. [ Installation Guide | Update Guide | Troubleshooting | FAQ | All Products ] Trade financial markets with confidence and efficiency Profit from established trends without getting whipsawed Recognize profitable pullbacks, breakouts and early reversals The ind
        Fit line supports to extrapolation next movement of market, support for buy/sell decision. Indicator using spline algorithm to extrapolation.  You can change number of spline with parameter "PointsNumber" and number of extrapolation point with "ExtrapolateBars". Eextrapolation points will be save into csv format, with prefix in parameter "PointsPrefix", and store in folder File of Data Folder.
        This indicator is based on a classic Moving Average indicator. Moving averages help us to first define the trend and second, to recognize changes in the trend. Multi TimeFrame indicator MTF-MA shows MA data from the 4 timeframes by your choice. By default this indicator has external parameters: TF1 = 1; TimeFrame2b = true; TF2 = 5; TimeFrame3b = true; TF3 = 15; TimeFrame4b = true; TF4 = 60; InpPSARStep = 0.02; InpPSARMaximum = 0.2; You can change TF1-TF4 in the next limits: TF1 from M1 (1) to H4
        Swing Tracer
        Ely Alsedy
        5 (2)
        it depends on ATR period to get swing points to help make better trading decisions  blue dot and red dot is the default color scheme of course you can change it later if you'd like  you can change the following : ATR PERIOD  sending notifications number of times to send notifications  sending notifications to your smart phone that's it very simple to use just drag and drop and follow the trend 
        Premium level is a unique indicator with more than 80% accuracy of correct predictions! This indicator has been tested for more than two months by the best Trading Specialists! The author's indicator you will not find anywhere else! From the screenshots you can see for yourself the accuracy of this tool! 1 is great for trading binary options with an expiration time of 1 candle. 2 works on all currency pairs, stocks, commodities, cryptocurrencies Instructions: As soon as the red ar
        This innovative indicator for measuring the strength of currencies from INFINITY is an indispensable assistant for scalpers and traders trading for a long time. The system for analyzing the Strength / weakness of currencies has long been known and used in the market by the world's leading traders. Any arbitrage trading is not complete without this analysis. Our indicator easily determines the strength of the base currencies in relation to each other. It displays line charts for all or the curre
        Trade history
        Andriy Konovalov
        5 (3)
        The indicator plots charts of profit taken at the Close of candles for closed (or partially closed) long and short positions individually. The indicator allows to filter deals by the current symbol, specified expert ID (magic number) and the presence (absence) of a substring in a deal comment, to set the start time and the periodicity of profit reset (daily, weekly or monthly) to calculate the profit chart. The indicator also displays the floating (not fixed) profit of the opened positions at th
        MetaCOT 2 is a set of indicators and specialized utilities for the analysis of the U.S. Commodity Futures Trading Commission reports. Thanks to the reports issued by the Commission, it is possible to analyze the size and direction of the positions of the major market participants, which brings the long-term price prediction accuracy to a new higher-quality level, inaccessible to most traders. These indicators, related to the fundamental analysis, can also be used as an effective long-term filter
        [ MT4 Version ] Order Block Indicator MT5 Order Block Indicator MT5 is currently the most accurate and customizable indicator in the market. It has been developed to facilitate the analysis of operations based on Order Blocks and Supply and Demand Zones. These zones are possible reversal points of a movement. Order Blocks indicate a possible accumulation of orders in one area. The price usually gets to reach and react strongly to those areas. The most relevant levels for this reaction are the c
        The indicator builds current quotes, which can be compared with historical ones and on this basis make a price movement forecast. The indicator has a text field for quick navigation to the desired date. Options: Symbol - selection of the symbol that the indicator will display; SymbolPeriod - selection of the period from which the indicator will take data; IndicatorColor - indicator color; Inverse - true reverses quotes, false - original view; Next are the settings of the te
        Was: $249  Now: $99   Market Profile defines a number of day types that can help the trader to determine market behaviour. A key feature is the Value Area, representing the range of price action where 70% of trading took place. Understanding the Value Area can give traders valuable insight into market direction and establish the higher odds trade. It is an excellent addition to any system you may be using. Inspired by Jim Dalton’s book “Mind Over Markets”, this indicator is designed to suit the
        HMA Trend Professional MT5
        Pavel Zamoshnikov
        4.4 (5)
        Improved version of the free HMA Trend indicator (for MetaTrader 4) with statistical analysis. HMA Trend is a trend indicator based on the Hull Moving Average (HMA) with two periods. HMA with a slow period identifies the trend, while HMA with a fast period determines the short-term movements and signals in the trend direction. The main differences from the free version: Ability to predict the probability of a trend reversal using analysis of history data. Plotting statistical charts for analyz
        The Bull and Bear Power indicators identify whether the buyers or sellers in the market have the power, and as such lead to price breakout in the respective directions. Bulls Power   vs.   Bears Power   is a unique tool that displays on each candle the balance between the   bears   (sellers) and the   bulls   (buyers).   This particular indicator will be especially very effective when the narrow histogram and the wide histogram reside on the same side (above or under the Zero line)
        Indicator and Expert Adviser  EA Available in the comments section of this product. Download with Indicator must have indicator installed for EA to work. Mt5 indicator alerts for bollinger band and envelope extremes occurring at the same time. Buy signal alerts occur when A bullish candle has formed below both the lower bollinger band and the lower envelope  Bar must open and close below both these indicators. Sell signal occur when A bear bar is formed above the upper bollinger band and upp
        Paladin
        Tatiana Savkevych
        Paladin is a fundamental technical indicator specially designed for Forex traders. It is based on a unique algorithm that forecasts future prices by analyzing historical quote data over a specific user-defined time period set in the indicator's settings. This indicator provides traders with valuable information about potential changes in price direction. Using a special formula at its core, Paladin accurately calculates signals. It effectively identifies reversal points or sharp price movemen
        Golden Spikes Detector
        Batsirayi L Marango
        5 (1)
        Golden Spikes Detector This indicator is based on an advanced strategy primarily for trading spikes on Boom and Crash Indices. Complex algorithms were implemented to detect high probability entries only. It alerts on potential Buy and Sell entries. To trade spikes on the Deriv or Binary broker, only take Buy Boom and Sell Cash alerts. It was optimised to be loaded on 5-minute timeframe although multiple timeframe analysis is done in the background. Features ·             Desktop pop up and sound
        Indicator for determining flat and trend. If the price is below any of the two histograms and two lines (red and blue), this is a sell zone. When purchasing this version of the indicator, MT4 version for one real and one demo account - as a gift (to receive, write me a private message)! If the price is above any of the two histograms and two lines (red and blue), this is a buy zone. MT4 version:  https://www.mql5.com/ru/market/product/3793 If the price is between two lines or in the zone
        Buyers of this product also purchase
        Atomic Analyst MT5
        Issam Kassas
        4.22 (9)
        First of all Its worth emphasizing here that this Trading Indicator is   Non-Repainting ,   Non-Redrawing   and   Non-Lagging   Indicator, Which makes it ideal from both manual and robot trading.  The Atomic Analyst  is a PA Price Action Indicator that uses Strength and Momentum of the price to find a better edge in the market. Equipped with an AI filter which help remove noises and false signals, and Increase Trading Potential. Using Multiple layers of complex Indicators, the Atomic Analyst
        First of all Its worth emphasizing here that this Trading System is Non-Repainting , Non-Redrawing and Non-Lagging Indicator , Which makes it ideal from both manual and robot trading .  The Smart Trend Trading System MT5 is a comprehensive trading solution tailored for new and experienced traders . It combines over 10 premium indicators and features more than 7 robust trading strategies , making it a versatile choice for diverse market conditions . Trend Following Strategy : Provides precise ent
        Quantum Trend Sniper
        Bogdan Ion Puscasu
        5 (36)
        Introducing   Quantum Trend Sniper Indicator , the groundbreaking MQL5 Indicator that's transforming the way you identify and trade trend reversals! Developed by a team of experienced traders with trading experience of over 13 years,   Quantum Trend Sniper Indicator   is designed to propel your trading journey to new heights with its innovative way of identifying trend reversals with extremely high accuracy. ***Buy Quantum Trend Sniper Indicator and you could get Quantum Breakout Indicator fo
        Trend Screener Pro MT5
        STE S.S.COMPANY
        4.88 (60)
        Unlock the Power of  Trends trading with Trend Screener Indicator: Your Ultimate Trend Trading Solution powered by fuzzy logic and Multi-currencies System ! Elevate your trend trading with Trend Screener, the revolutionary trend indicator powered by   fuzzy logic.  It is a powerful trend-following indicator that combines over  13 premium tools and features and 3 trading strategies  , making it a versatile choice to   make your Metatrader a Trend Analyzer. LIMITED TIME OFFER : Trend Screener Indi
        Advanced Supply Demand MT5
        Bernhard Schweigert
        4.53 (15)
        Best Solution for any Newbie or Expert Trader! This indicator is a unique, high quality and affordable trading tool because we have incorporated a number of proprietary features and a new formula. With this update, you will be able to show double timeframe zones. You will not only be able to show a higher TF but to show both, the chart TF, PLUS the higher TF: SHOWING NESTED ZONES. All Supply Demand traders will love it. :) Important Information Revealed Maximize the potential of Advanced Suppl
        First of all Its worth emphasizing here that this Trading Tool is Non Repainting , Non Redrawing and Non Lagging Indicator , Which makes it ideal for professional trading . The Smart Price Action Concepts Indicator is a very powerful tool for both new and experienced traders . It packs more than 20 useful indicators into one , combining advanced trading ideas like Inner Circle Trader Analysis and Smart Money Concepts Trading Strategies . This indicator focuses on Smart Money Concepts , prov
        RelicusRoad Pro MT5
        Relicus LLC
        4.81 (21)
        How many times have you bought a trading indicator with great back-tests, live account performance proof with fantastic numbers and stats all over the place but after using it, you end up blowing your account? You shouldn't trust a signal by itself, you need to know why it appeared in the first place, and that's what RelicusRoad Pro does best! NOW $147 (increasing to $499 after a few updates) - UNLIMITED ACCOUNTS (PCs or MACs) **  User Manual + Strategies + Training Videos + Private Group with
        FX Power MT5 NG
        Daniel Stein
        5 (4)
        Trading GOLD, and currencies, with the dog walk strategy  - super smart Trading GOLD, and currencies, with the breakout strategy  - super easy Visit our all-new   Stein Investments Welcome Page   to get the latest information, updates and trading strategies. FX Power MT5 NG  is the next generation of our long-time very popular currency strength meter, FX Power.  And what does this next-generation strength meter offer? Everything you have loved about the original FX Power  PLUS GOLD/XAU st
        FX Volume MT5
        Daniel Stein
        4.94 (17)
        Visit our all-new   Stein Investments Welcome Page   to get the latest information, updates and trading strategies. FX Volume is the FIRST and ONLY volume indicator that provides a REAL insight into the market sentiment from a broker's point of view. It provides awesome insights into how institutional market participants, like brokers, are positioned in the Forex market, much faster than COT reports. Seeing this information directly on your chart is the real game-changer and breakthrough solut
        AW Trend Predictor MT5
        AW Trading Software Limited
        4.76 (54)
        The combination of trend and breakdown levels in one system. An advanced indicator algorithm filters market noise, determines the trend, entry points, as well as possible exit levels. Indicator signals are recorded in a statistical module, which allows you to select the most suitable tools, showing the effectiveness of the signal history. The indicator calculates Take Profit and Stop Loss marks. Manual and instruction ->  HERE  / MT4 version ->  HERE How to trade with the indicator:  Trading wit
        Top indicator for MT5   providing accurate signals to enter a trade without repainting! It can be applied to any financial assets:   forex, cryptocurrencies, metals, stocks, indices .  Watch  the video  (6:22) with an example of processing only one signal that paid off the indicator! MT4 version is here It will provide pretty accurate trading signals and tell you when it's best to open a trade and close it. Most traders improve their trading results during the first trading week with the help of
        TPSproTREND PrO MT5
        Roman Podpora
        5 (5)
        TPSpro TRENDPRO  - is a trend indicator that automatically analyzes the market and provides information about the trend and each of its changes, as well as giving signals for entering trades without redrawing! The indicator uses each candle, analyzing them separately. referring to different impulses - up or down impulse. Exact entry points into transactions for currencies, crypto, metals, stocks, indices!  -  Version MT4                  DETAILED DESCRIPTION        /       TRADING SETUPS       
        Introducing   Quantum Breakout PRO , the groundbreaking MQL5 Indicator that's transforming the way you trade Breakout Zones! Developed by a team of experienced traders with trading experience of over 13 years,   Quantum Breakout PRO   is designed to propel your trading journey to new heights with its innovative and dynamic breakout zone strategy. Quantum Breakout Indicator will give you signal arrows on breakout zones with 5 profit target zones and stop loss suggestion based on the breako
        TrendDecoder Premium MT5
        Christophe, Pa Trouillas
        5 (1)
        Identify ranges  | Get earliest signals of Trends  | Get clear exits before reversal  | Spot the Fibo levels the price will test   |  Non-repainting, non-delayed indicator - ideal for manual and automated trading - for all assets and all time units $69   for launch - then back to >>   $149 After purchase,   please contact me on this channel   for recommended and personalised settings MT4   version:  Click here Get our full method with  BladeSCALPER  and   PowerZONES What is it about? TrendDE
        Bill Williams Advanced
        Siarhei Vashchylka
        5 (3)
        Bill Williams Advanced is designed for automatic chart analysis using Bill Williams' "Profitunity" system. The indicator analyzes four timeframes at once. Manual (Be sure to read before purchasing) Advantages 1. Automatically analyzes the chart using the "Profitunity" system of Bill Williams. The found signals are placed in a table in the corner of the screen. 2. Equipped with a trend filter based on the Alligator indicator. Most of the system signals are recommended to be used only accordi
        XQ Indicator MetaTrader 5
        Marzena Maria Szmit
        5 (1)
        Step into the realm of Forex trading with confidence and precision using XQ, a cutting-edge Forex indicator designed to elevate your trading game to unprecedented heights. Whether you're a seasoned trader or just stepping into the world of currency exchange, XQ Forex Indicator empowers you with the insights and signals needed to make informed trading decisions. The signal conditions are a combination of three indicators, and XQ Forex Indicator only display  medium and long-term trends . The ind
        Profit from market structure changes as price reverses and pulls back. The market structure reversal alert indicator identifies when a trend or price move is approaching exhaustion and ready to reverse. It alerts you to changes in market structure which typically occur when a reversal or major pullback are about to happen. The indicator identifies breakouts and price momentum initially, every time a new high or low is formed near a possible exhaustion point. The indicator draws in a rectangle on
        Auto Order Block with break of structure based on ICT and Smart Money Concepts Futures Break of Structure ( BoS )             Order block ( OB )            Higher time frame Order block / Point of Interest ( POI )    shown on current chart           Fair value Gap ( FVG ) / Imbalance   ,  MTF      ( Multi Time Frame )    Volume Imbalance     ,  MTF          vIMB Gap’s Equal High / Low’s     ,  MTF             EQH / EQL Liquidity               Current Day High / Low           HOD /
        IX Power MT5
        Daniel Stein
        5 (1)
        IX Power   finally brings the unbeatable precision of FX Power to non-Forex symbols. It accurately determines the intensity of short, medium and long-term trends in your favourite indices, stocks, commodities, ETFs, and even cryptocurrencies. You can   analyse everything   your terminal has to offer. Try it out and experience how   your timing improves significantly   when trading. Read about our latest strategic development -  Easy scalping with IX Power Visit our all-new   Stein Investments
        Volume by Price MT5
        Brian Collard
        5 (3)
        The Volume by Price Indicator for MetaTrader 5 features Volume Profile and Market Profile TPO (Time Price Opportunity). Get valuable insights out of currencies, equities and commodities data. Gain an edge trading financial markets. Volume and TPO histogram bar and line charts. Volume Footprint charts. TPO letter and block marker charts including split structures. Versatile segmentation and compositing methods. Static, dynamic and flexible ranges with relative and/or absolute visualizations. Lay
        TrendLine PRO MT5
        Evgenii Aksenov
        4.78 (49)
        The Trend Line PRO indicator is an independent trading strategy. It shows the trend change, the entry point to the transaction, as well as automatically calculates three levels of Take Profit and Stop Loss protection Trend Line PRO is perfect for all Meta Trader symbols: currencies, metals, cryptocurrencies, stocks and indices Advantages of Trend Line PRO Never redraws its signals The possibility of using it as an independent strategy It has three automatic levels Take Profit and Stop Loss lev
        ICT, SMC, SMART MONEY CONCEPTS, SMART MONEY, Smart Money Concept, Support and Resistance, Trend Analysis, Price Action, Market Structure, Order Blocks, BOS/CHoCH,   Breaker Blocks ,  Momentum Shift,   Supply&Demand Zone/Order Blocks , Strong Imbalance,   HH/LL/HL/LH,    Fair Value Gap, FVG, Inversion FVG, IFVG,  Premium  &   Discount   Zones, Fibonacci Retracement, OTE, Buy Side Liquidity, Sell Side Liquidity, BSL/SSL Taken, Equal Highs & Lows, MTF Dashboard, Multiple Time Frame, BigBar, HTF OB
        Quantum Heiken Ashi PRO MT5
        Bogdan Ion Puscasu
        4.5 (8)
        Introducing the Quantum Heiken Ashi PRO charts with integrated alerts Designed to provide clear insights into market trends, the Heiken Ashi candles are renowned for their ability to filter out noise and eliminate false signals. Say goodbye to confusing price fluctuations and hello to a smoother, more reliable chart representation. What makes the Quantum Heiken Ashi PRO truly unique is its innovative formula, which transforms traditional candlestick data into easy-to-read colored bars. Red and g
        Gartley Hunter Multi
        Siarhei Vashchylka
        5 (5)
        Gartley Hunter Multi - An indicator for searching for harmonic patterns simultaneously on dozens of trading instruments and on all classic timeframes: (m1, m5, m15, m30, H1, H4, D1, Wk, Mn). Manual (Be sure to read before purchasing) | Version for MT4 Advantages 1. Patterns: Gartley, Butterfly, Shark, Crab. Bat, Alternate Bat, Deep Crab, Cypher 2. Simultaneous search for patterns on dozens of trading instruments and on all classic timeframes 3. Search for patterns of all possible sizes. Fr
        A key element in trading is zones or levels from which decisions to buy or sell a trading instrument are made. Despite attempts by major players to conceal their presence in the market, they inevitably leave traces. Our task was to learn how to identify these traces and interpret them correctly. Reversal First Impulse levels (RFI)   -  Version MT4                  INSTRUCTIONS                 RUS                 ENG                         R ecommended to use with an indicator   -  TREND PRO  
        Swing Scanner MT5
        Reza Aghajanpour
        5 (5)
        **   All Symbols   x   All Time frames   scan just by pressing scanner button ** ***Contact me after the purchase to send you instructions and add you in "Swing scanner group" for sharing or seeing experiences with other users. Introduction: Swing Scanner   is the indicator designed to detect swings in the direction of the trend and possible reversal swings. The indicator studies several price and time vectors to track the aggregate trend direction and detects situations in which the market is o
        Dark Power MT5
        Marco Solito
        4.84 (56)
        Dark Power  is an Indicator for intraday trading. This Indicator is based on   Trend Following  strategy, also adopting the use of an histogram to determine the right power . We can enter in good price with this Indicator, in order to follow the   strong trend   on the current instrument. The histogram is calculated based on the size of the bars and two moving averages calculated on the histogram determine the direction of the signal Key benefits Easily visible take profit/stop loss lines Int
        Golden Gate Algo MT5
        James David Lane
        4 (6)
        Introducing GoldenGate Algo: A Cutting-Edge Trading Solution!  Discover a revolutionary approach to trading with GoldenGate Algo (GGA), an advanced indicator designed to elevate your trading experience. GGA provides a comprehensive set of features to empower users with precision and confidence in their trading decisions. No re-painting! Pairs:   Any TimeFrames:   15m up to H1 Key Features: Buy and Sell Arrow Indications:   Receive Buy and Sell arrow indications accompanied by pop-up alerts,
        PZ Swing Trading MT5
        PZ TRADING SLU
        5 (4)
        Swing Trading is the first indicator designed to detect swings in the direction of the trend and possible reversal swings. It uses the baseline swing trading approach, widely described in trading literature. The indicator studies several price and time vectors to track the aggregate trend direction and detects situations in which the market is oversold or overbought and ready to correct. [ Installation Guide | Update Guide | Troubleshooting | FAQ | All Products ] Profit for market swings with
        Market Structure Patterns
        Samuel Manoel De Souza
        4.67 (18)
        Market Structure Patterns is an indicator based on smart money concepts that displays almost all of the SMC/ICT elements needed to take your trading decisions to the next level. Take advantage of the alerts , push notifications and email messages to keep informed from when an element is formed on the chart, the price crosses a level and/or enters in a box/zone. Developers can access the values of the elements of the indicator using the global variables  what allows the automation of trading deci
        More from author
        MA Dashboard
        Taras Slobodyanik
        4.5 (2)
        Multicurrency and multitimeframe modification of the indicator Moving Average (MA). On the dashboard you can see the current state of the indicator - breakouts and touches (by price) of the Fast MA and Slow MA, as well as the intersection of the MA lines between each other (moving average crossover) . In the parameters you can specify any desired currencies and timeframes. Also, the indicator can send notifications about the price touching the lines and about their crossing. By clicking on a cel
        The Gann Box (or Gann Square) is a market analysis method based on the "Mathematical formula for market predictions" article by W.D. Gann. This indicator can plot three models of Squares: 90, 52(104), 144. There are six variants of grids and two variants of arcs. You can plot multiple squares on one chart simultaneously. Parameters Square — selection of a square model: 90 — square of 90 (or square of nine); 52 (104) — square of 52 (or 104); 144 — universal square of 144; 144 (full) — "full"
        ZigZag Dashboard for MT5
        Taras Slobodyanik
        5 (2)
        Multicurrency and multitimeframe modification of the ZigZag indicator. Displays the current direction of the market, the height of the last movement, the number of bars in this movement and the breaking of the previous point of the ZigZag (horizontal line). This is MTF Scanner. You can specify any desired currencies and timeframes in the parameters. Also, the panel can send notifications when the ZigZag changes direction or when there was a breakthrough of the previous point. By clicking on a
        Heikin Ashi Dashboard
        Taras Slobodyanik
        5 (3)
        Multi-currency and multitimeframe Heikin Ashi indicator. Shows the current state of the market. On the scanner panel you can see the direction, strength and number of bars of the current trend. The Consolidation/Reversal candles are also shown using color. You can specify any desired currencies and periods in the parameters. Also, the indicator can send notifications when the trend changes or when reversal and consolidation candles (dojis) appear. By clicking on a cell, this symbol and period wi
        Pro Sessions MT4
        Taras Slobodyanik
        4 (2)
        This is an indicator of trading sessions  that can display all levels (Open-High-Low-Close) for four sessions. The indicator can also predict session levels. Sessions can be drawn with lines or rectangles (empty or filled), lines can be extended to the next session. You can easily hide/show each session by pressing hotkeys (by default '1', '2', '3', '4'). You can see ASR (Average Session Range) lines  (default hotkey 'A'). This is similar to the ADR calculation, only it is calculated based on t
        ZigZag Lines MTF
        Taras Slobodyanik
        4.27 (11)
        Multi timeframe ZigZag indicator. It displays the support/resistance horizontal lines and their breakouts, as well as draws the current targets of the market. It can also display lines of the Fractals indicator and candles from other periods (up to Quarterly).  The indicator redraws the last (current) point, and in some cases can change the last 2-3 points. All lines are drawn as objects (not indicator buffers, but there is a possibility to receive the data for the EA ). When used in an Exp
        Lines Profit Loss MT5
        Taras Slobodyanik
        4.57 (14)
        The indicator displays profit (loss) on the current symbol. You can freely drag and drop the line to display the current profit or loss. Parameters Calculation in money or in points — calculate the profit/loss in points or money. Add pending orders to calculate — take pending orders into account in calculations. Magic Number (0 - all orders on symbol) — magic number, if it is necessary to evaluate specific orders. Offset for first drawing (points from the average price) — offset of the line f
        FREE
        Time Scale for MT5
        Taras Slobodyanik
        4.88 (16)
        The indicator draws the time scale on the chart. You can specify the time offset, adjust the size and font to display on the chart ( it is displaying your local time on your chart instead of MT time ). You can also select the desired format for displaying the date and time. You may be interested in my other product , which contains a more advanced version of the Time Scale . Parameters Hours (time shift) — time shift (hours); Minutes (time shift) — time shift (minutes); Show time on mouse — sh
        FREE
        MA Dashboard MT5
        Taras Slobodyanik
        5 (4)
        Multicurrency and multitimeframe modification of the indicator Moving Average (MA). On the dashboard you can see the current state of the indicator - breakouts and touches (by price) of the Fast MA and Slow MA, as well as the intersection of the MA lines between each other (moving average crossover). In the parameters you can specify any desired currencies and timeframes. Also, the indicator can send notifications about the price touching the lines and about their crossing. By clicking on a cell
        ADX Dashboard
        Taras Slobodyanik
        5 (3)
        ADX indicator is used to determine the trend and its strength. The direction of the price is shown by the +DI and -DI values, and the ADX value shows the strength of the trend. If +DI is above -DI, then the market is in an uptrend, if on the contrary, it is a downtrend. If ADX is below 20, then there is no definite direction. As soon as the indicator breaks this level, a medium-strength trend begins. Values above 40 indicate a strong trend (a downtrend or an uptrend). Multicurrency and multit
        Lines Profit Loss
        Taras Slobodyanik
        4.82 (22)
        The indicator displays profit (loss) on the current symbol. You can freely drag and drop the line to display the current profit or loss. Parameters Calculation in money or in points — calculate the profit/loss in points or money. Add pending orders to calculate — take pending orders into account in calculations. Magic Number (0 - all orders on symbol) — magic number, if it is necessary to evaluate specific orders. Offset for first drawing (points from the average price) — offset of the line fr
        FREE
        Multicurrency and multi timeframe modification of the Relative Strength Index (RSI) indicator. You can specify any desired currencies and timeframes in the parameters. Also, the panel can send notifications when crossing overbought and oversold levels. By clicking on a cell with a period, this symbol and period will be opened. This is MTF Scanner. The key to hide the dashboard from the chart is "D" by default. Similar to the Currency Strength Meter, the Dashboard can automatically select pairs
        Multicurrency and multi-timeframe indicator Inside Bar (IB). In the parameters, you can specify any desired currencies and timeframes. The panel displays the last found Inside Bar (and Mother Bar) pattern, the current price position and the breakout of the levels of the Mother and Inside Bars. You can set the size and color for bars and text in the cells. The indicator can also send notifications when levels are broken. By clicking on a cell with a period, the specified symbol and period will b
        Multicurrency and multitimeframe modification of the Stochastic Oscillator. You can specify any desired currencies and timeframes in the parameters. The panel displays the current values and intersections of the lines — Signal and Main (stochastics crossover). Also, the indicator can send notifications when crossing overbought and oversold levels. By clicking on a cell with a period, this symbol and period will be opened. This is MTF Scanner. The key to hide the dashboard from the chart is "D"
        Multicurrency and multitimeframe indicator of the Standard Deviation Channel. Displays the current direction of the market. On the panel, you can see breakouts and touches (by price) of the levels of the linear regression channel. In the parameters, you can specify any desired currencies and timeframes. Also, the indicator can send notifications when levels are touched. By clicking on a cell, this symbol and period will be opened. This is MTF Scanner. The key to hide the dashboard from the char
        ZigZag Lines MTF for MT5
        Taras Slobodyanik
        5 (7)
        Multi timeframe ZigZag indicator. It displays the support/resistance horizontal lines and their breakouts, as well as draws the current targets of the market. It can also display lines of the Fractals indicator and candles from other periods (up to Quarterly).  The indicator redraws the last (current) point, and in some cases can change the last 2-3 points. All lines are drawn as objects (not indicator buffers, but there is a possibility to receive the data for the EA ). When used in an Exp
        Pro Sessions MT5
        Taras Slobodyanik
        5 (1)
        This is an indicator of trading sessions  that can display all levels (Open-High-Low-Close) for four sessions . The indicator can also predict session levels. Sessions can be drawn with lines or rectangles (empty or filled), lines can be extended to the next session. You can easily hide/show each session by pressing hotkeys (by default '1', '2', '3', '4'). You can see ASR (Average Session Range) lines  (default hotkey 'A'). This is similar to the ADR calculation, only it is calculated based on
        Multicurrency and multitimeframe modification of the Relative Strength Index (RSI) indicator. You can specify any desired currencies and timeframes in the parameters. Also, the panel can send notifications when crossing overbought and oversold levels. By clicking on a cell with a period, this symbol and period will be opened. This is MTF Scanner. The key to hide the dashboard from the chart is "D" by default. Similar to the Currency Strength Meter, the Dashboard can automatically select pairs c
        MACD Dashboard MT5
        Taras Slobodyanik
        5 (1)
        Multi-currency and multi-timeframe indicator MACD. The dashboard can display both the Traditional (true) MACD and the MACD which is built into MetaTrader. On the panel you can see the current state of the indicator — the direction of movement of the MACD lines, their intersection and a pop-up window with the indicator chart. In the parameters you can specify any desired pairs-symbols and timeframes. The scanner can also send notifications about lines crossing each other and about lines crossing
        The indicator automatically draws the Fibonacci levels based on  ZigZag indicator,  Trading Sessions,  Fractals or Candles (including non-standard timeframes: Year, 6 Months, 4 Months, 3 Months, 2 Months) ( Auto Fibo Retracement ). You can choose any higher time frame for Fibonachi calculation. The levels are redrawn every time the current bar closes. It is possible to enable alerts when crossing the specified levels. You can also analyze levels in history. To do this, it is necessary to specif
        MACD Dashboard
        Taras Slobodyanik
        Multi-currency and multi-timeframe indicator MACD. The dashboard can display both the Traditional (true) MACD and the MACD which is built into MetaTrader. On the panel you can see the current state of the indicator — the direction of movement of the MACD lines, their intersection and a pop-up window with the indicator chart. In the parameters you can specify any desired pairs-symbols and timeframes. The scanner can also send notifications about lines crossing each other and about lines crossing
        Magnifier Ruler Crosshair
        Taras Slobodyanik
        5 (3)
        The indicator has three main tools: Magnifier (Zoom chart), Ruler  ( Time and Price scales ),   and Crosshair. You can move it all around with your mouse and customize different formats for  displaying , customize   size and color of each element. The Magnifier (zoom chart) allows you to display candles from any time frame and at different scales. Default hotkeys: 'Q' - higher timeframe, 'A' - lower timeframe, 'W' - decrease candle size, 'S' - increase candle size, 'Z' - show/hide zoom chart.
        Heikin Ashi Dashboard MT5
        Taras Slobodyanik
        5 (1)
        Multi-currency and multitimeframe Heikin Ashi indicator. Shows the current state of the market. On the scanner panel you can see the direction, strength and number of bars of the current trend. The Consolidation/Reversal candles are also shown using color. You can specify any desired currencies and periods in the parameters. Also, the indicator can send notifications when the trend changes or when reversal and consolidation candles (dojis) appear. By clicking on a cell, this symbol and period wi
        Time Scale
        Taras Slobodyanik
        4.8 (10)
        The indicator draws the time scale on the chart. You can specify the time offset, adjust the size and font to display on the chart (it is displaying your local time on your chart instead of MT time). You can also select the desired format for displaying the date and time. While holding down the middle mouse button, and moving the cursor, a slider will appear on the scale. You may be interested in my other product , which contains a more advanced version of the Time Scale. Parameters Hours (tim
        FREE
        News Dashboard MT4
        Taras Slobodyanik
        4.33 (6)
        This dashboard displaying current news from ForexFactory.com (calendar FFC) and from the Investing.com website . You can sort news by impact and by country, and display them on the chart with one click. By holding down the 'Ctrl' key, you can select several different 'currencies' or 'impacts' to sort. Also, this utility shows not only the forecast, but also the actual values ​​after they appear on the site. You can set a separate notification for each news. You can read the news using your EA
        Symbol Manager for MT5
        Taras Slobodyanik
        5 (1)
        Symbol Manager or Grid Manager, designed to group orders into one position (by symbol and by direction). This utility will be useful to multi-currency traders, who can have multiple orders on several pairs. You will be able to see the total number of lots, the total profit, and set virtual stop loss and virtual take profit. To set a real TP (or SL), you must first set the virtual value, and then enter the command in this cell: "set". If you want to set real TP/SL for all orders at once, then en
        Multicurrency and multitimeframe modification of the indicator Bollinger Bands. On the dashboard you can see breakouts and touches of the Bollinger Bands. In the parameters you can specify any desired currencies and timeframes. The indicator can also send notifications when the price touches the Bollinger Bands, when the current volatility changes (expands or falls), and when the price touches all the bands. By clicking on a cell with a period, this symbol and period will be opened. This is MTF
        Multicurrency and multitimeframe modification of the Stochastic Oscillator. You can specify any desired currencies and timeframes in the parameters. The panel displays the current values and intersections of the lines — Signal and Main (stochastics crossover). Also, the indicator can send notifications when crossing overbought and oversold levels. By clicking on a cell with a period, this symbol and period will be opened. This is MTF Scanner. The key to hide the dashboard from the chart is "D"
        The indicator has three main tools: Magnifier (Zoom chart), Ruler  ( Time and Price scales ),   and Crosshair. You can move it all around with your mouse and customize different formats for  displaying , customize   size and color of each element. The Magnifier (zoom chart) allows you to display candles from any time frame and at different scales. Default hotkeys: 'Q' - higher timeframe, 'A' - lower timeframe, 'W' - decrease candle size, 'S' - increase candle size, 'Z' - show/hide zoom chart.
        CCI Dashboard for MT4
        Taras Slobodyanik
        5 (3)
        Multicurrency and multitimeframe modification of the Commodity Channel Index (CCI) indicator. You can specify any desired currencies and timeframes in the parameters. Also, the panel can send notifications when crossing overbought and oversold levels. By clicking on a cell with a period, this symbol and period will be opened. This is MTF Scanner. The key to hide the dashboard from the chart is "D" by default. Parameters CCI Period — averaging period. CCI Applied price — price type. Clear
        Filter:
        Adz trading
        100
        Adz trading 2024.04.06 21:11 
         

        Very fluid and precise indicator to never miss the start of a trend , it is a must to have $$$

        Baatar Bazar
        322
        Baatar Bazar 2024.03.24 19:18 
         

        Great indicator for ADX users. Thank you.

        Jason Perez Oconnor
        143
        Jason Perez Oconnor 2023.11.13 14:30 
         

        Extremely useful and underrated. Great for checking the ADX across different pairs and timeframes on one chart!

        Reply to review
        Version 3.40 2024.04.16
        1) Added color parameters for highlighting the text of +DI and -DI values - “Highlight the +DI value when line is increasing” and “Highlight the -DI value when line is increasing”.
        Version 3.30 2024.04.06
        1) Added parameter: "ADX changes direction".
        Version 3.20 2024.04.03
        1) Added parameters: "DI+ changes direction", "DI- changes direction", DI+ crosses level X (0-off)", "DI- crosses level X (0-off)".
        Version 3.10 2024.03.13
        1) Changed the behavior of setting the timer at startup. Now the indicator tries to start the timer again when a new tick arrives. If there is no tick for a long time (or it’s a weekend), you can click on the button on the chart and restart the timer yourself.
        Version 3.0 2023.11.11
        1) Added automatic shifting of the dashboard to the foreground.
        Version 2.90 2023.10.15
        1) The "Y-offset (pix, +/-)" parameter can now be negative.
        2) Changed the behavior of the pop-up chart when the window is small.
        Version 2.80 2023.09.03
        1) Added "Hotkey to enable/disable the Popup chart" parameter for "Popup chart".
        2) Added "Y-offset (pix)" parameter for "Popup chart".
        Version 2.70 2023.08.28
        1) Added a Dashboard recovery check when running multiple copies on the same chart.
        Version 2.60 2023.08.25
        1) Returned the deletion of the dashboard from the chart at startup.
        Version 2.50 2023.08.18
        1) Optimization of pop-up windows for MT5.
        Version 2.40 2023.07.29
        1) Added a hotkey to hide the dashboard, by default "D".
        2) The condition of the list of pairs for the second parameter has been changed. Pairs in the second parameter must be typed only with a semicolon and must be in exact case. "Pairs (separated ONLY by a semicolon and have exact letter case)"
        Version 2.30 2023.07.20
        1) The condition of the list of pairs for the second parameter has been changed. Pairs in the second parameter must be typed only with a semicolon and must be in exact case. "Pairs (separated ONLY by a semicolon and have exact letter case)"
        2) Added parameter "Enable text tooltip in the table".
        Version 2.20 2023.07.18
        1) Added "Popup chart" parameters. Now, when you hover the mouse over the cells, you can see a pop-up chart from this timeframe.
        2) Fixed some minor bugs.
        Version 2.10 2023.07.03
        1) Added "Color scheme" parameter.
        2) Changed the color scheme.
        Version 2.0 2023.07.01
        1) Added parameters "ADX for One Currency" and "Swap +DI -DI values". The dashboard will automatically select pairs containing the specified Currency or those pairs that have this Currency as the base. The indicator will also calculate the ADX for this Currency on a separate line.
        2) Alert bug for "All timeframes in the same Trend zone" has been fixed.
        Version 1.90 2023.06.07
        1) Added the ability to enable/disable alerts for each Symbol when clicking on the name of the Pair. If no Pair is selected then alerts are enabled for all Symbols.
        Version 1.80 2023.05.30
        1) Added parameter "Decimal places for ADX values".
        Version 1.70 2022.09.20
        1) Disabled stopping the indicator in case of an error starting the ADX. Now there will be a repeated attempt to launch the ADX.
        Version 1.60 2022.06.07
        1) Added "Refresh cells only on new bar" parameter.
        Version 1.50 2022.05.12
        1) Added tooltips showing current trend strength and current ADX direction.
        Version 1.40 2022.04.13
        1) Added a parameter to highlight the current Pair and TF. (Highlight the current Pair and TF).
        2) Added tooltip with current values.
        Version 1.30 2022.01.17
        1) Added an alert when all timeframes are in the same trend zone - "All timeframes in the same Trend zone".
        Version 1.10 2021.11.29
        1) Added parameter: "Color Highlight the ADX value when line is increasing".