• Overview
  • Reviews (7)
  • Comments (20)
  • What's new

ADX Dashboard

5
ADX indicator is used to determine the trend and its strength. The direction of the price is shown by the +DI and -DI values, and the ADX value shows the strength of the trend. If +DI is above -DI, then the market is in an uptrend, if on the contrary, it is a downtrend. If ADX is below 20, then there is no definite direction. As soon as the indicator breaks this level, a medium-strength trend begins. Values above 40 indicate a strong trend (a downtrend or an uptrend).

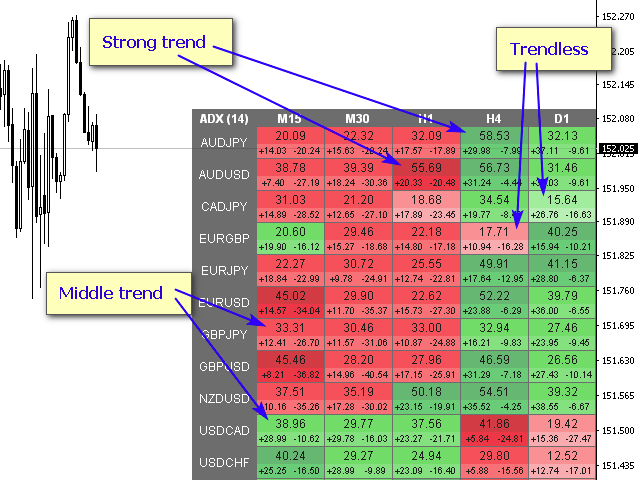
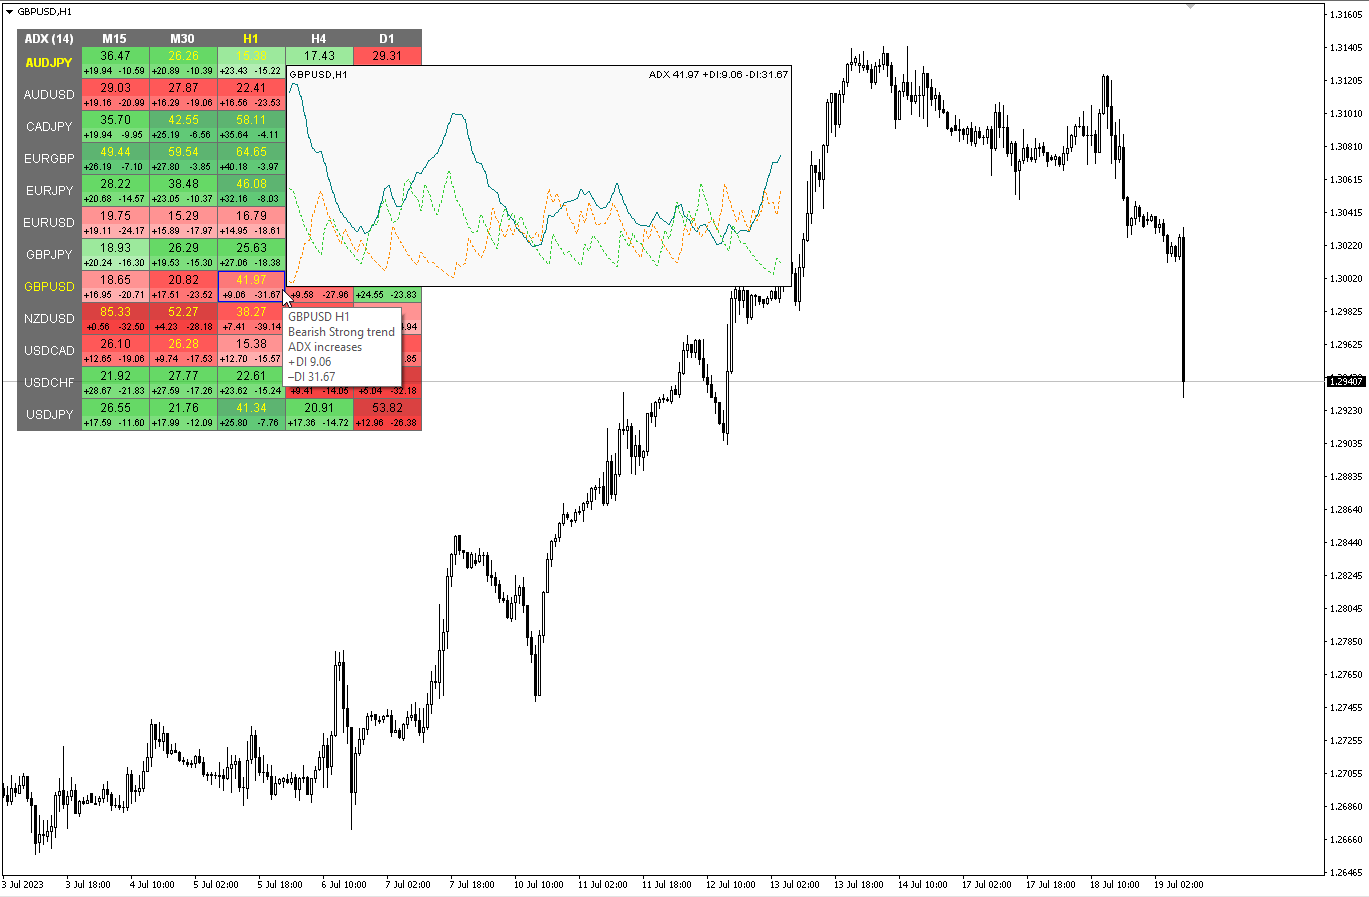
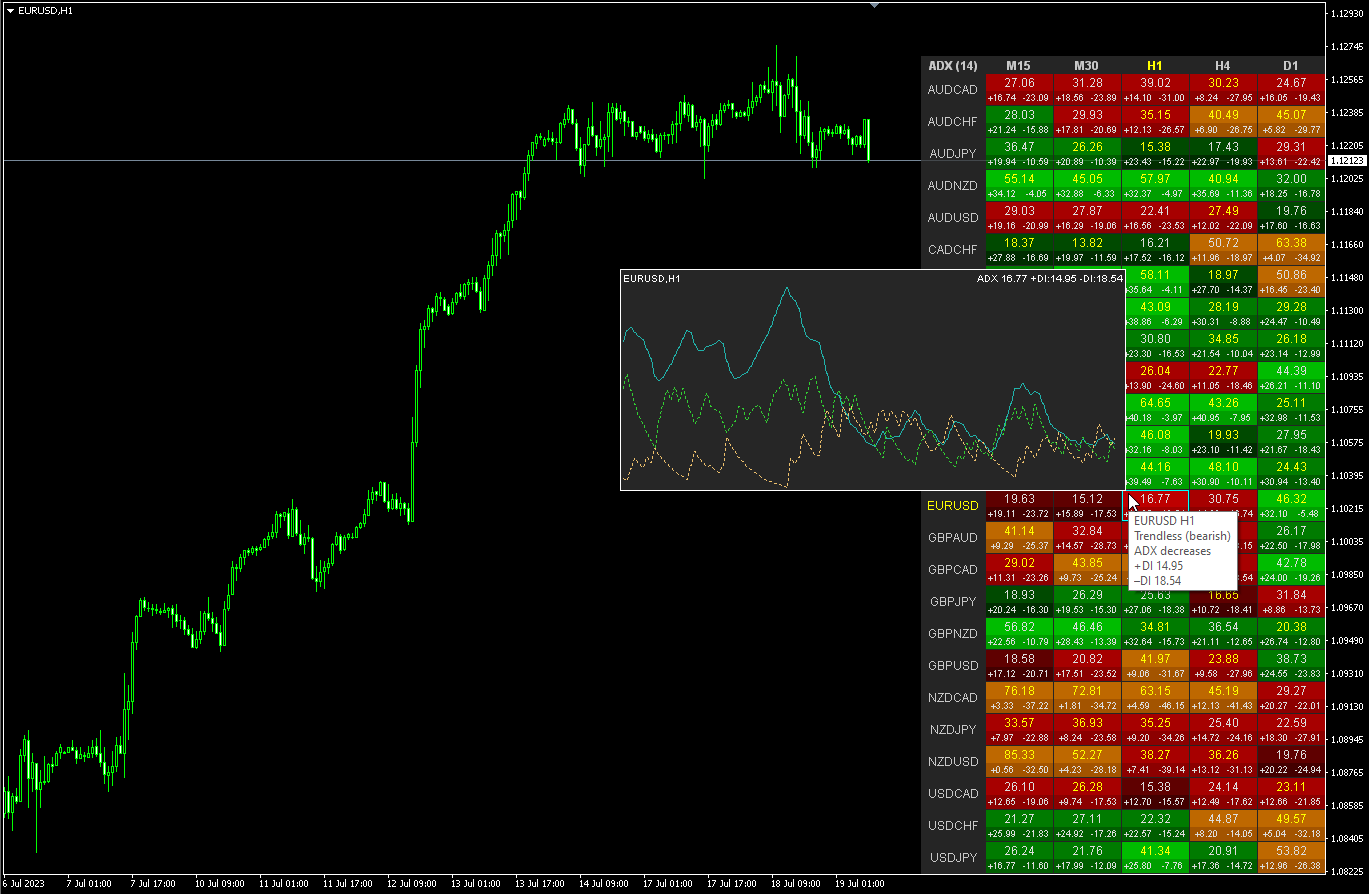
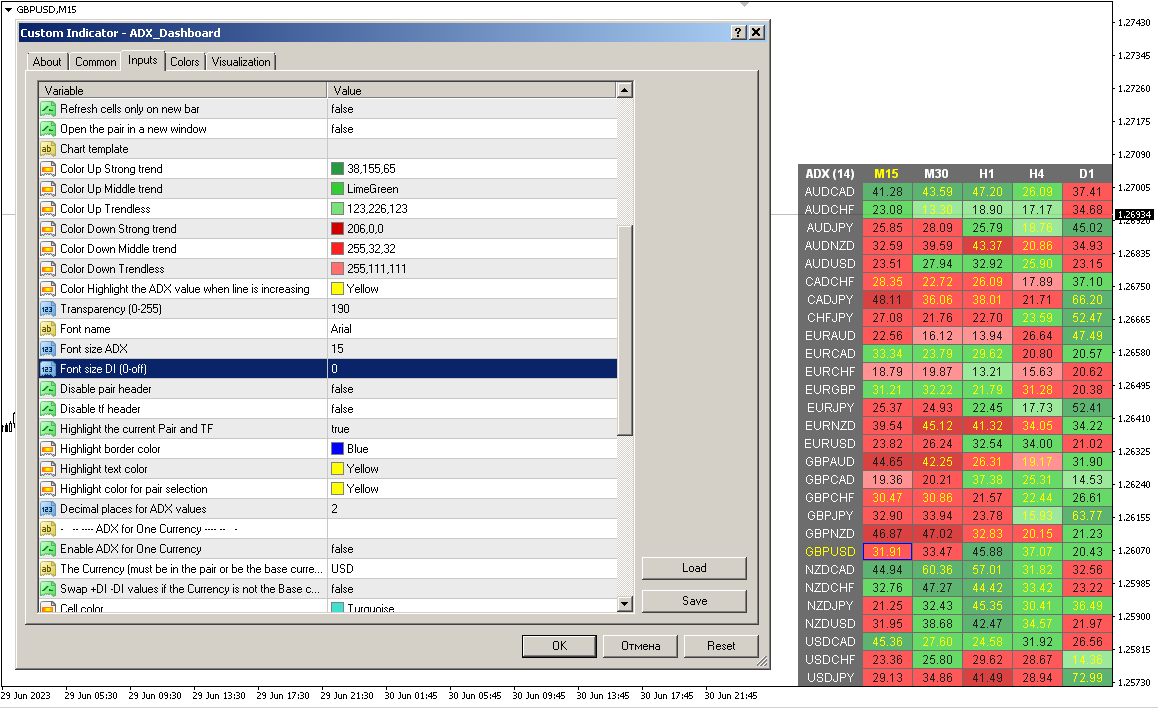
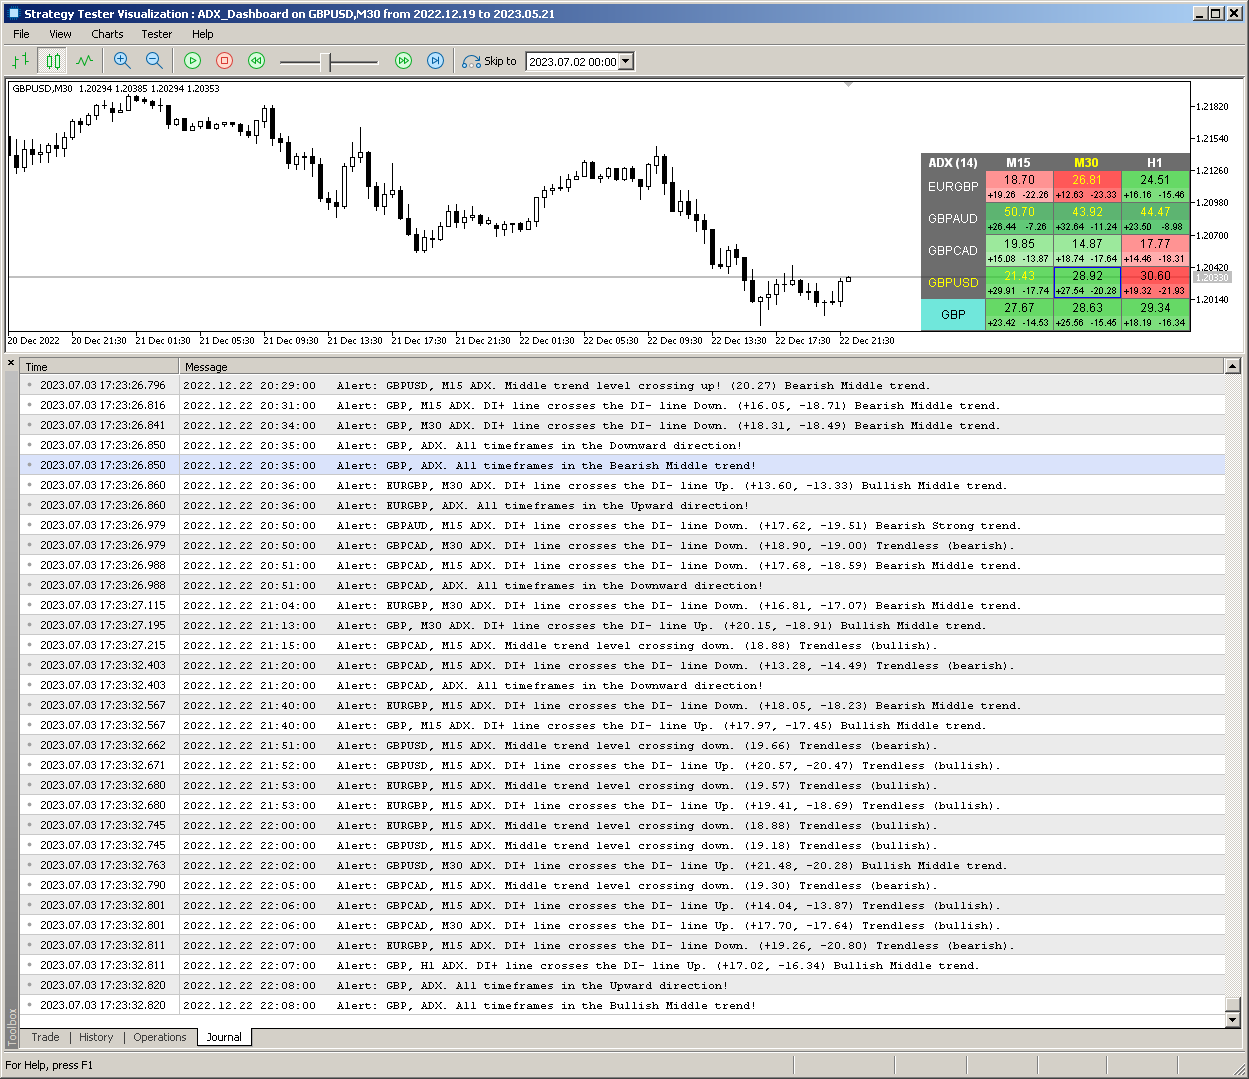
Multicurrency and multitimeframe modification of the Average Directional Movement Index (ADX) indicator. You can specify any desired currencies and timeframes in the parameters. Also, the indicator can send notifications when the trend strength levels are crossed, and when the +DI and -DI lines are crossed. By clicking on a cell with a period, this symbol and period will be opened. This is MTF Scanner.
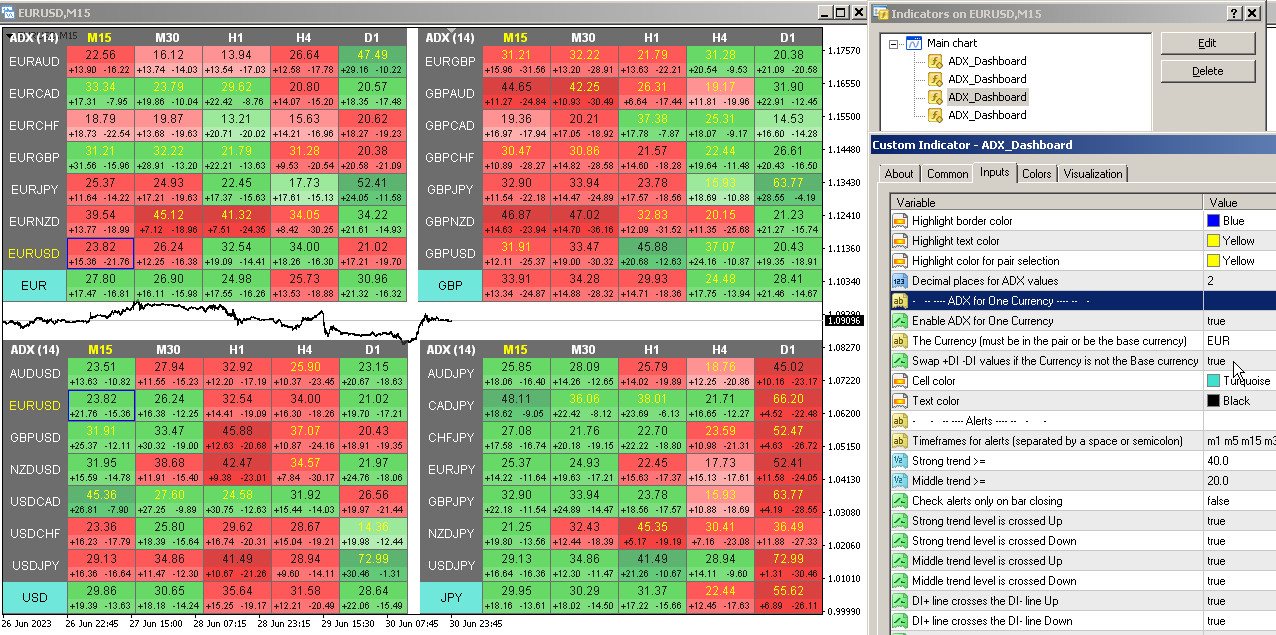
Similar to the Currency Strength Meter (CSM), the Dashboard can automatically select pairs that contain a specified currency, or those pairs that have that currency as their base currency. The indicator searches for Currency in all pairs that are specified in the “Set of Pairs”; other pairs are ignored. And based on these pairs, the total ADX for this currency is calculated. And you can see how strong or weak that currency is.

The key to hide the dashboard from the chart is "D" by default.


Parameters

ADX Period — averaging period.
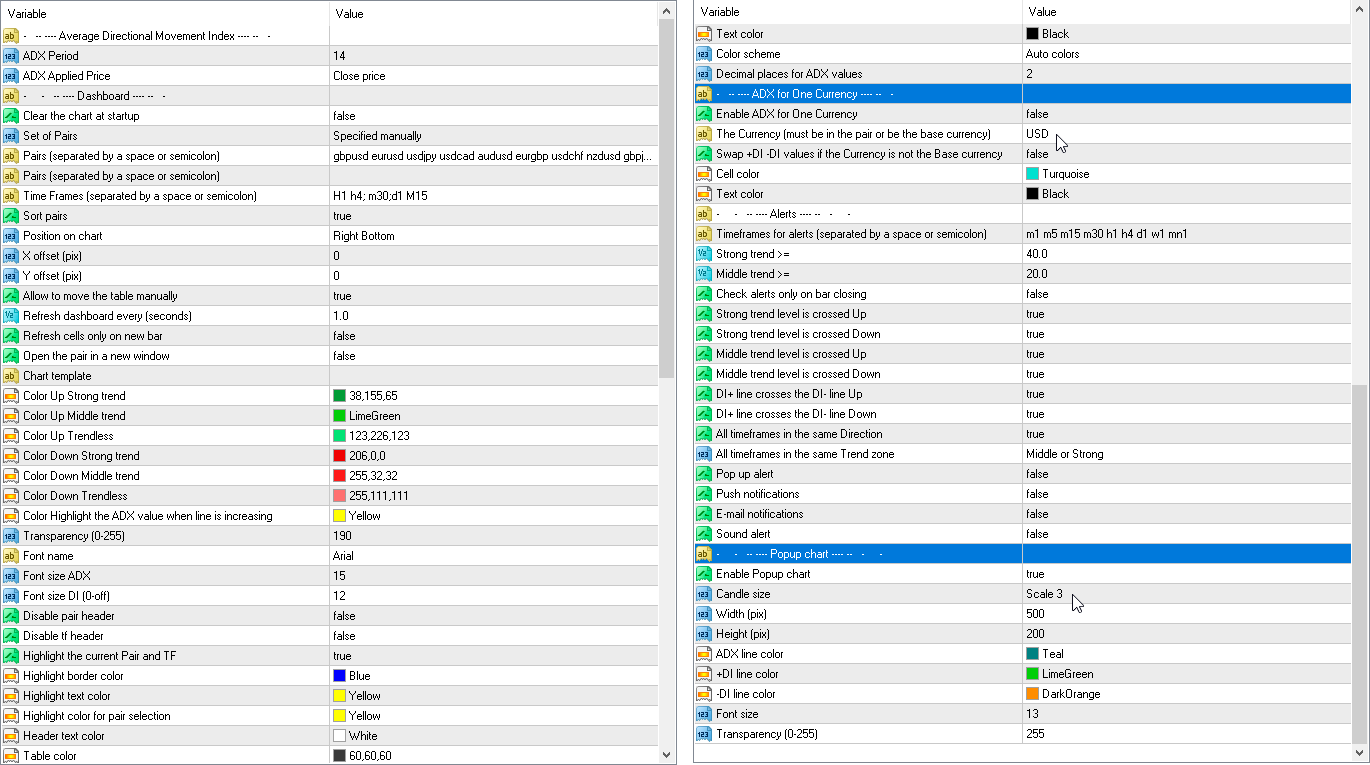
ADX Applied Price — price type.
Clear the chart at startup — clear the chart at startup.
Set of Pairs — set of symbols
    — Market Watch — pairs from the "Market Watch".
    — Specified manually — pairs specified manually, in the parameters "Pairs".
    — Current pair — show only the current pair.
    Pairs (separated by a space or semicolon) — list of symbols separated by spaces or semicolons. The currency names should be written exactly like the broker's, keeping the case and prefix/suffix.
    Time Frames (separated by a space or semicolon) — list of timeframes separated by spaces or semicolons (multi timeframe).
    Sort pairs — sorting the list of pairs.
    Position on chart — corner to display the panel on the chart.
    X offset (pix) — shift the panel along the X axis.
    Y offset (pix) — shift the panel along the Y axis.
    Allow to move the table manually — allow moving the table with the mouse.
    Refresh dashboard every (seconds) — update period for all pairs and timeframes.
    Refresh cells only on new bar — cell updates (and alerts) will only occur when a new bar appears.
    Open the pair in a new window — open a symbol in a new chart window by clicking.
    Chart template — the name of the template for the chart, if the chart opens in a new window.
      Color settings
      Color Up Strong trend — cell color if there is a strong trend.
      Color Up Middle trend — cell color, if the middle trend.
      Color Up Trendless — cell color if there is no trend.
      Color Down Strong trend — cell color if there is a strong trend.
      Color Down Middle trend — cell color, if the average trend.
      Color Down Trendless — cell color if there is no trend.
      Transparency (0-255) — transparency of the panel.
      Font name.
      Font size ADX.
      Font size DI (0-off).
        Alerts

        Timeframes for alerts (separated by a space or semicolon) — list of periods for which the alert will be sent (separated by a space or semicolon).
        Strong trend >= — the level of a strong trend
        Middle trend >= — the level of the middle trend.
        Check alerts only on bar closing — check level crossing only after bar closing.
        Strong trend level is crossed Up — alert when ADX crosses the level of a strong trend up.
        Strong trend level is crossed Down — alert when ADX crosses the level of a strong trend down.
        Middle trend level is crossed Up — alert when the level of the middle trend is crossed upwards.
        Middle trend level is crossed Down — alert when the level of the middle trend is crossed downwards.
        DI+ line crosses the DI- line Up — alert when DI+ crosses DI- up.
        DI+ line crosses the DI- line Down — alert when DI+ crosses DI- down.
        All timeframes in the same direction — alert when all cells show the same direction.
        DI+ changes direction.
        DI- changes direction.
        DI+ crosses level X (0-off).
        DI- crosses level X (0-off).
        Pop up alert.
        Push notifications.
        E-mail notifications.
        Sound alert.

        Popup chart
        Enable Popup chart
        Candle size
        Width (pix)
        Height (pix)
        Font size
        Transparency (0-255)


        Reviews 7
        Heiner G.
        520
        Heiner G. 2024.11.07 10:08 
         

        A clear recommendation to buy. The dashboard is great and the fact that you can also integrate the data of a symbol into the active chart is also excellent.

        loginuras
        1005
        loginuras 2024.07.13 23:10 
         

        Awesome!

        danmar
        1712
        danmar 2023.05.30 16:28 
         

        HI, I just bought this indicator after the excellent RSI dashboard Multicurrency and i will try it now.

        the 5 star are because Mr Taras made an update before i buy the product !

        to add the possibility to adjust the number of decimals like my demand for RSI dashboard

        Thanks so much for taking care of what your buyer need

        I will come back after using it

        Thanks again Warmly

        2023 06 08 : with DASHBOARD RSI they are the 2 main that i use; very accurate and for me bring me good information's for my scalping M1 M5; Well done

        2023 07 03 : I ask to add an functionality and this was made so quickly ! definitively Mr Taras has very good products and an real attention to the need of his users

        i really regret to not be able to put 10 stars.

        Well done and thanks so much to make it so so quickly

        You are in the top of the sellers taking care of users ++++++++

        2023 07 05 : It ask for an update (but later) and Taras made it so so so quickly. Thank you so much

        10 stars for user supports , quality, usability, and so on

        2024 04 30 : the 2 dashboard RSI and this one ADX are really efficient, easy to use and param and light in ressources computer, 2 of my most important indicator. well done.

        2024 04 30 : this day i ask for a change of display and the same day Taras made an update, it save me half width of the dashboard on a very big screen. Thank you a lot and difficil to make better. Very Very well done.

        Recommended products
        Master Scalping M1 is an innovative indicator that uses an algorithm to quickly and accurately determine the trend.The indicator calculates the time of opening and closing positions, the indicator's algorithms allow you to find the ideal moments to enter a deal (buy or sell an asset), which increase the success of transactions for most traders. Benefits of the indicator: Easy to assemble, does not overload the chart with unnecessary information. Can be used as a filter for any strategy. Works on
        Golden Flash Scalper
        Felipe Jose Costa Pereira
        Key Features: The Golden Scalper XAU/USD is designed to adapt to the nuances of the gold market, delivering high-quality signals. Advanced Pattern Recognition: Using sophisticated pattern recognition techniques, the indicator identifies the best entry opportunities, filtering out false signals and increasing the chances of success in every trade. High Accuracy Rate: Powered by intelligent algorithms, the indicator boasts a superior accuracy rate, offering traders reliable signals even in volatil
        Forex Gump
        Andrey Kozak
        2.4 (5)
        Forex Gump is a fully finished semi-automatic trading system. In the form of arrows, signals are displayed on the screen for opening and closing deals. All you need is to follow the instructions of the indicator. When the indicator shows a blue arrow, you need to open a buy order. When the indicator shows a red arrow, you need to open a sell order. Close orders when the indicator draws a yellow cross. In order to get the most effective result, we recommend using the timeframes H1, H4, D1. There
        Infinity Trend Pro
        Yaroslav Varankin
        1 (1)
        This is a trend indicator without redrawing Developed instead of the binary options strategy (by the color of the Martingale candlestick) Also works well in forex trading When to open trades (binary options) A signal will appear in the place with a candle signaling the current candle It is recommended to open a deal for one candle of the current timeframe M1 and M5 When a blue dot appears, open a deal up When a red dot appears, open a trade down. How to open trades on Forex. When a signal is rec
        EZZ Elite Zig Zag is an indicator for the MetaTrader 4 terminal. This indicator traces the peak of the trend based on the market reversal, thus showing various opportunities in the financial market. EZZ Elite Zig Zag is a visual tool, intuitive, and easy to understand and use.  Test it Yourself by Downloading it for Free. Author Paulo Rocha all rights reserved
        Introducing the "Extreme Exhaustion Levels": A powerful tool for traders looking to identify market exhaustion and potential trend reversals. The Exhaustion Indicator is an advanced technical analysis tool that helps traders identify when markets are overbought or oversold, potentially indicating an imminent reversal in the trend. With a unique combination of price action, moving averages, and Bollinger Bands, the Exhaustion Indicator provides traders with a comprehensive view of market condit
        FREE
        Supply / demand zones: observable areas where price has approached many times in the past. My   #1 Utility:  65+ features, including this indicator  |   Contact me  for any questions  |  MT5 version The indicator shows where the price could potentially be reversed again. Usually, the more times the price has been rejected from the level, the more significant it is. In the input settings   you can adjust: Enable or disbale Weak zones; Show or hide zone description; Font size; Set the basic color
        We present you the indicator "Candle closing counter", which will become your indispensable assistant in the world of trading. That’s why knowing when the candle will close can help: If you like to trade using candle patterns, you will know when the candle will be closed. This indicator will allow you to check if a known pattern has formed and if there is a possibility of trading. The indicator will help you to prepare for market opening and market closure. You can set a timer to create a pre
        Trend Bilio - an arrow indicator without redrawing shows potential market entry points in the form of arrows of the corresponding color: upward red arrows suggest opening a buy, green down arrows - selling. The entrance is supposed to be at the next bar after the pointer. The arrow indicator Trend Bilio visually "unloads" the price chart and saves time for analysis: no signal - no deal, if an opposite signal appears, then the current deal should be closed. It is Trend Bilio that is considered
        Owl smart levels
        Sergey Ermolov
        4.34 (35)
        MT5 version  |  FAQ The Owl Smart Levels Indicator  is a complete trading system within the one indicator that includes such popular market analysis tools as  Bill Williams' advanced fractals , Valable ZigZag which builds  the correct wave structure  of the market, and  Fibonacci levels  which mark the exact levels of entry into the market and places to take profits. Detailed description of the strategy Instructions for working with the indicator Advisor-assistant in trading Owl Helper Private
        PipFinite Trend PRO
        Karlo Wilson Vendiola
        4.88 (2245)
        Breakthrough Solution For Trend Trading And Filtering With All Important Features Built Inside One Tool! Trend PRO's smart algorithm detects the trend, filters out market noise and gives entry signals with exit levels. The new features with enhanced rules for statistical calculation improved the overall performance of this indicator. Important Information Revealed Maximize the potential of Trend Pro, please visit www.mql5.com/en/blogs/post/713938 The Powerful Expert Advisor Version Automatin
        Signal trend indicator. Detects the direction of the trend and is coloured accordingly.  Has built in audible and visual alerts when trends change. Can send notifications to your phone or email. Allows Trend and Counter-Trend trading. Works on all timeframes, all currency pairs, metals, indices and cryptocurrencies. Can be used with binary options. Distinctive features No re-drawing; Simple and clear settings; Four types of alerts; Works on all timeframes and all trading tools; Suitable
        "Bitcoin indicator" is a ready-made mechanical trading system for Bitcoin. The system is implemented as an indicator that shows the trader on the chart the price reversal points and the current trend direction. This information is enough to effectively trade in the market. The "Bitcoin indicator" consists of a complex analytical block that constantly analyzes the market and shows the trader where the trend is heading. The indicator also shows with dots on the chart, the price reversal points. S
        MA Crosses PRO MT4
        Volodymyr Hrybachov
        MA CROSSES PRO MT4  - arrows indicator of the intersection of moving averages. The indicator parameters have intuitive names and each line is configured separately. The indicator can signal the signal by displaying arrows, giving a sound signal, sending a notification to mobile terminals and e-mail. The indicator is NOT redrawn Signals on closing a candle only Perfect for scalping Works on any pair and any timeframe. The older the time frame, the better the signal. Compatible as an addition to a
        Support and Resistance is a very important reference for trading.  This indicator provides customized support and resistance levels, automatic draw line and play music functions.  In addition to the custom RS, the default RS includes Pivot Point, Fibonacci, integer Price, MA, Bollinger Bands. Pivot Point is a resistance and support system. It has been widely used at froex,stocks, futures, treasury bonds and indexes. It is an effective support resistance analysis system. Fibonacci also known as t
        FreqoMaster
        Stanislav Korotky
        The main idea of this indicator is rates analysis and prediction by Fourier transform. The indicator decomposes exchange rates into main harmonics and calculates their product in future. The indicator shows 2 price marks in history, depicting price range in the past, and 2 price marks in future with price movement forecast. Buy or sell decision and take profit size are displayed in a text label in the indicator window. The indicator uses another indicator as an engine for calculations - FreqoMet
        Stepping Trend
        Mpendulo Chiliza
        The Stepping Trend Indicator     The Steppi ng Trend indicator uses the  average true range  (ATR indicator) in its calculation. This gives you control to set your own average true range period, I set the Default as 10.   Indicator Details. Green Arrow Up: This means you are at the starting point of a new bullish trend, it’s time to buy.   Red  Arrow  Down : This means you are at the starting point of a new  bearish  trend, it’ s time to sell .   What if you miss the Arrow Signal?   No prob
        This multicurrency indicator is the Lite version of the Cosmic Diviner Reversal Zone Pro indicator. The indicator is based on original formulas for analyzing the volatility and price movement strength. This allows determining the overbought and oversold states of instruments with great flexibility, as well as setting custom levels for opening buy or sell orders when the overbought or oversold values of the instruments reach a user-defined percentage. A huge advantage of Reversal Zone Lite is the
        [ZhiBiCCI] indicators are suitable for all cycle use, and are also suitable for all market varieties. [ZhiBiCCI] Green solid line is a reversal of bullish divergence. The green dotted line is a classic bullish divergence. [ZhiBiCCI] The solid line to the red is a reverse bearish divergence. The red dotted line is a classical bearish divergence. [ZhiBiCCI] can be set in the parameters (Alert, Send mail, Send notification), set to (true) to send instant signals to the alarm window, email, insta
        Cosmic Diviner X Planet
        Olena Kondratenko
        4 (2)
        This unique multi-currency strategy simultaneously determines the strength of trends and market entry points, visualizing this using histograms on the chart. The indicator is optimally adapted for trading on the timeframes М5, М15, М30, Н1. For the convenience of users, the indicator renders the entry point (in the form of an arrow), recommended take profit levels (TP1, TP2 with text labels) and the recommended Stop Loss level. The take profit levels (TP1, TP2) are automatically calculated for
        Daily Candle Predictor is an indicator that predicts the closing price of a candle. The indicator is primarily intended for use on D1 charts. This indicator is suitable for both traditional forex trading and binary options trading. The indicator can be used as a standalone trading system, or it can act as an addition to your existing trading system. This indicator analyzes the current candle, calculating certain strength factors inside the body of the candle itself, as well as the parameters of
        The Th3Eng PipFinite indicator is based on a very excellent analysis of the right trend direction with perfect custom algorithms. It show the true direction and the best point to start trading. With StopLoss point and Three Take Profit points. Also it show the right pivot of the price and small points to order to replace the dynamic support and resistance channel, Which surrounds the price. And Finally it draws a very helpful Box on the left side on the chart includes (take profits and Stop loss
        MetaCOT 2 is a set of indicators and specialized utilities for the analysis of the U.S. Commodity Futures Trading Commission reports. Thanks to the reports issued by the Commission, it is possible to analyze the size and direction of the positions of the major market participants, which brings the long-term price prediction accuracy to a new higher-quality level, inaccessible to most traders. These indicators, related to the fundamental analysis, can also be used as an effective long-term filter
        Matrixs
        Andriy Sydoruk
        Matrix is a Forex arrow indicator. Displays signals simply and clearly! The arrows show the direction of the transaction, and are colored accordingly, which can be seen in the screenshots. As you can see, trading with such an indicator is easy. I waited for an arrow to appear in the desired direction - I opened a deal. An arrow formed in the opposite direction - closed the deal. The indicator also displays the lines with the help of which the arrow signals are formed, taking into account the int
        Blahtech Market Profile
        Blahtech Limited
        4.53 (15)
        Was: $249  Now: $149   Market Profile defines a number of day types that can help the trader to determine market behaviour. A key feature is the Value Area, representing the range of price action where 70% of trading took place. Understanding the Value Area can give traders valuable insight into market direction and establish the higher odds trade. It is an excellent addition to any system you may be using. Blahtech Limited presents their Market Profile indicator for the MetaTrader community. In
        Fourteen plus nine TD Sequential
        MOHAMMED IMAD HUSSEIN BASSEE
        Fourteen plus nine What is it for? Applying Tom DeMark’s TD Sequential serves the purpose of identifying a price point where an uptrend or a downtrend exhausts itself and reverses. . What are the main components of TD Sequential? TD Sequential has two parts – TD Setup and TD Countdown. The first phase of TD Sequential starts with a TD Setup and is completed with a 9 count. When the 9 count is completed, it is at that point, a price pause, price pullback, or reversal is likely. It is also at tha
        Point61 Indicator
        Evgeniy Machok
        5 (1)
        The Point61 indicator is the result of many years of monitoring of price behavior of currency pairs and metals. It is not a secret, that in times of uncertainty, traders are looking for possible levels of support and resistance - the point, where price should stop its movement. There are 2 possible scenarios at these points: 1. Reverse (correction) to the opposite direction; 2. Breakthrough to continue movement. Very often these points are used to set stop orders - TakeProfit or StopLoss
        For sure, this indicator has become very popular amongst traders. Through coding this indicator will give you the most accurate levels possible for your trading analysis. We have also added in the ability for you to receive alerts when the price breaks above or below a Support or Resistance lines! HOW TO USE The red rectangles represent your resistance/supply zone. The green rectangles represent your support/demand zone.  BONUS FEATURES We coded this indicator with the ability to switch between
        New, more accurate version of the Xmaster indicator. More than 200 traders from around the world have conducted more than 15,000 tests of different combinations of this indicator on their PCs in order to get the most effective and accurate formula. And here we present to you the "Xmaster formula indicator forex no repaint" indicator, which shows accurate signals and does not repaint. This indicator also sends signals to the trader by email and push. With the arrival of each new tick, it constan
        The indicator draws candles of the selected high timeframe on the current chart. It supports both standard timeframes and custom ones set in minutes. Built-in support for displaying the size of the candle, its body, as well as the upper and lower shadows. Alerts when High / Low breaks the previous candlestick of the selected timeframe. Customized types of elements for the simultaneous operation of several indicators on the same chart.
        Buyers of this product also purchase
        Gann Made Easy
        Oleg Rodin
        4.81 (101)
        Gann Made Easy is a professional and easy to use Forex trading system which is based on the best principles of trading using the theory of W.D. Gann. The indicator provides accurate BUY and SELL signals including Stop Loss and Take Profit levels. You can trade even on the go using PUSH notifications. PLEASE CONTACT ME AFTER PURCHASE TO GET MY TRADING TIPS PLUS A GREAT BONUS! Probably you already heard about the Gann trading methods before. Usually the Gann theory is a very complex thing not only
        - Lifetime update free - Real price is 80$ - 40% Discount ( It is 49$ now ) Contact me for instruction, add group and any questions! Related Products:  Bitcoin Expert , Gold Expert - Non-repaint Introduction The breakout and retest strategy is traded support and resistance levels. it involves price breaking through a previous level.  The break and retest strategy is designed to help traders do two main things, the first is to avoid false breakouts. Many false breakouts start with a candlestick
        Scalper Inside PRO
        Alexey Minkov
        4.75 (60)
        !SPECIAL SALE!  An exclusive indicator that utilizes an innovative algorithm to swiftly and accurately determine the market trend. The indicator automatically calculates opening, closing, and profit levels, providing detailed trading statistics. With these features, you can choose the most appropriate trading instrument for the current market conditions. Additionally, you can easily integrate your own arrow indicators into Scalper Inside Pro to quickly evaluate their statistics and profitability
        Golden Trend Indicator
        Noha Mohamed Fathy Younes Badr
        5 (8)
        Golden Trend indicator  is The best indicator for predicting trend movement this indicator never lags and never repaints and never back paints    and give  arrow buy and sell    before the candle appear  and it will help you and  will make your trading decisions clearer its work on all currencies and  gold and crypto and all time frame This unique  indicator uses very secret algorithms to catch the  trends, so you can trade using this indicator and see the trend clear on charts  manual guide and
        FX Power MT4 NG
        Daniel Stein
        5 (14)
        FX Power: Analyze Currency Strength for Smarter Trading Decisions Overview FX Power is your go-to tool for understanding the real strength of currencies and Gold in any market condition. By identifying strong currencies to buy and weak ones to sell, FX Power simplifies trading decisions and uncovers high-probability opportunities. Whether you’re looking to follow trends or anticipate reversals using extreme delta values, this tool adapts seamlessly to your trading style. Don’t just trade—trade
        TrendMaestro
        Stefano Frisetti
        5 (3)
        note: this indicator is for METATRADER4, if you want the version for METATRADER5 this is the link:  https://www.mql5.com/it/market/product/108106 TRENDMAESTRO ver 2.4 TRENDMAESTRO recognizes a new TREND in the bud, he never makes mistakes. The certainty of identifying a new TREND is priceless. DESCRIPTION TRENDMAESTRO identifies a new TREND in the bud, this indicator examines the volatility, volumes and momentum to identify the moment in which there is an explosion of one or more of these data a
        Easy Breakout
        Mohamed Hassan
        5 (8)
        4 copies left before price increases to $120! After your purchase, feel free to contact me for more details on how to receive a bonus indicator called VFI, which pairs perfectly with Easy Breakout for enhanced confluence!   Easy Breakout is a powerful price action trading system built on one of the most popular and widely trusted strategies among traders: the Breakout strategy ! This indicator delivers crystal-clear Buy and Sell signals based on breakouts from key support and resistance zone
        TPSproTREND PrO
        Roman Podpora
        4.79 (19)
        TPSpro TRENDPRO  - is a trend indicator that automatically analyzes the market and provides information about the trend and each of its changes, as well as giving signals for entering trades without redrawing! The indicator uses each candle, analyzing them separately. referring to different impulses - up or down impulse. Exact entry points into transactions for currencies, crypto, metals, stocks, indices!  ИНСТРУКЦИЯ RUS         INSTRUCTIONS  ENG              R ecommended to use with an indicato
        FX Volume
        Daniel Stein
        4.58 (33)
        FX Volume: Experience Genuine Market Sentiment from a Broker’s Perspective Quick Overview Looking to elevate your trading approach? FX Volume provides real-time insights into how retail traders and brokers are positioned—long before delayed reports like the COT. Whether you’re aiming for consistent gains or simply want a deeper edge in the markets, FX Volume helps you spot major imbalances, confirm breakouts, and refine your risk management. Get started now and see how genuine volume data can
        Trend Screener
        STE S.S.COMPANY
        4.81 (89)
        Unlock the Power of Trends Trading with the Trend Screener Indicator: Your Ultimate Trend Trading Solution powered by Fuzzy Logic and Multi-Currencies System! Elevate your trading game with the Trend Screener, the revolutionary trend indicator designed to transform your Metatrader into a powerful Trend Analyzer. This comprehensive tool leverages fuzzy logic and integrates over 13 premium features and three trading strategies, offering unmatched precision and versatility. LIMITED TIME OFFER : Sup
        TPSpro RFI Levels
        Roman Podpora
        4.82 (22)
        A key element in trading is zones or levels from which decisions to buy or sell a trading instrument are made. Despite attempts by major players to conceal their presence in the market, they inevitably leave traces. Our task was to learn how to identify these traces and interpret them correctly. ИНСТРУКЦИЯ RUS         INSTRUCTIONS  ENG            R ecommended to use with an indicator   -   TPSpro  TREND PRO -  Version MT5 Main functions: Displaying active zones for sellers and buyers! The indica
        Bull versus Bear
        Mohamed Hassan
        4.5 (18)
        Enjoy a   50% OFF   Christmas holiday sale!   Send us a message after your purchase to receive more information on how to get your  BONUS  for FREE  that works in great combination with Bull vs Bear ! Bull versus Bear is an easy-to-use Forex indicator that gives traders clear and accurate signals based on clear trend retests . Forget about lagging indicators or staring at charts for hours because  Bull vs Bear provides real-time entries with no lag and no repaint, so you can trade with confide
        Dynamic Forex28 Navigator
        Bernhard Schweigert
        5 (4)
        Specials Discount now. The Next Generation Forex Trading Tool. Dynamic Forex28 Navigator is the evolution of our long-time, popular indicators, combining the power of three into one: Advanced Currency Strength28 Indicator (695 reviews) + Advanced Currency IMPULSE with ALERT (520 reviews) + CS28 Combo Signals (recent Bonus) Details about the indicator  https://www.mql5.com/en/blogs/post/758844 What Does The Next-Generation Strength Indicator Offer? Everything you loved about the originals, now
        Trend Reversal – Your Ally for Identifying Trend Reversals on MT4 Are you looking for a powerful and intuitive tool to enhance your market analysis and make more informed decisions? The Trend Reversal indicator is specifically designed for traders who want to accurately identify trend reversal points directly on the MetaTrader 4 platform. Thanks to its combination of advanced algorithms and proven techniques, Trend Reversal provides clear and visible signals to help you recognize key market mom
        FX Gunslinger
        Oleg Rodin
        5 (1)
        Forex Gunslinger  is a BUY/SELL reversal signals indicator designed around the idea of combining support/resistance, crossovers and oscillators in MTF mode.  When everything is aligned the indicator generates a BUY or SELL signal.   Though the indicator is based around the MTF idea, the algorithm is very stable and generates reliable reversal signals. This is an MTF type indicator where it can use a higher or a lower time frame to calculate the signals for your current chart. Though the original
        MetaBands M4
        Vahidreza Heidar Gholami
        5 (3)
        MetaBands uses powerful and unique algorithms to draw channels and detect trends so that it can provide traders with potential points for entering and exiting trades. It’s a channel indicator plus a powerful trend indicator. It includes different types of channels which can be merged to create new channels simply by using the input parameters. MetaBands uses all types of alerts to notify users about market events. Features Supports most of the channel algorithms Powerful trend detection algorith
        First of all Its worth emphasizing here that this Trading Tool is Non-Repainting Non-Redrawing and Non-Lagging Indicator Which makes it ideal for professional trading . Online course, user manual and demo. The Smart Price Action Concepts Indicator is a very powerful tool for both new and experienced traders . It packs more than 20 useful indicators into one combining advanced trading ideas like Inner Circle Trader Analysis and Smart Money Concepts Trading Strategies . This indicator focuses on
        Scalper Vault
        Oleg Rodin
        5 (27)
        Scalper Vault is a professional scalping system which provides you with everything you need for successful scalping. This indicator is a complete trading system which can be used by forex and binary options traders. The recommended time frame is M5. The system provides you with accurate arrow signals in the direction of the trend. It also provides you with top and bottom signals and Gann market levels. The indicator provides all types of alerts including PUSH notifications. PLEASE CONTACT ME AFT
        Trend Oscillator: Smooth and Reliable Market Trend Identification Trend Oscillator is an advanced MT4 indicator designed to assist traders in accurately identifying trend direction and potential reversal points. With an intuitive visual representation, this indicator clearly shows when the market is in an uptrend or downtrend, simplifying analysis and improving chart readability. It is suitable for a wide range of markets and timeframes, offering great flexibility for diverse trading needs. Key
        FX Levels: Exceptionally Accurate Support & Resistance for All Markets Quick Overview Looking for a reliable way to pinpoint support and resistance levels across any market—currencies, indices, stocks, or commodities? FX Levels merges our traditional “Lighthouse” method with a forward-thinking dynamic approach, offering near-universal accuracy. By drawing from real-world broker experience and automated daily plus real-time updates, FX Levels helps you identify reversal points, set profit targe
        Gold Stuff
        Vasiliy Strukov
        4.86 (247)
        Gold Stuff is a trend indicator designed specifically for gold and can also be used on any financial instrument. The indicator does not redraw and does not lag. Recommended time frame H1. At it indicator work full auto  Expert Advisor EA Gold Stuff. You can find it at my profile. Contact me immediately after the purchase to get   personal bonus!  You can get a free copy of our Strong Support and Trend Scanner indicator, please pm. me! Settings  and manual here   SETTINGS Draw Arrow - on off. dra
        Clever Order Blocks
        Carlos Forero
        5 (2)
        Description Very precise patterns to detect: entry signals as well as breakout, support and resistance reversal patterns. It points out zones in which, with a high probability, institutional orders with the potential to change the price’s direction and keep moving towards it, have been placed.  KEY LINKS:   Indicator Manual  –  How to Install   –  Frequent Questions  -  All Products  How is this indicator useful? It will allow you to trade on the order’s direction, once its direction has been id
        Reversal Master
        Alexey Minkov
        4.92 (13)
        !SPECIAL SALE! The Reversal Master is an indicator for determining the current direction of price movement and reversal points. The indicator will be useful for those who want to see the current market situation better. The indicator can be used as an add-on for ready-made trading systems, or as an independent tool, or to develop your own trading systems. The Reversal Master indicator, to determine the reversal points,  analyzes a lot of conditions since the combined analysis gives a more accura
        Chart Patterns All in One
        Davit Beridze
        4.65 (17)
        Leave a Comment after purchase to get 4 high quality indicators as Bonus. The Chart Patterns All-in-One indicator helps traders visualize various chart patterns commonly used in technical analysis. It supports identifying potential market behaviors, but profitability is not guaranteed. Testing in demo mode is recommended before purchasing. Current Offer : 50% discount on the "Chart Patterns All in One" indicator. Included Patterns : Pattern 1-2-3 : Detects market reversals using three key point
        FX Dynamic: Take Your Market Analysis to the Next Level with Adaptive Precision Quick Overview Looking to sharpen your trading edge? FX Dynamic delivers real-time, adaptive insights into market movements—instantly reacting to every tick of live MetaTrader data. Whether you’re aiming for consistent performance or just want deeper, more reliable signals, FX Dynamic helps you identify key opportunities, refine your entries and exits, and manage risk with greater precision. Get started now and dis
        Order Block Hunter
        Noha Mohamed Fathy Younes Badr
        5 (9)
        Order block hunter indicator is the best indicator for  hunt the order blocks that area where there has been a large concentration of limit orders waiting to be executed Order blocks are identified on a chart by observing previous price action and looking for areas where the price experienced significant movement or sudden changes in direction .This indicator does that for you by using very complicated codes and helps you to take the best areas To buy and sell because it make marks at the best a
        GOLD Impulse with Alert
        Bernhard Schweigert
        4.6 (10)
        This indicator is a super combination of our 2 products  Advanced Currency IMPULSE with ALERT  and  Currency Strength Exotics . It works for all time frames and shows graphically impulse of strength or weakness for the 8 main currencies plus one Symbol! This Indicator is specialized to show currency strength acceleration for any symbols like Gold, Exotic Pairs, Commodities, Indexes or Futures. Is first of its kind, any symbol can be added to the 9th line to show  true currency strength accelerat
        Ultimate Sniper Dashboard
        Hispraise Chinedum Abraham
        4.82 (22)
        Currently on massive July Discount! Prices will increase in the future! Read description below! Once you purchase, send a message to my inbox for manual and starter kit. Best Entry System for Ultimate Sniper Dashboard: ULTIMATE DYNAMIC LEVELS. (Please Check my products) The Ultimate Sniper Dashboard ONLY works on live markets due to MT4 multicurrency testing limits. Introducing the Ultimate-Sniper Dashboard! Our very best which contains both HA-Sniper, MA-Sniper. and many special modes. The Ul
        Key level wedge pro
        Presley Annais Tatenda Meck
        5 (1)
        We have combined all of our beloved indicators the likes of: Key level order block , Key level supply and demand , Key level liquidity grab and Key level wedge into one single indicator and dashboard. Whats new Dashboard : There is an easy access dashboard for all your needs. Multi-timeframe button : There is now a multi-timeframe option for Order Blocks and Supply and demand zones, making it easy to see higher timeframe zones easily on the current timeframe by just clicking the desired timefra
        PRO Renko System
        Oleg Rodin
        5 (26)
        PRO Renko System is a highly accurate trading system specially designed for trading RENKO charts. The ARROWS and Trend Indicators DO NOT REPAINT! The system effectively neutralizes so called market noise giving you access to accurate reversal signals. The indicator is very easy to use and has only one parameter responsible for signal generation. You can easily adapt the tool to any trading instrument of your choice and the size of the renko bar. I am always ready to provide extra support to help
        More from author
        ZigZag Lines MTF for MT5
        Taras Slobodyanik
        5 (10)
        Multi timeframe ZigZag indicator. It displays the support/resistance horizontal lines and their breakouts, as well as draws the current targets of the market. It can also display lines of the Fractals indicator and candles from other periods (up to Quarterly). So, you can actually see the supply and demand levels. You can also use it as indicator for the Break of Structure(BOS) & Market Structure Shift(MSS). The indicator redraws the last (current) point, and in some cases can change the last 2
        Time Scale for MT5
        Taras Slobodyanik
        4.67 (21)
        The indicator draws the time scale on the chart. You can specify the time offset, adjust the size and font to display on the chart ( it is displaying your local time on your chart instead of MT time ). You can also select the desired format for displaying the date and time. You may be interested in my other product , which contains a more advanced version of the Time Scale . Parameters Hours (time shift) — time shift (hours); Minutes (time shift) — time shift (minutes); Show time on mouse — sho
        FREE
        Heikin Ashi Dashboard MT5
        Taras Slobodyanik
        5 (2)
        Multi-currency and multitimeframe Heikin Ashi indicator. Shows the current state of the market. On the scanner panel you can see the direction, strength and number of bars of the current trend. The Consolidation/Reversal candles are also shown using color. You can specify any desired currencies and periods in the parameters. Also, the indicator can send notifications when the trend changes or when reversal and consolidation candles (dojis) appear. By clicking on a cell, this symbol and period wi
        Multicurrency and multi-timeframe indicator Inside Bar (IB). In the parameters, you can specify any desired currencies and timeframes. The panel displays the last found Inside Bar (and Mother Bar) pattern, the current price position and the breakout of the levels of the Mother and Inside Bars. You can set the size and color for bars and text in the cells. The indicator can also send notifications when levels are broken. By clicking on a cell with a period, the specified symbol and period will b
        Magnifier Ruler Crosshair
        Taras Slobodyanik
        5 (2)
        The indicator has three main tools: Magnifier (Zoom chart), Ruler  ( Time and Price scales ),   and Crosshair. You can move it all around with your mouse and customize different formats for  displaying , customize   size and color of each element. The Magnifier (zoom chart) allows you to display candles from any time frame and at different scales. Hotkeys: 'Q' - higher timeframe, 'A' - lower timeframe, 'W' - decrease candle size, 'S' - increase candle size, 'Z' - show/hide zoom chart. You can
        Multicurrency and multitimeframe modification of the Stochastic Oscillator — Stochastic Dashboard . You can specify any desired currencies and timeframes in the parameters. The panel displays the current values and intersections of the lines — Signal and Main (stochastics crossover). Also, the indicator can send notifications when crossing overbought and oversold levels. By clicking on a cell with a period, this symbol and period will be opened. This is MTF Scanner. Similar to the Currency Stre
        Multicurrency and multitimeframe modification of the Stochastic Oscillator — Stochastic Dashboard. You can specify any desired currencies and timeframes in the parameters. The panel displays the current values and intersections of the lines — Signal and Main (stochastics crossover). Also, the indicator can send notifications when crossing overbought and oversold levels. By clicking on a cell with a period, this symbol and period will be opened. This is MTF Scanner. Similar to the Currency Stren
        ZigZag Dashboard for MT4
        Taras Slobodyanik
        4.75 (4)
        Multicurrency and multitimeframe modification of the ZigZag indicator. Displays the current direction of the market, the height of the last movement, the number of bars in this movement and the breaking of the previous point of the ZigZag (horizontal line). This is MTF Scanner, you can actually see the supply and demand levels. You can specify any desired currencies and timeframes in the parameters. Also, the panel can send notifications when the ZigZag changes direction or when there was a br
        ZigZag Dashboard for MT5
        Taras Slobodyanik
        5 (3)
        Multicurrency and multitimeframe modification of the ZigZag indicator. Displays the current direction of the market, the height of the last movement, the number of bars in this movement and the breaking of the previous point of the ZigZag (horizontal line). This is MTF Scanner, you can actually see the supply and demand levels. You can specify any desired currencies and timeframes in the parameters. Also, the panel can send notifications when the ZigZag changes direction or when there was a br
        Fractals Dashboard MT5
        Taras Slobodyanik
        5 (3)
        Multicurrency and multitimeframe modification of the Fractals indicator. Displays the last two fractals — their sequence (and which one is broken), or the distance between them. You can specify any desired currencies and timeframes in the parameters. Also, the panel can send notifications on a fractal's breakout. By clicking on a cell with a period, this symbol and period will be opened. This is MTF Scanner. The key to hide the dashboard from the chart is "D" by default. Parameters Calculation
        ADX Dashboard MT5
        Taras Slobodyanik
        5 (4)
        ADX indicator is used to determine the trend and its strength. The direction of the price is shown by the +DI and -DI values, and the ADX value shows the strength of the trend. If +DI is above -DI, then the market is in an uptrend, if on the contrary, it is a downtrend. If ADX is below 20, then there is no definite direction. As soon as the indicator breaks this level, a medium-strength trend begins. Values above 40 indicate a strong trend (a downtrend or an uptrend). Multicurrency and multiti
        Multicurrency and multitimeframe modification of the Relative Strength Index (RSI) indicator — RSI Dashboard. You can specify any desired currencies and timeframes in the parameters. Also, the panel can send notifications when crossing overbought and oversold levels. By clicking on a cell with a period, this symbol and period will be opened. This is MTF Scanner. The key to hide the dashboard from the chart is "D" by default. Similar to the Currency Strength Meter (CSM) , the Dashboard can autom
        MACD Dashboard
        Taras Slobodyanik
        5 (1)
        Multi-currency and multi-timeframe indicator MACD. The dashboard can display both the Traditional (true) MACD and the MACD which is built into MetaTrader. On the panel you can see the current state of the indicator — the direction of movement of the MACD lines, their intersection and a pop-up window with the indicator chart. In the parameters you can specify any desired pairs-symbols and timeframes. The scanner can also send notifications about lines crossing each other and about lines crossing
        Lines Profit Loss MT5
        Taras Slobodyanik
        4.58 (12)
        The indicator displays profit (loss) on the current symbol. You can freely drag and drop the line to display the current profit or loss. Parameters Calculation in money or in points — calculate the profit/loss in points or money. Add pending orders to calculate — take pending orders into account in calculations. Magic Number (0 - all orders on symbol) — magic number, if it is necessary to evaluate specific orders. Offset for first drawing (points from the average price) — offset of the line fr
        FREE
        The indicator automatically draws the Fibonacci levels based on  ZigZag indicator,  Trading Sessions,  Fractals or Candles (including non-standard timeframes: Year, 6 Months, 4 Months, 3 Months, 2 Months) ( Auto Fibo Retracement ). You can choose any higher time frame for Fibonachi calculation. The levels are redrawn every time the current bar closes. It is possible to enable alerts when crossing the specified levels. You can also analyze levels in history. To do this, it is necessary to specify
        Inside Bar Dashboard
        Taras Slobodyanik
        5 (2)
        Multicurrency and multi-timeframe indicator Inside Bar (IB). In the parameters, you can specify any desired currencies and timeframes. The panel displays the last found Inside Bar (and Mother Bar) pattern, the current price position and the breakout of the levels of the Mother and Inside Bars. You can set the size and color for bars and text in the cells. The indicator can also send notifications when levels are broken. By clicking on a cell with a period, the specified symbol and period will b
        ZigZag Lines MTF
        Taras Slobodyanik
        4.38 (13)
        Multi timeframe ZigZag indicator. It displays the support/resistance horizontal lines and their breakouts, as well as draws the current targets of the market. It can also display lines of the Fractals indicator and candles from other periods (up to Quarterly). So, you can actually see the supply and demand levels. You can also use it as indicator for the Break of Structure(BOS) & Market Structure Shift(MSS). The indicator redraws the last (current) point, and in some cases can change the last 2
        Lines Profit Loss
        Taras Slobodyanik
        4.93 (14)
        The indicator displays profit (loss) on the current symbol. You can freely drag and drop the line to display the current profit or loss. Parameters Calculation in money or in points — calculate the profit/loss in points or money. Add pending orders to calculate — take pending orders into account in calculations. Magic Number (0 - all orders on symbol) — magic number, if it is necessary to evaluate specific orders. Offset for first drawing (points from the average price) — offset of the line fro
        FREE
        MA Dashboard MT5
        Taras Slobodyanik
        5 (4)
        Multicurrency and multitimeframe modification of the indicator Moving Average (MA). On the dashboard you can see the current state of the indicator - breakouts and touches (by price) of the Fast MA and Slow MA, as well as the intersection of the MA lines between each other   (moving average crossover) . In the parameters you can specify any desired currencies and timeframes. Also, the indicator can send notifications about the price touching the lines and about their crossing. By clicking on a
        Multicurrency and multitimeframe modification of the indicator Bollinger Bands. On the dashboard you can see breakouts and touches of the Bollinger Bands. In the parameters you can specify any desired currencies and timeframes. The indicator can also send notifications when the price touches the Bollinger Bands, when the current volatility changes (expands or falls), and when the price touches all the bands. By clicking on a cell with a period, this symbol and period will be opened. This is MTF
        CCI Dashboard for MT5
        Taras Slobodyanik
        5 (1)
        Multicurrency and multitimeframe modification of the Commodity Channel Index (CCI) indicator. You can specify any desired currencies and timeframes in the parameters. Also, the panel can send notifications when crossing overbought and oversold levels. By clicking on a cell with a period, this symbol and period will be opened. This is MTF Scanner. The key to hide the dashboard from the chart is "D" by default. Parameters CCI Period  — averaging period. CCI Applied price  — price type. Clear t
        News Dashboard MT4
        Taras Slobodyanik
        4.43 (7)
        This dashboard displaying current news from ForexFactory.com (calendar FFC) and from the Investing.com website . You can sort news by impact and by country, and display them on the chart with one click. By holding down the 'Ctrl' key, you can select several different 'currencies' or 'impacts' to sort. Also, this utility shows not only the forecast, but also the actual values ​​after they appear on the site. You can set a separate notification for each news. You can read the news using your EA
        Time Scale
        Taras Slobodyanik
        4.83 (12)
        The indicator draws the time scale on the chart. You can specify the time offset, adjust the size and font to display on the chart (it is displaying your local time on your chart instead of MT time). You can also select the desired format for displaying the date and time. While holding down the middle mouse button, and moving the cursor, a slider will appear on the scale. You may be interested in my other product , which contains a more advanced version of the Time Scale. Parameters Hours (time
        FREE
        Symbol Manager for MT5
        Taras Slobodyanik
        5 (3)
        Symbol Manager or Grid Manager, designed to group orders into one position (by Symbol or by Magic Number). This utility will be useful to multi-currency traders (many EAs), who can have multiple orders on several pairs. You will be able to see the total number of lots, the total profit, and set virtual stop loss and virtual take profit. To set a real TP (or SL), you must first set the virtual value, and then enter the command in this cell: "set". If you want to set real TP/SL for all orders at
        Multicurrency and multitimeframe indicator of the Standard Deviation Channel. Displays the current direction of the market. On the panel, you can see breakouts and touches (by price) of the levels of the linear regression channel. In the parameters, you can specify any desired currencies and timeframes. Also, the indicator can send notifications when levels are touched. By clicking on a cell, this symbol and period will be opened. This is MTF Scanner. The key to hide the dashboard from the char
        Heikin Ashi Dashboard
        Taras Slobodyanik
        5 (4)
        Multi-currency and multitimeframe Heikin Ashi indicator. Shows the current state of the market. On the scanner panel you can see the direction, strength and number of bars of the current trend. The Consolidation/Reversal candles are also shown using color. You can specify any desired currencies and periods in the parameters. Also, the indicator can send notifications when the trend changes or when reversal and consolidation candles (dojis) appear. By clicking on a cell, this symbol and period wi
        The indicator shows the High/Low /Open/Close   Levels from other (and non-standard) timeframes - Year, 6 Months, 4 Months, 3 Months, 2 Months, Month, Week, Day, H3-H6-H8-H12 Hours. You can also set the shift for opening candles and build virtual candles. "Period separators" for one of these timeframes is available in the form of vertical lines. Alerts can be configured for breakouts of the current or previous levels (breakout of the HIgh/Low yesterday/last week line etc). You can also shift all
        The indicator has three main tools: Magnifier (Zoom chart), Ruler  ( Time and Price scales ),   and Crosshair. You can move it all around with your mouse and customize different formats for  displaying , customize   size and color of each element. The Magnifier (zoom chart) allows you to display candles from any time frame and at different scales. Hotkeys: 'Q' - higher timeframe, 'A' - lower timeframe, 'W' - decrease candle size, 'S' - increase candle size, 'Z' - show/hide zoom chart. You can
        Multicurrency and multi timeframe modification of the Relative Strength Index (RSI) indicator   — RSI Dashboard . You can specify any desired currencies and timeframes in the parameters. Also, the panel can send notifications when crossing overbought and oversold levels. By clicking on a cell with a period, this symbol and period will be opened. This is MTF Scanner. The key to hide the dashboard from the chart is "D" by default. Similar to the Currency Strength Meter (CSM) , the Dashboard can a
        Multicurrency and multitimeframe indicator of the Standard Deviation Channel. Displays the current direction of the market. On the panel, you can see breakouts and touches (by price) of the levels of the linear regression channel. In the parameters, you can specify any desired currencies and timeframes. Also, the indicator can send notifications when levels are touched. By clicking on a cell, this symbol and period will be opened. This is MTF Scanner. The key to hide the dashboard from the char
        Filter:
        Heiner G.
        520
        Heiner G. 2024.11.07 10:08 
         

        A clear recommendation to buy. The dashboard is great and the fact that you can also integrate the data of a symbol into the active chart is also excellent.

        loginuras
        1005
        loginuras 2024.07.13 23:10 
         

        Awesome!

        danmar
        1712
        danmar 2023.05.30 16:28 
         

        HI, I just bought this indicator after the excellent RSI dashboard Multicurrency and i will try it now.

        the 5 star are because Mr Taras made an update before i buy the product !

        to add the possibility to adjust the number of decimals like my demand for RSI dashboard

        Thanks so much for taking care of what your buyer need

        I will come back after using it

        Thanks again Warmly

        2023 06 08 : with DASHBOARD RSI they are the 2 main that i use; very accurate and for me bring me good information's for my scalping M1 M5; Well done

        2023 07 03 : I ask to add an functionality and this was made so quickly ! definitively Mr Taras has very good products and an real attention to the need of his users

        i really regret to not be able to put 10 stars.

        Well done and thanks so much to make it so so quickly

        You are in the top of the sellers taking care of users ++++++++

        2023 07 05 : It ask for an update (but later) and Taras made it so so so quickly. Thank you so much

        10 stars for user supports , quality, usability, and so on

        2024 04 30 : the 2 dashboard RSI and this one ADX are really efficient, easy to use and param and light in ressources computer, 2 of my most important indicator. well done.

        2024 04 30 : this day i ask for a change of display and the same day Taras made an update, it save me half width of the dashboard on a very big screen. Thank you a lot and difficil to make better. Very Very well done.

        daje
        81
        daje 2022.07.28 10:26 
         

        good stable indicator does what it says very well. Could alerts be settable to exclude trendless signals plse.

        Exclude notifications alerts from crosses in the 'trendless ' zone (below 20 for example).

        Taras Slobodyanik
        74359
        Reply from developer Taras Slobodyanik 2022.07.28 10:39
        Hello.
        What do you mean? The indicator already has parameters: Strong trend level is crossed Up — alert when ADX crosses the level of a strong trend up.
        Strong trend level is crossed Down — alert when ADX crosses the level of a strong trend down.
        Middle trend level is crossed Up — alert when the level of the middle trend is crossed upwards.
        Middle trend level is crossed Down — alert when the level of the middle trend is crossed downwards.
        jgooi777
        229
        jgooi777 2021.12.28 03:54 
         

        useful tool, and it's cool! get it if you are using ADX to trade. It's very well coded as well! Thank you Taras!

        aworex
        1807
        aworex 2021.11.28 13:50 
         

        Nice indicator just like the other dashboards by this developer, would be nice if he can also include a feature to show ADX overbought/oversold so we know when the ADX is decreasing in either direction

        Taras Slobodyanik
        74359
        Reply from developer Taras Slobodyanik 2021.11.28 14:06
        Hello. It's not clear what kind of overbought/oversold are you talking about? The dashboard already has the parameters "level of a strong trend" and "level of the middle trend". And the colour of the cells shows the direction.
        Devonish
        3140
        Devonish 2021.11.09 22:16 
         

        User didn't leave any comment to the rating

        Reply to review
        Version 3.80 2024.12.03
        1) Fixed a bug in calculating cell height.
        Version 3.70 2024.05.06
        1) The alert parameters “+DI crosses level X” and “-DI crosses level X” were split into up and down directions.
        Version 3.60 2024.05.03
        1) The option “Middle and/or Strong” has been added to the “All timeframes in the same Trend zone” alert. That is, for the alert, all cells must be in the Middle and/or Strong trend zone.
        Version 3.50 2024.04.30
        1) Changed the calculation of cell width in the dashboard.
        Version 3.40 2024.04.16
        1) Added color parameters for highlighting the text of +DI and -DI values - “Highlight the +DI value when line is increasing” and “Highlight the -DI value when line is increasing”.
        Version 3.30 2024.04.06
        1) Added parameter: "ADX changes direction".
        Version 3.20 2024.04.03
        1) Added parameters: "DI+ changes direction", "DI- changes direction", DI+ crosses level X (0-off)", "DI- crosses level X (0-off)".
        Version 3.10 2024.03.13
        1) Changed the behavior of setting the timer at startup. Now the indicator tries to start the timer again when a new tick arrives. If there is no tick for a long time (or it’s a weekend), you can click on the button on the chart and restart the timer yourself.
        Version 3.0 2023.11.11
        1) Added automatic shifting of the dashboard to the foreground.
        Version 2.90 2023.10.15
        1) The "Y-offset (pix, +/-)" parameter can now be negative.
        2) Changed the behavior of the pop-up chart when the window is small.
        Version 2.80 2023.09.03
        1) Added "Hotkey to enable/disable the Popup chart" parameter for "Popup chart".
        2) Added "Y-offset (pix)" parameter for "Popup chart".
        Version 2.70 2023.08.28
        1) Added a Dashboard recovery check when running multiple copies on the same chart.
        Version 2.60 2023.08.25
        1) Returned the deletion of the dashboard from the chart at startup.
        Version 2.40 2023.07.29
        1) Added a hotkey to hide the dashboard, by default "D".
        2) The condition of the list of pairs for the second parameter has been changed. Pairs in the second parameter must be typed only with a semicolon and must be in exact case. "Pairs (separated ONLY by a semicolon and have exact letter case)"
        Version 2.30 2023.07.20
        1) The condition of the list of pairs for the second parameter has been changed. Pairs in the second parameter must be typed only with a semicolon and must be in exact case. "Pairs (separated ONLY by a semicolon and have exact letter case)"
        2) Added parameter "Enable text tooltip in the table".
        Version 2.20 2023.07.18
        1) Added "Popup chart" parameters. Now, when you hover the mouse over the cells, you can see a pop-up chart from this timeframe.
        2) Fixed some minor bugs.
        Version 2.10 2023.07.03
        1) Added "Color scheme" parameter.
        2) Changed the color scheme.
        Version 2.0 2023.07.01
        1) Added parameters "ADX for One Currency" and "Swap +DI -DI values". The dashboard will automatically select pairs containing the specified Currency or those pairs that have this Currency as the base. The indicator will also calculate the ADX for this Currency on a separate line.
        2) Alert bug for "All timeframes in the same Trend zone" has been fixed.
        Version 1.90 2023.06.07
        1) Added the ability to enable/disable alerts for each Symbol when clicking on the name of the Pair. If no Pair is selected then alerts are enabled for all Symbols.
        Version 1.80 2023.05.30
        1) Added parameter "Decimal places for ADX values".
        Version 1.60 2022.06.07
        1) Added "Refresh cells only on new bar" parameter.
        Version 1.50 2022.05.12
        1) Added tooltips showing current trend strength and current ADX direction.
        Version 1.40 2022.04.13
        1) Added a parameter to highlight the current Pair and TF. (Highlight the current Pair and TF).
        2) Added tooltip with current values.
        Version 1.30 2022.01.17
        1) Added an alert when all timeframes are in the same trend zone - "All timeframes in the same Trend zone".
        Version 1.20 2021.11.29
        1) Fixed a bug with an empty line at the end of the table.
        Version 1.10 2021.11.29
        1) Added parameter: "Color Highlight the ADX value when line is increasing".