• Overview
  • Reviews
  • Comments

Volume Weighted Average Price Crossover VWAP

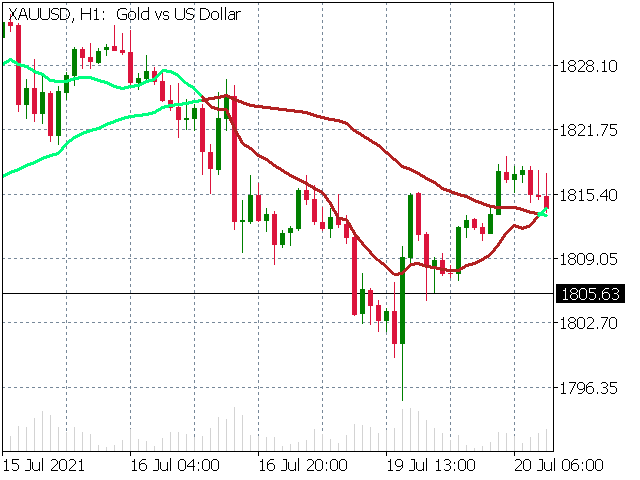
This is a crossover using two Volume Weighted Average Price (VWAP) lines. VWAP is calculating the sum of price multiplied by volume, divided by total volume. the average is then a simple moving average of the average price over the given period. This indicator can be used as a dual baseline, or as a crossover on different lengths.

It can change on the crossover or if the price is above/below the lines.

Use the crossover as signals for entering a trade in the long or short direction.

Parameters:

Parameter  Default value  Options 
Fast period   10  Any number of bars
Fast Price   Close  The price to use for calculation of the volume weighed average price
Slow period   25  Any number of bars
Slow Price   Close  The price to use for calculation of the volume weighed average price
Visual colour of moving average   Change colour on Crossover    Change colour on crossover
 Change colour if price is above/below VWAP line(s)
 Keep same color all the time

For crossover type trades:

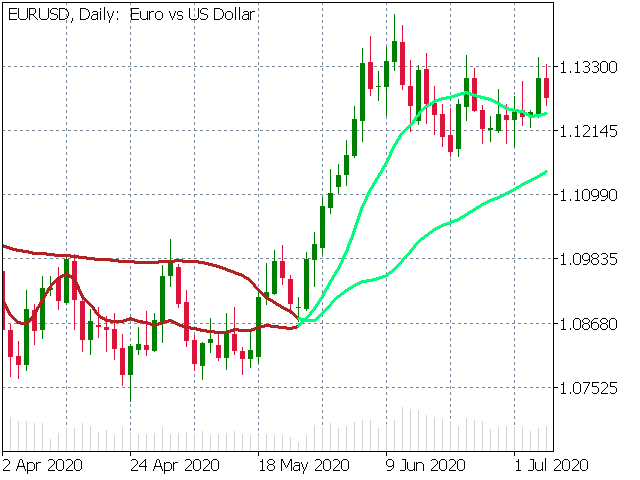
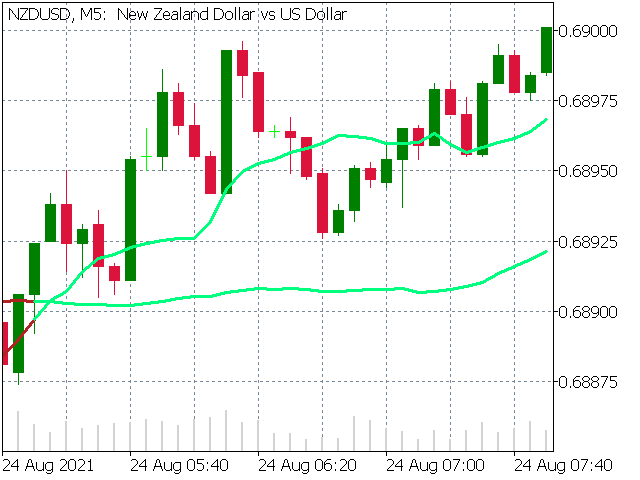
When the fast VWAP crosses above the slow VWAP, look for buy entries. (Both MA should be green)

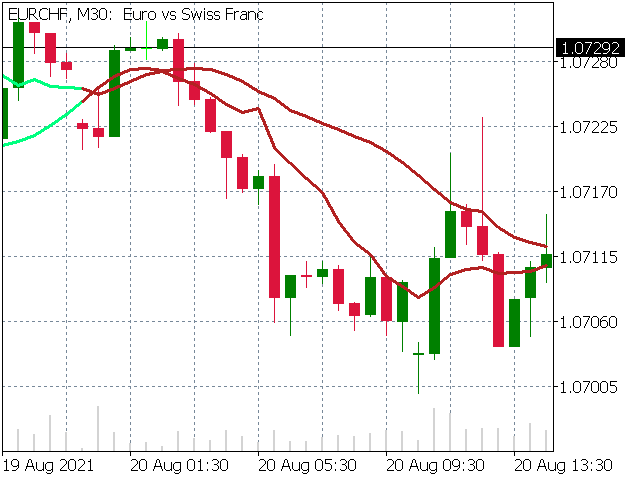
When the fast VWAP crosses below the slow VWAP, look for sell entries. (Both MA should be red)

For price above/below VWAP Lines:

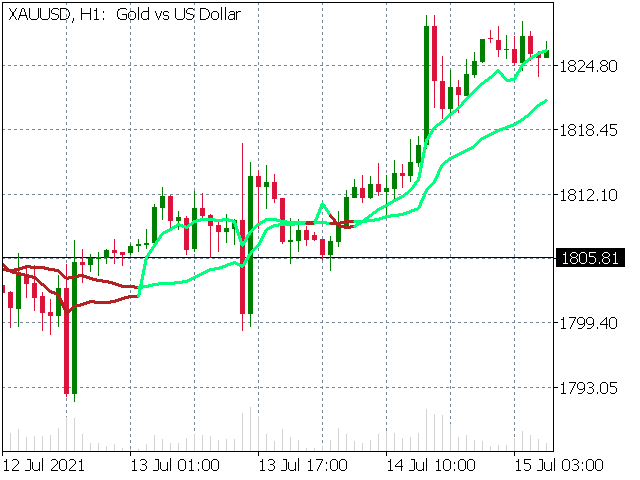
Look for change of color of the VWAP lines. Green for buy/long trades, and red for sell/short trades. Note that due to the nature of VWAP, it can cross often on low average value/bar count for calculating the average.

The indicator can also be used to show the current trend direction, by looking at the color of the both the VWAP lines.


Recommended products
Segmented Volume MT5
Eduardo Da Costa Custodio Santos
The Segmented Volume MT5 indicator was created to facilitate those who trade using price and volume analysis, VSA, VPA, Wyckoff Method and Smart Money System . Segmented volume works on any Market ( Crypto, CFD, Forex, Futures, Stocks... ) and works on any Chart time. See how easy your interpretation is: #Green: Volume much higher than the market average #Dark pink: Larger than average volume #Blue: Positive normal volume #Red: Negative normal volume #Pink: Low volume #Yellow: Ultra Low Volume T
Do you use volume in your reading of the market? Certainly many traders use it, and do not imagine operating without it. The Color Histogram Volume Set indicator allows the user to choose the value that he considers interesting to monitor. When you pass this you will have visual confirmation and if you want you will also have the audible alert that is given by the indicator. Of course, there are other ways to try to find a high volume, such as assessing whether the volume
Weis Waves
Flavio Javier Jarabeck
3.15 (26)
The original author is David Weis, an expert in the Wyckoff Method. The Weis Wave is a modern adaptation of the 1930's Wyckoff Method, another expert in Tape Reading techniques and Chart Analysis. Weis Waves takes market volume and stacks it into waves according to price conditions giving the trader valuable insights about the market conditions. If you want to learn more about this subject you can find tons of videos in YouTube. Just look for "The Wickoff Method", "Weis Wave" and "Volume Spread
FREE
Value Chart Candlesticks
Flavio Javier Jarabeck
4.67 (9)
The idea of a Value Chart indicator was presented in the very good book I read back in 2020 , " Dynamic Trading Indicators: Winning with Value Charts and Price Action Profile ", from the authors Mark Helweg and David Stendahl. The idea is simple and the result is pure genius: Present candlestick Price analysis in a detrended way! HOW TO READ THIS INDICATOR Look for Overbought and Oversold levels. Of course, you will need to test the settings a lot to find the "correct" one for your approach.
FREE
Balance Aggression
Edson Cavalca Junior
The indicator measures the balance of aggression. The formula is as follows:   Aggression  = Purchase Volume - Sales Volume. Note : It is rec ommended to use the default configuration and VPS values. It does not work in Forex. Meet Our Products     Parameters : Numbers of days prior to the current one for calculation; Volume Divider e; Enables calculation of the current candle; Histogram Line style and; Size; Line Line style and; Size;  Follow us on our website to check the next new
ADX consolidado
OTAVIO AGUIAR CAMPOS Aguiar
4.75 (4)
Mostra a média móvel quando ADX > 20 e pinta de verde ou vermelho quando os valores de ADX estão subindo indicando tendência. Quando o ADX é menor que 20 indica movimento lateral consolidado. O indicador não define pontos de entrada, somente mostra a média colorida quando a tendência está se fortalecendo. Faz parte do grupo de indicadores do Indicador Tavim.
FREE
This indicator anticipates price reversals analyzing bullish and bearish pressure in the market. The buying pressure is the sum of all the accumulation bars over a certain number of days, multiplied by the volume. The selling pressure is the sum of all of the distribution over the same number of bars, multiplied by the volume. [ Installation Guide | Update Guide | Troubleshooting | FAQ | All Products ] The indicator ratio gives you a measure of the buying pressure as a percentage of the total ac
WAPV Weis Wave Chart Forex
Eduardo Da Costa Custodio Santos
The Weis Wave Chart Forex for MT5 is a Price and Volume indicator. The Price and Volume reading was widely disseminated through Richard Demille Wyckoff based on the three laws created by him: Supply and Demand, Cause and Effect and Effort vs. Result. In 1900 R.Wyckoff already used the wave chart in his analyses. Many years later, around 1990, David Weis Automated R. Wyckoff's wave chart and today we bring you the evolution of David Weis' wave chart. It shows the amount of Volume and the amount o
The VWAP indicator is our version of the popular Volume-Weighted Average Price indicator. The VWAP is the ratio between the value traded (price multiplied by the number of volume traded) and the total volume traded over a specific time period. As a result, it measures the average price of the instrument much better than the simple moving average. Although there are many ways to use the VWAP, most investors use it to calculate the daily average.  The indicator works in five modes: Moving  - In
Cybertrade Double Bollinger Bands - MT5  The Bollinger Bands indicator shows the levels of different highs and lows that a security price has reached in a given duration and also their relative strength, where the highs are close to the upper line and the lows are close to the lower line. Our differential is to present this indicator in a double form, with the availability of its values ​​to simplify automation. It works on periods longer than the period visible on the chart. All values ​​are
FREE
White Weis Volume Ticks
Ricardo Almeida Branco
5 (3)
White Weis Volume This indicator shows the sum of the volume in each wave, bulish or bearish, as idealized by David Weis , but it brings an important addition , which is the marking of the bar with the highest volume of the wave (White Bar)! In coding the indicator, it was sought to optimize the code to require minimal processing during use and not to overload mt5. The indicator can be used for pre-trading analysis and study, where the trader analyzes possible points of support and resi
WAPV Weis Wave Chart MT5
Eduardo Da Costa Custodio Santos
The Weis Wave Chart for MT5 is a Price and Volume indicator. The Price and Volume reading was widely disseminated through Richard Demille Wyckoff based on the three laws created by him: Supply and Demand, Cause and Effect and Effort vs. Result. In 1900 R.Wyckoff already used the wave chart in his analyses. Many years later, around 1990, David Weis Automated R. Wyckoff's wave chart and today we bring you the evolution of David Weis' wave chart. It shows the amount of Volume and the amount of pips
Wapv Price and volume
Eduardo Da Costa Custodio Santos
The WAPV Price and Volume Indicator for MT5 is part of the ( Wyckoff Academy Wave Market ) and (Wyckoff Academy Price and Volume) toolset. The WAPV Price and Volume Indicator for MT5 was created to make it easy to visualize the volume movement on the chart in an intuitive way. With it you can observe the moments of peak volume and moments when the market has no professional interest Identify moments when the market is moving by inertia and not by movement of "smart money". It consists of 4 color
The Volume+ and VSA Signals indicator for MT5 is based on the Volume Spread Analysis (VSA) methodology to provide the signals. The signals are displayed at closing of bars on the main window or subwindow in the form of symbols. The symbols are not repainting.  The indicator produces a signal on an individual bar and this signal is not buy or sell signal. When a minor trend goes in the opposite direction of a major trend, there are sequences of major trend-following signals that give a higher pro
Wave Box Market Frenquency
Jean Jacques Huve Ribeiro
4.83 (6)
Totally linked to the result of a movement and the duration he had. Its height records how many ticks the asset walked during a given movement, its width shows us the duration that movement had. Its configuration must be in line with the Weis Wave Indicator configuration to observe the movement force and can indicate a possible accumulation or distribution of the movement;
FREE
Tabajara V5
Flavio Javier Jarabeck
4.87 (38)
Metatrader 5 version of the famous Andre Machado's Tabajara indicator. If you don't know Andre Machado's Technical Analysis work you don't need this indicator... For those who need it and for those several friend traders who asked this porting from other platforms, here it is... FEATURES 8-period Moving Average 20-period Moving Average 50-period Moving Average 200-period Moving Average Colored candles according to the inflexion of the 20-period MA SETTINGS You can change the Period of all M
FREE
The Volume Spread Analysis indicator is based on the original Volume Spread Analysis method. It was designed for quick and easy recognition of VSA patterns. Even though this indicator looks very simple, it is the most sophisticated tool we've ever made. It is a really powerful analytical tool that generates very reliable trading signals. Because it is very user-friendly and understandable, it is suitable for every type of trader, regardless of his experience. What is VSA? VSA - Volume Spread
Mean Volume indicator for MT5
Renaud Herve Francois Candel
Mean Volume Most indicators are based on price analysis. This indicator is based on volume. Volume is overlooked piece of information in most trading systems. And this is a big mistake since volume gives important information about market participants. Mean Volume is an indicator that can be used to spot when volume is above average. It usually means that institutional traders are active. Peak in volume can be used to confirm an entry since increased volume can sustain the move in one or
Reverse side scalper is the manual trading system, that works on choppy(anti-trend) market. As a rule markets are on 80% choppy and only 20% is trend phase. System is based on custom step Moving and RSI and reverse pattern. System defines up movement, down movement, trend / choppy phases. Indicator plots Buy signal arrow when current direction is down and phase is trend, Sell signal arrow is plotted when currently is up movement and phase is trend. As a rule it allows to "catch" local maximum/mi
Heiken Ashi Smoothed Strategy is a very simple but powerful system to get forex market trend direction. This indicator is actually 2 indicators in 1 pack, Heiken Ashi and Heiken Ashi Smoothed Moving Average both included. Because HA (Heiken Ashi) and HAS (Heiken Ashi Smoothed) are calculated in the same one system event with necessary buffers and loop only, so it is the FAST, OPTIMIZED and EFFICIENT HA having the combined indicator of MetaTrader 5. You can choose to display HA and HAS in the sam
Mini Chart Indicators
Flavio Javier Jarabeck
The Metatrader 5 has a hidden jewel called Chart Object, mostly unknown to the common users and hidden in a sub-menu within the platform. Called Mini Chart, this object is a miniature instance of a big/normal chart that could be added/attached to any normal chart, this way the Mini Chart will be bound to the main Chart in a very minimalist way saving a precious amount of real state on your screen. If you don't know the Mini Chart, give it a try - see the video and screenshots below. This is a gr
Volumes Direction MT5
William Oswaldo Mayorga Urduy
VOLUMES DIRECTION MT5 Normally the volume indicator has a default color change when the current volume is higher than the previous one, it is important but not very useful. For this reason, this indicator was created that in addition to the normal volume, when the candle is bullish or bearish, it paints them a different color, by default is blue for bullish and red for bearish, but these colors can be customized to the Trader's taste . Don't forget to check out my other indicators tha
VWAP Simple
Deibson Carvalho
4.03 (33)
The Volume Weighted Average Price is similar to a moving average, except volume is included to weight the average price over a period.    Volume-Weighted Average Price [VWAP] is a dynamic, weighted average designed to more accurately reflect  a security’s true average price over a given period . Mathematically, VWAP is the summation of money (i.e., Volume x Price) transacted divided by the total volume over any time horizon, typically from market open to market close. VWAP reflects the capital
FREE
MIDAS Super VWAP
Flavio Javier Jarabeck
4.29 (14)
Imagine VWAP, MVWAP and MIDAS in one place... Well, you found it! Now you can track the movement of Big Players in various ways, as they in general pursue the benchmarks related to this measuring, gauging if they had good execution or poor execution on their orders. Traders and analysts use the VWAP to eliminate the noise that occurs throughout the day, so they can measure what prices buyers and sellers are really trading. VWAP gives traders insight into how a stock trades for that day and deter
FREE
The Accumulation / Distribution is an indicator which was essentially designed to measure underlying supply and demand. It accomplishes this by trying to determine whether traders are actually accumulating (buying) or distributing (selling). This indicator should be more accurate than other default MT5 AD indicator for measuring buy/sell pressure by volume, identifying trend change through divergence and calculating Accumulation/Distribution (A/D) level. Application: - Buy/sell pressure: above
Mr Big MT5
Pavel Verveyko
The indicator shows and highlights the chart candles, which are formed as a result of large players entering the market in large volumes. Such candles can also be formed after achieving a certainty on the market, when most of the participants hold positions in the same direction. The movement is likely to continue in that direction after such candles. The indicator highlights the significant candles from the existing ones on the chart; The indicator allows identifying the trends based on candles
WAPV Box Effort x Result
Eduardo Da Costa Custodio Santos
WA_PV_BOX_EFFORT X RESULT for MT5 The WAPV Box Effort x Result Indicator is part of the Package Indicators group (Wyckoff Academy Wave Market). The WAPV Box Effort x Result Indicator for MT5 helps you in reading price and volume. Its reading consists of assisting in the identification of effort x result in waves created by the graph. The WAPV Box Effort x Result Indicator for MT5 when the box is green means that the volume is in favor of the demand and when the box is red volume is in favor of s
KT Double Top Bottom MT5
KEENBASE SOFTWARE SOLUTIONS
The double top bottom pattern is arguably one of the technical analysis's most popular chart patterns. These patterns are used to capitalize on recurring patterns and identify trend reversal patterns, thereby creating well-placed entry and exit levels. The KT Double Top Bottom is based on these patterns and fine-tunes the trade signal development process for traders. Features It's based on one of the most reliable trading patterns and brings some fine-tuning and automation to the process. A
This indicator will show you the TP and SL Values (in that currency) that you already set  for every orders on the charts  ( closed to the transaction/order line)  that will help you a lot to estimated your profit and loss for every order.    And it also show you the PIPs values too.  the shown format  is      " Currency Values of our Profit or Loss /  PIPs values ".    The TP Value will be shown in Green Color and  the SL Value  will be shown in Red Color.  For any question or more information,
The Volume Weighted ATR indicator is a helpful tool for measuring market activity. It is based on the idea of the Volume-Weighted ATR. Combining these two elements helps identify potential turning points or breakout opportunities. The indicator for the classification of the activity of the market uses the moving average and its multiples. Accordingly, where the VWATR bar is located (relative to the moving average), it is labelled as ultra-low, low, average, high, very high or ultra high. The Vo
FREE
Buyers of this product also purchase
Atomic Analyst MT5
Issam Kassas
3.64 (11)
First of all Its worth emphasizing here that this Trading Indicator is   Non-Repainting ,   Non-Redrawing   and   Non-Lagging   Indicator, Which makes it ideal from both manual and robot trading.  The Atomic Analyst  is a PA Price Action Indicator that uses Strength and Momentum of the price to find a better edge in the market. Equipped with an AI filter which help remove noises and false signals, and Increase Trading Potential. Using Multiple layers of complex Indicators, the Atomic Analyst
First of all Its worth emphasizing here that this Trading System is Non-Repainting , Non-Redrawing and Non-Lagging Indicator , Which makes it ideal from both manual and robot trading .  The Smart Trend Trading System MT5 is a comprehensive trading solution tailored for new and experienced traders . It combines over 10 premium indicators and features more than 7 robust trading strategies , making it a versatile choice for diverse market conditions . Trend Following Strategy : Provides precise ent
Quantum Trend Sniper
Bogdan Ion Puscasu
5 (37)
Introducing   Quantum Trend Sniper Indicator , the groundbreaking MQL5 Indicator that's transforming the way you identify and trade trend reversals! Developed by a team of experienced traders with trading experience of over 13 years,   Quantum Trend Sniper Indicator   is designed to propel your trading journey to new heights with its innovative way of identifying trend reversals with extremely high accuracy. ***Buy Quantum Trend Sniper Indicator and you could get Quantum Breakout Indicator fo
Trend Screener Pro MT5
STE S.S.COMPANY
4.89 (61)
Unlock the Power of  Trends trading with Trend Screener Indicator: Your Ultimate Trend Trading Solution powered by fuzzy logic and Multi-currencies System ! Elevate your trend trading with Trend Screener, the revolutionary trend indicator powered by   fuzzy logic.  It is a powerful trend-following indicator that combines over  13 premium tools and features and 3 trading strategies  , making it a versatile choice to   make your Metatrader a Trend Analyzer. LIMITED TIME OFFER : Trend Screener Indi
FX Volume MT5
Daniel Stein
4.94 (17)
Visit our all-new   Stein Investments Welcome Page   to get the latest information, updates and trading strategies. FX Volume is the FIRST and ONLY volume indicator that provides a REAL insight into the market sentiment from a broker's point of view. It provides awesome insights into how institutional market participants, like brokers, are positioned in the Forex market, much faster than COT reports. Seeing this information directly on your chart is the real game-changer and breakthrough solut
FX Power MT5 NG
Daniel Stein
5 (4)
Trading GOLD, and currencies, with the dog walk strategy  - super smart Trading GOLD, and currencies, with the breakout strategy  - super easy Visit our all-new   Stein Investments Welcome Page   to get the latest information, updates and trading strategies. FX Power MT5 NG  is the next generation of our long-time very popular currency strength meter, FX Power.  And what does this next-generation strength meter offer? Everything you have loved about the original FX Power  PLUS GOLD/XAU st
First of all Its worth emphasizing here that this Trading Tool is Non Repainting , Non Redrawing and Non Lagging Indicator , Which makes it ideal for professional trading . The Smart Price Action Concepts Indicator is a very powerful tool for both new and experienced traders . It packs more than 20 useful indicators into one , combining advanced trading ideas like Inner Circle Trader Analysis and Smart Money Concepts Trading Strategies . This indicator focuses on Smart Money Concepts , prov
Advanced Supply Demand MT5
Bernhard Schweigert
4.53 (15)
Best Solution for any Newbie or Expert Trader! This indicator is a unique, high quality and affordable trading tool because we have incorporated a number of proprietary features and a new formula. With this update, you will be able to show double timeframe zones. You will not only be able to show a higher TF but to show both, the chart TF, PLUS the higher TF: SHOWING NESTED ZONES. All Supply Demand traders will love it. :) Important Information Revealed Maximize the potential of Advanced Suppl
RelicusRoad Pro MT5
Relicus LLC
4.81 (21)
How many times have you bought a trading indicator with great back-tests, live account performance proof with fantastic numbers and stats all over the place but after using it, you end up blowing your account? You shouldn't trust a signal by itself, you need to know why it appeared in the first place, and that's what RelicusRoad Pro does best! NOW $147 (increasing to $499 after a few updates) - UNLIMITED ACCOUNTS (PCs or MACs) **  User Manual + Strategies + Training Videos + Private Group with
XQ Indicator MetaTrader 5
Marzena Maria Szmit
5 (1)
Step into the realm of Forex trading with confidence and precision using XQ, a cutting-edge Forex indicator designed to elevate your trading game to unprecedented heights. Whether you're a seasoned trader or just stepping into the world of currency exchange, XQ Forex Indicator empowers you with the insights and signals needed to make informed trading decisions. The signal conditions are a combination of three indicators, and XQ Forex Indicator only display  medium and long-term trends . The ind
Volume by Price MT5
Brian Collard
5 (3)
The Volume by Price Indicator for MetaTrader 5 features Volume Profile and Market Profile TPO (Time Price Opportunity). Get valuable insights out of currencies, equities and commodities data. Gain an edge trading financial markets. Volume and TPO histogram bar and line charts. Volume Footprint charts. TPO letter and block marker charts including split structures. Versatile segmentation and compositing methods. Static, dynamic and flexible ranges with relative and/or absolute visualizations. Lay
Introducing   Quantum Breakout PRO , the groundbreaking MQL5 Indicator that's transforming the way you trade Breakout Zones! Developed by a team of experienced traders with trading experience of over 13 years,   Quantum Breakout PRO   is designed to propel your trading journey to new heights with its innovative and dynamic breakout zone strategy. Quantum Breakout Indicator will give you signal arrows on breakout zones with 5 profit target zones and stop loss suggestion based on the breako
Top indicator for MT5   providing accurate signals to enter a trade without repainting! It can be applied to any financial assets:   forex, cryptocurrencies, metals, stocks, indices .  Watch  the video  (6:22) with an example of processing only one signal that paid off the indicator! MT4 version is here It will provide pretty accurate trading signals and tell you when it's best to open a trade and close it. Most traders improve their trading results during the first trading week with the help of
ICT, SMC, SMART MONEY CONCEPTS, SMART MONEY, Smart Money Concept, Support and Resistance, Trend Analysis, Price Action, Market Structure, Order Blocks, BOS/CHoCH,   Breaker Blocks ,  Momentum Shift,   Supply&Demand Zone/Order Blocks , Strong Imbalance,   HH/LL/HL/LH,    Fair Value Gap, FVG, Inversion FVG, IFVG,  Premium  &   Discount   Zones, Fibonacci Retracement, OTE, Buy Side Liquidity, Sell Side Liquidity, BSL/SSL Taken, Equal Highs & Lows, MTF Dashboard, Multiple Time Frame, BigBar, HTF OB
AW Trend Predictor MT5
AW Trading Software Limited
4.76 (54)
The combination of trend and breakdown levels in one system. An advanced indicator algorithm filters market noise, determines the trend, entry points, as well as possible exit levels. Indicator signals are recorded in a statistical module, which allows you to select the most suitable tools, showing the effectiveness of the signal history. The indicator calculates Take Profit and Stop Loss marks. Manual and instruction ->  HERE  / MT4 version ->  HERE How to trade with the indicator:  Trading wit
Auto Order Block with break of structure based on ICT and Smart Money Concepts Futures Break of Structure ( BoS )             Order block ( OB )            Higher time frame Order block / Point of Interest ( POI )    shown on current chart           Fair value Gap ( FVG ) / Imbalance   ,  MTF      ( Multi Time Frame )    Volume Imbalance     ,  MTF          vIMB Gap’s Equal High / Low’s     ,  MTF             EQH / EQL Liquidity               Current Day High / Low           HOD /
Blahtech Supply Demand MT5
Blahtech Limited
4.57 (14)
Was: $299  Now: $99   Supply Demand uses previous price action to identify potential imbalances between buyers and sellers. The key is to identify the better odds zones, not just the untouched ones. Blahtech Supply Demand indicator delivers functionality previously unavailable on any trading platform. This 4-in-1 indicator not only highlights the higher probability zones using a multi-criteria strength engine, but also combines it with multi-timeframe trend analysis, previously confirmed swings
Gann Squares Indicator: Analyzing Markets with Geometric Patterns The Gann Squares indicator is a powerful tool for market analysis that draws upon the mathematical concepts introduced by W.D. Gann in his article on "Mathematical Formula for Market Predictions." This indicator incorporates Gann's techniques involving square numbers such as 144, 90, and 52, as well as the Square of 9. Additionally, it incorporates  method for utilizing the Square of 9 in conjunction with channels and the star pa
TrendMaestro5
Stefano Frisetti
note: this indicator is for METATRADER4, if you want the version for METATRADER5 this is the link:  https://www.mql5.com/it/market/product/108106 TRENDMAESTRO recognizes a new TREND in the bud, he never makes mistakes. The certainty of identifying a new TREND is priceless. DESCRIPTION TRENDMAESTRO identifies a new TREND in the bud, this indicator examines the volatility, volumes and momentum to identify the moment in which there is an explosion of one or more of these data and therefore the mome
Profit from market structure changes as price reverses and pulls back. The market structure reversal alert indicator identifies when a trend or price move is approaching exhaustion and ready to reverse. It alerts you to changes in market structure which typically occur when a reversal or major pullback are about to happen. The indicator identifies breakouts and price momentum initially, every time a new high or low is formed near a possible exhaustion point. The indicator draws in a rectangle on
Trend Line Map Pro MT5
STE S.S.COMPANY
4.67 (9)
Trend Line Map indicator is an addons for   Trend Screener Indicator . It's working as a scanner for all signals generated by Trend screener ( Trend Line Signals ) . It's a Trend Line Scanner based on Trend Screener Indicator.  If you don't have Trend Screener Pro Indicator,   the Trend Line Map Pro will not work.     LIMITED TIME OFFER : Trend Line Map Indicator is available for only 50 $ and lifetime. ( Original price 125$ ) By accessing to our MQL5 Blog,  you can find all our premium indica
TrendLine PRO MT5
Evgenii Aksenov
4.78 (49)
The Trend Line PRO indicator is an independent trading strategy. It shows the trend change, the entry point to the transaction, as well as automatically calculates three levels of Take Profit and Stop Loss protection Trend Line PRO is perfect for all Meta Trader symbols: currencies, metals, cryptocurrencies, stocks and indices Advantages of Trend Line PRO Never redraws its signals The possibility of using it as an independent strategy It has three automatic levels Take Profit and Stop Loss lev
Owl Smart Levels MT5
Sergey Ermolov
4.47 (36)
MT4 version  |   FAQ The Owl Smart Levels Indicator is a complete trading system within the one indicator that includes such popular market analysis tools as Bill Williams' advanced fractals , Valable ZigZag which builds the correct wave structure of the market, and Fibonacci levels which mark the exact levels of entry into the market and places to take profits. Detailed description of the strategy Instructions for working with the indicator Advisor-assistant in trading Owl Helper Private User
TPSproTREND PrO MT5
Roman Podpora
5 (5)
TPSpro TRENDPRO  - is a trend indicator that automatically analyzes the market and provides information about the trend and each of its changes, as well as giving signals for entering trades without redrawing! The indicator uses each candle, analyzing them separately. referring to different impulses - up or down impulse. Exact entry points into transactions for currencies, crypto, metals, stocks, indices!  -  Version MT4                  DETAILED DESCRIPTION        /       TRADING SETUPS       
Gartley Hunter Multi
Siarhei Vashchylka
5 (5)
Gartley Hunter Multi - An indicator for searching for harmonic patterns simultaneously on dozens of trading instruments and on all classic timeframes: (m1, m5, m15, m30, H1, H4, D1, Wk, Mn). Manual (Be sure to read before purchasing) | Version for MT4 Advantages 1. Patterns: Gartley, Butterfly, Shark, Crab. Bat, Alternate Bat, Deep Crab, Cypher 2. Simultaneous search for patterns on dozens of trading instruments and on all classic timeframes 3. Search for patterns of all possible sizes. Fr
Was: $249  Now: $99   Market Profile defines a number of day types that can help the trader to determine market behaviour. A key feature is the Value Area, representing the range of price action where 70% of trading took place. Understanding the Value Area can give traders valuable insight into market direction and establish the higher odds trade. It is an excellent addition to any system you may be using. Inspired by Jim Dalton’s book “Mind Over Markets”, this indicator is designed to suit the
Black Dragon indicator mt5
Ramil Minniakhmetov
4.82 (56)
The trend detection indicator will compliment any strategy and can also be used as an independent tool. IMPORTANT! Contact me immediately after the purchase to get instructions and a bonus!  Benefits  Easy to use; does not overload the graphic wih unnecessary information. The ability to use as filter for any strategy. Contains bult -in dynamic levels of cupport and resistange,  which can be used both, for profit taking, and for settings up stop-losses. The indicator does not change color after t
Golden Spikes Detector
Batsirayi L Marango
5 (1)
Golden Spikes Detector This indicator is based on an advanced strategy primarily for trading spikes on Boom and Crash Indices. Complex algorithms were implemented to detect high probability entries only. It alerts on potential Buy and Sell entries. To trade spikes on the Deriv or Binary broker, only take Buy Boom and Sell Cash alerts. It was optimised to be loaded on 5-minute timeframe although multiple timeframe analysis is done in the background. Features ·             Desktop pop up and sound
Matrix Arrow Indicator MT5
Juvenille Emperor Limited
5 (14)
Matrix Arrow Indicator MT5  is a unique 10 in 1 trend following   100% non-repainting  multi-timeframe indicator that can be used on all symbols/instruments:   forex,   commodities,   cryptocurrencies,   indices,   stocks .  Matrix Arrow Indicator MT5  will determine the current trend at its early stages, gathering information and data from up to 10 standard indicators, which are: Average Directional Movement Index (ADX) Commodity Channel Index (CCI) Classic Heiken Ashi candles Moving Aver
Smart Peak Bottom
Xiaoyu Huang
5 (2)
This is a clear indicator for judging tops and bottoms, and it works well for Oscillating market. Promotional price 49$ → 59$ features good at judging tops and bottoms No redrawing, no drifting Fast calculation, no lag Rich reminder mode Multiple parameters and colors can be adjusted parameter "======== Main ========" HighLowPeriod1 = 9 HighLowPeriod2 = 60 HighLowPeriod3 = 34 HighLowEMAPeriod = 4 MASignalPeriod = 5 "======== Notify ========" UseAlertNotify = true; UseMetaQuotesIDNotify =
More from author
Hull Moving Average Crossover
Leif Christian Ringstad
5 (1)
This is a moving average crossover using two Hull Moving averages. It can change colour on slope, on the crossover or if the price is above/below the moving averages. Use the crossover as signals for entering a trade in the long or short direction. The Hull Moving Average (HMA), developed by Alan Hull, is an very fast and smooth moving average. It has very little lag, and follows the price closely. Parameters: Parameter  Default value  Options  Fast Hull MA period   30  Any number of bars Fast
ADX Vidya Moving Average Crossover
Leif Christian Ringstad
5 (1)
This is a moving average crossover using Average Directional Index Vidya Moving average. It can change colour on slope or on the crossover. Use the crossover as signals for entering a trade in the long or short direction. Parameters: Parameter  Default value  Options  Fast ADXVMA period   14  Any number of bars Fast ADXVMA price method     Close  Open, Close, High, Low, Median, Typical, Weighted  Slow ADXVMA period   21  Any number of bars Slow  ADXVMA price method     Close   Open, Close, High,
Kijun Sen Crossover
Leif Christian Ringstad
This is a crossover using two Kijun-Sen lines. Kijun-Sen is known from ichimoku cloud. This indicator can be used as a dual baseline, or as a crossover on different lengths. It can change on the crossover or if the price is above/below the lines. Use the crossover as signals for entering a trade in the long or short direction. Parameters: Parameter  Default value  Options  Fast Kijun-Sen period   26  Any number of bars Slow   Kijun-Sen period   10  Any number of bars Visual colour of moving aver
Mean Reversal Bands
Leif Christian Ringstad
This indicator can be used to get entries when crossing inwards from the outer bands. The center line can also be used as a baseline/trend direction. Parameters: Parameter  Default value  Options  Base period   100  Any number of bars Applied Price   Close  The price to use for calculation of the channel Multiplier for outer band   2.5  The multiplier for calculating the outer bands Multiplier for inner band   1.5   The multiplier for calculating the inner bands Period for smoothing the True Ave
Filter:
No reviews
Reply to review