Symmetrical Triangle Patterns MT5
- Indicators
- LEE SAMSON
- Version: 2.1
- Updated: 6 May 2022
- Activations: 10
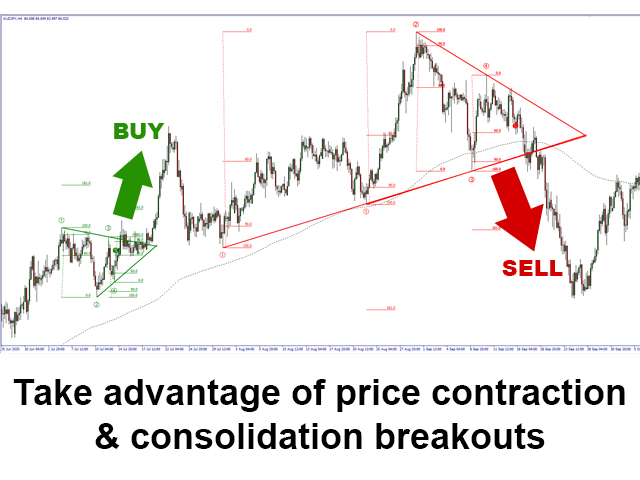
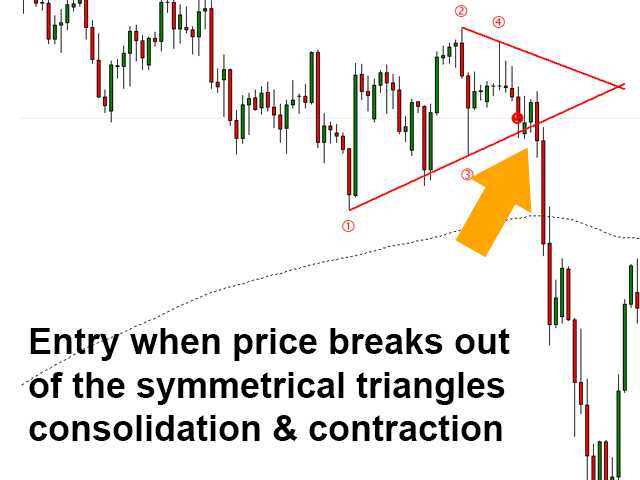
A symmetrical triangle chart pattern represents a period of contraction & consolidation before the price is forced to breakout to the upside or breakdown. A breakdown from the lower trendline marks the start of a new bearish trend, while a breakout from the upper trendline indicates the start of a new bullish trend.
MT4 Version Available Here: https://www.mql5.com/en/market/product/68709/
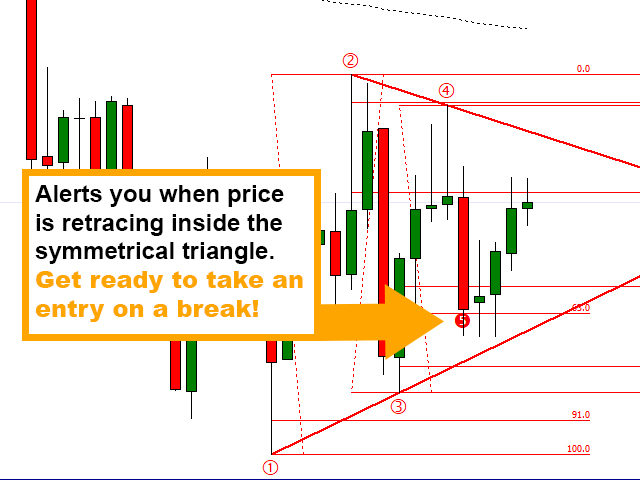
This indicator identifies these patterns and alerts you when the 4 key points have formed and price has pulled back into the triangle again so you can get ready for the potential breakout. Symmetrical triangles are not always perfectly symmetrical and price can break up or down but typically the most sucessful breakouts are in the direction of the high or low that formed the first point of the triangle. The indicator therefore gives us a bullish or bearish bias for the breakout and is colour coded and alerts for that specific direction. It is not necessary to take the trade in just one direction however as a breakout in either direction is possible but when the break happens in line with the first points trend you tend to get a larger and faster price movement and better risk reward.
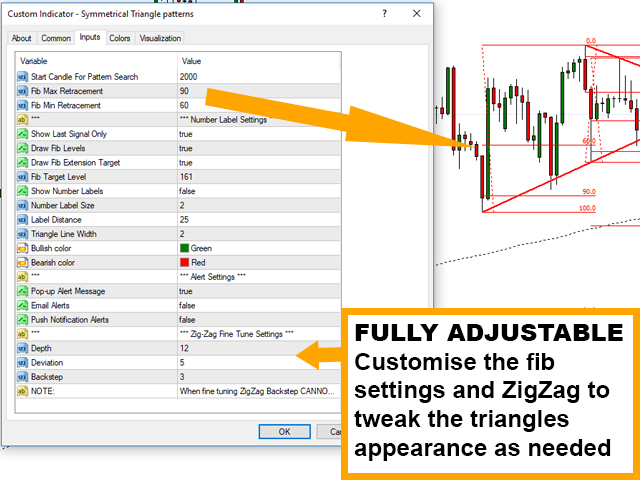
INPUTS AND CONFIGURATION OPTIONS:
- Start Candle For Search - How many candles back the indicator will start to look for completed patterns
- Fib Max Retracement - The maximum retracement price can make to form points 3,4 and 5
- Fib Min Retracement - The minimum retracement price can make to form points 3,4 and 5
- Show Last Signal Only - Displays only the last/current pattern
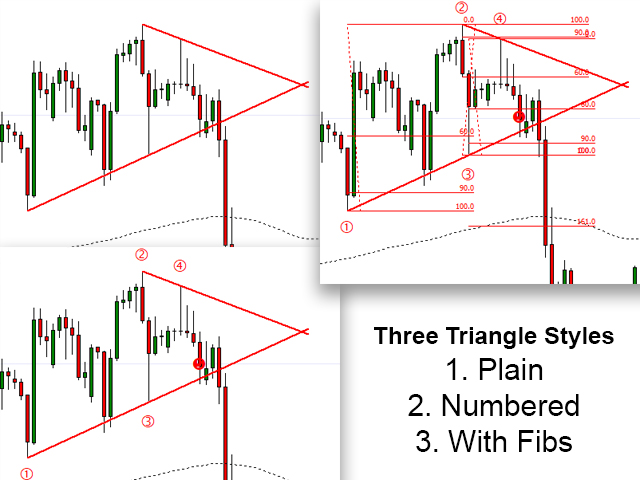
- Draw Fib Levels - Draws or hides the fib retracement levels used to calculate the triangle
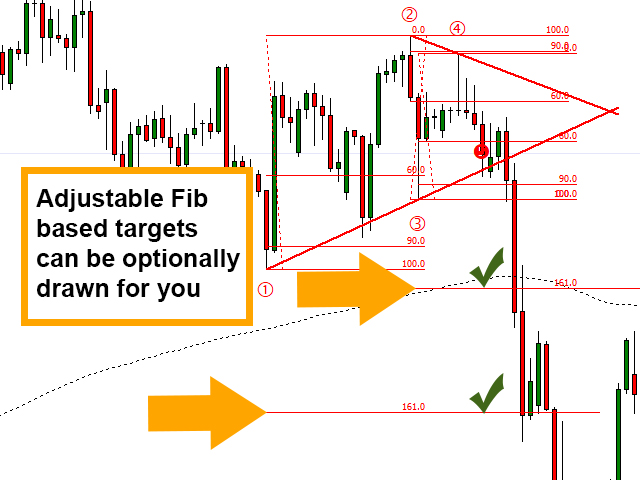
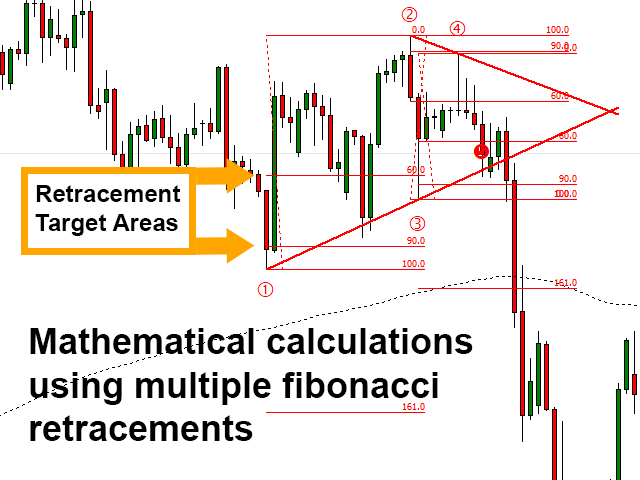
- Draw Fib Extension Target - Allows you to enter a target fic extension level for points 2 and 4 which are often where price will reach for.
- Show Number Labels - Display or hide the number labels for the points of the triangle
- Label Distance - Adjusts the distance of the number labels from the candle highs and lows
- Triangle Line Width - Line width of the triangles drawn
- Bullish & Bearish Colour - Chose the colours for each triangle type
- Alerts - Choose from pop up, email or push alerts
- Zig-Zag Settings - Adjust the Zig-Zag indicator setings to fine tune to your liking. Points 1 and 2 are formed based on the standard Zig-Zag which forms the start of the pattern.
STRATEGY & HOW TO TRADE SYMMETRICAL TRIANGLES:
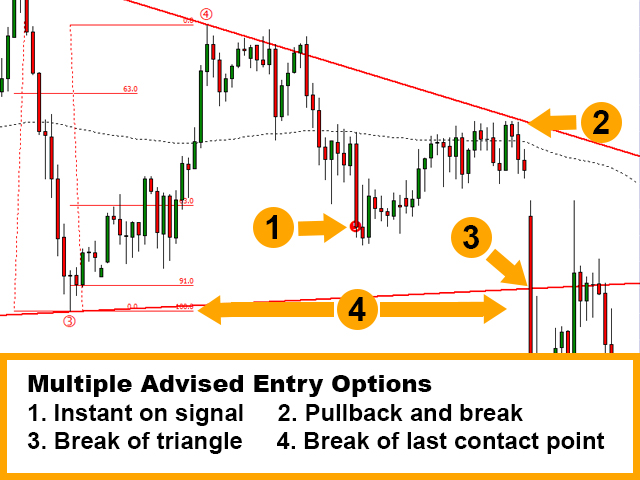
There are many ways to use symmetrical triangle patterns but the most common strategies are laid out below.
1. Use a moving average (often the 200EMA) and only take breaks of the triangles in line with the time frames trend direction. Choose to take only triangles of the right colour (bullish or bearish) or trade all that break in the trend direction.
2. Use higher timeframe trend direction and only enter in that direction. Symmetrical triangles will often form after price has strongly pushed in one direction. They form as price "pauses" after the initial move and will typically break in the same direction as the starting move. This is why we have a bullish or bearish bias on the triangles drawn on the chart. The risk:reward and strength of breaks in line with the original trend are often much better.
3. Trade every triangle in both directions with pending orders at points 3 and 4. It is not uncommon for price to break and then re-test the triangle area again before reversing the opposite direction (further contraction or consolidation before the move) with some force. You can take advantage of this with pending orders set at points 3 and 4 of the triangle meaning you capture the move as it unfolds in either direction.


Hi Master Lee Samson, your indicator is super, if you add Ascending and Descending patterns. It will be a super star. 10/10