Extended MultiColored MACD MT5
- Indicators
- Sergey Efimenko
- Version: 1.4
- Updated: 24 March 2020
- Activations: 10
An extended version of the well-known Moving Average Convergence / Divergence (MACD) indicator, distributed in 4 colors: growth, fall above and below 0.
26 options for smoothing moving averages, 11 types of prices.
Disabled Alerts on color change with selectable alert mode: only when crossing a zero value or at any color change (rising / falling change and 0 crossing).
Smoothing options: Simple, Exponential, Wilder Exponential, Linear Weighted, Sine Weighted, Triangular, Least Square, Smoothed, Hull, Zero-Lag Exponential, Double Exponential, T3, Instantaneous Trendline, Median, Geometric Mean, Regularized EMA, Integral of Linear Regression Slope, Combination of LSMA and ILRS, Triangular, Volume Weighted, Smoothing by M.Jurik, Simplified SMA, Arnaud Legoux Moving Average, Triple Exponential Moving Average by Patrick Mulloy, T3 by TTillson correct version, Laguerre filter by J.Ehlers.
Prices: Close, Open, High, Low, Median, Typical, Weighted, Heiken Ashi (Close, Open, High, Low).
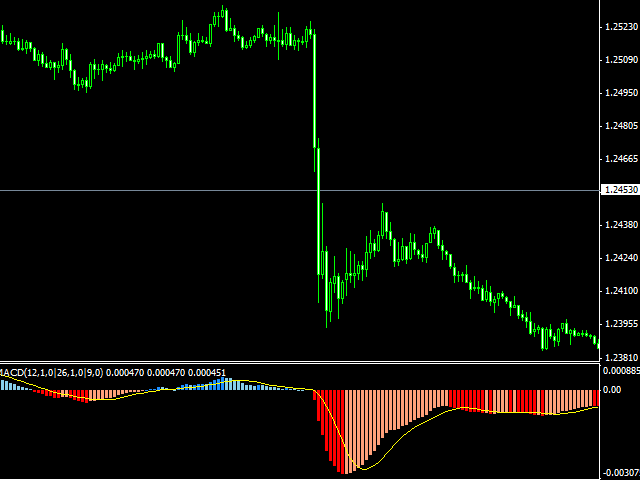

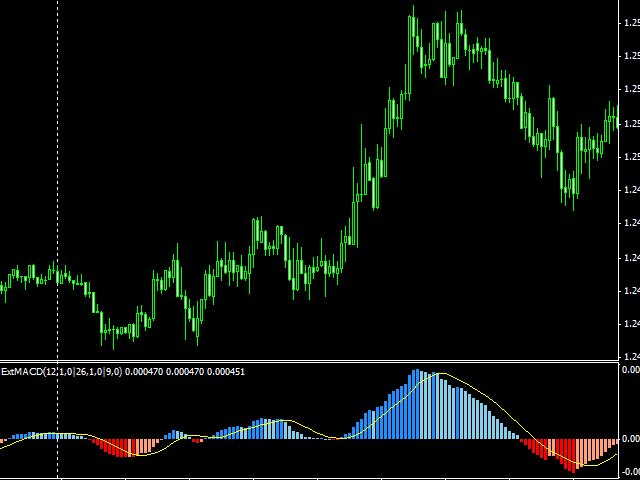


Best MACD on the market!