• Overview
  • Reviews (8)
  • Comments (15)
  • What's new

Candle Counter RSJ

5

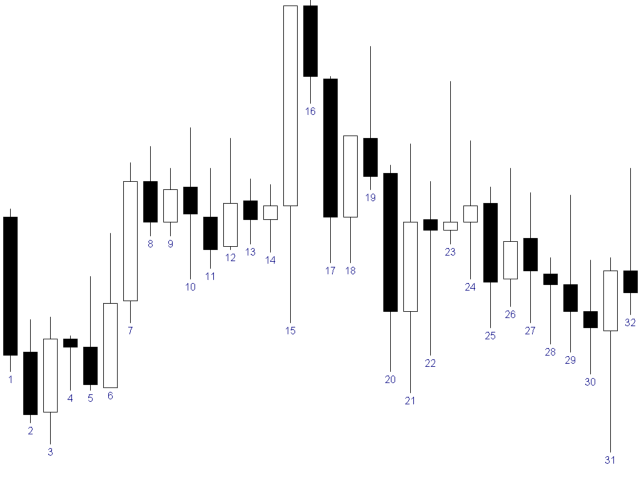
Candle Counter is an indicator that prints the number of candles from the first candle of the day.

The first candle of the day will be the number 1 and each new candle will be increased by 1 in this count.


    Input Parameters

    • Choose from even, odd or all
    • Distance from candle to Print the number
    • Text Font Size
    • Text Font Color


    If you still have questions, please contact me by direct message: https://www.mql5.com/en/users/robsjunqueira/


    Reviews 8
    Σάκης Καρανικόλας
    33
     

    I recently downloaded an indicator for MT5, and I must say it's proven to be an incredibly useful tool for my trading endeavors. What I appreciate most about this indicator is its simplicity and functionality. It has streamlined my trading process and made it much more efficient. The user-friendly interface and straightforward design make it easy for even beginners to navigate. It doesn't overwhelm me with unnecessary features or complex settings, which is a common issue with many trading apps. Instead, it provides the essential tools and information I need to make well-informed decisions. However, if I could suggest one improvement, it would be to have the option to change the starting point for the count. To start from the normal opening of the market (RTH). Overall, I'm quite pleased with this indicator!

    sergiotanb
    14
    sergiotanb 2023.09.05 00:43 
     

    Muito bom

    marcelotk
    14
    marcelotk 2023.08.12 16:22 
     

    Prático... Muito útil... Fácil de configurar.. gostei muito

    Recommended products
    Noize Absorption Index - is the manual trading system that measures the difference of pressure between bears forces and bulls forces. Green line - is a noize free index that showing curent situation. Zero value of index shows totally choppy/flat market.Values above zero level shows how powerfull bullish wave is and values below zero measures bearish forces.Up arrow appears on bearish market when it's ready to reverse, dn arrow appears on weak bullish market, as a result of reverse expectation.
    Double HMA MTF for MT5
    Pavel Zamoshnikov
    5 (2)
    This is an advanced multi-timeframe version of the popular Hull Moving Average (HMA) Features Two lines of the Hull indicator of different timeframes on the same chart. The HMA line of the higher timeframe defines the trend, and the HMA line of the current timeframe defines the short-term price movements. A graphical panel with HMA indicator data from all timeframes at the same time . If the HMA switched its direction on any timeframe, the panel displays a question or exclamation mark with a tex
    Owl Smart Levels MT5
    Sergey Ermolov
    4.47 (36)
    MT4 version  |   FAQ The Owl Smart Levels Indicator is a complete trading system within the one indicator that includes such popular market analysis tools as Bill Williams' advanced fractals , Valable ZigZag which builds the correct wave structure of the market, and Fibonacci levels which mark the exact levels of entry into the market and places to take profits. Detailed description of the strategy Instructions for working with the indicator Advisor-assistant in trading Owl Helper Private User
    An indicator of pattern #31 ("Long Island") from Encyclopedia of Chart Patterns by Thomas N. Bulkowski. The second gap is in the opposite direction. Parameters: Alerts - show alert when an arrow appears   Push - send a push notification when an arrow appears (requires configuration in the terminal) GapSize - minimum gap size in points ArrowType - a symbol from 1 to 17 ArrowVShift - vertical shift of arrows in points   ShowLevels - show levels ColUp - color of an upward line ColDn - color of a
    Stochastic R
    Antony Augustine
    Stochastic  Reversal  allows you to recognize reversals professionally. Stochastic Indicator: This technical indicator was developed by George Lane more than 50 years ago. The reason why this indicator survived for so many years is because it continues to show consistent signals even in these current times. The Stochastic indicator is a momentum indicator that shows you how strong or weak the current trend is. It helps you identify overbought and oversold market conditions within a trend.  Rules
    ZigZag with Fibonacci
    Rafael Caetano Pinto
    This indicator uses the metaquotes ZigZag indicator as base to plot fibonacci extension and fibonacci retracement based in the Elliot waves. A fibonacci retracement will be plotted on every wave draw by the ZigZag. A fibonacci extension will be plotted only after the 2nd wave. Both fibonacci will be updated over the same wave tendency. Supporting until 9 consecutive elliot waves. Parameters: Depth: How much the algorithm will iterate to find the lowest and highest candles Deviation: Amoun
    Trend Monitor MT5
    Pavel Zamoshnikov
    3.67 (3)
    The indicator generates early signals basing on ADX reading data combined with elements of price patterns. Works on all symbols and timeframes. The indicator does not redraw its signals. You see the same things on history and in real time. For better visual perception signals are displayed as arrows (in order not to overload the chart). Features The best results are obtained when the indicator works on two timeframes. For example: M30 – the indicator shows the main trend; M5 – the indicator ge
    The Antique Trend Indicator is a revolutionary trend trading and filtering solution with all the important features of a trend tool built into one tool! The Antique Trend indicator is good for any trader, suitable for any trader both for Forex and binary options. There is no need to configure anything, everything has been perfected by time and experience, it works great during flats and trends. The Antique Trend indicator is a tool for technical analysis of financial markets, reflecting curre
    This is the famous Sunflower indicator for Metatrader5. This indicator marks possible tops and bottoms on price charts. The indicator identifies tops and bottoms in the asset's price history, keep in mind that the current sunflower of the last candle repaints, as it is not possible to identify a top until the market reverses and it is also not possible to identify a bottom without the market stop falling and start rising. If you are looking for a professional programmer for Metatrader5, please
    Time And Sales Delta
    Evgeny Shevtsov
    5 (2)
    The indicator displays the delta and the cumulative delta based on the "Time & Sales" deals list data. In addition to the standard timeframes, the indicator displays data regarding the seconds timeframes (S5, S10, S15, S20, S30) to choose from. Using the rectangle, user can select an arbitrary area in the indicator subwindow to view the ratio of the volumes of deals of buyers and sellers within this area. Indicator features: The indicator works correctly only on those trading symbols for whi
    Exclusive Limited Time Offer! Grab this useful indicator for a lifetime at just $49. Note: It is requested that purchases must be refrained from if the buyer is from India, Bangladesh, or Pakistan, as developer support for these regions is unavailable due to legal restrictions. Volatility indicator dashboard designed to revolutionize how traders perceive and navigate market volatility. Track volatile for multiple currency pairs one at time for multiple timeframes. Works best with Forex Market,
    The new update makes this indicator a complete tool for studying, analyzing and operating probabilistic patterns. It includes: On-chart Multi-asset percentage monitor. Configurable martingales. Twenty-one pre-configured patterns, including Mhi patterns and C3. An advanced pattern editor to store up to 5 custom patterns. Backtest mode to test results with loss reports. Trend filter. Hit operational filter. Martingale Cycles option. Various types of strategies and alerts. Confluence between patter
    Renko Gold
    Ignacio Agustin Mene Franco
    Renko Gold! clearly indicates the floors and ceilings where it goes from 4 lines, the line below that marks the floor in green confirming with the thinnest line clarifies the purchase entry, the same is for sale, the top line marks the ceiling and the thinnest red line marks the sale, This indicator works for all temporalities! For Forex and Synthetic Indices markets! It also works for crypto markets! Good profit! World Investor.
    Trend Side - a technical indicator for determining the trend. It is a set of several full-fledged trading strategies. The indicator uses an advanced trend filtering system, has a statistical panel, calculates entry and exit levels, and calculates the dynamic Trailing Stop level. Suitable for any type of symbols, never redraws its signals and results. A comprehensive tool for professional trend trading. The set of the Trend Side indicator also includes Andrews Trend Scanner - a multi-currency
    Supply and Demand Indicator + FREE Currency Strength Meter ADD-ON Looking for a powerful tool that can help you identify the most reactive zones in the forex market? Our supply and demand indicator for MetaTrader 4 and 5 is exactly what you need. With its advanced algorithms and real-time analysis, this indicator helps traders of all experience levels make informed trading decisions. The supply and demand indicator is a cutting-edge tool that helps traders identify areas where buyers and sellers
    To download MT4 version please click here . This is the exact conversion from TradingView: "WaveTrend [LazyBear]" By "zeusuk3". One of the coolest indicators out there to detect overbought and oversold zones. It can be used as a part of more complicated strategy and for confirming a potential trade setup. There are buffers to use in EAs also. The indicator is loaded light and non-repaint. - You can message in private chat for further changes you need. Thanks for downloading 
    Supertrend indicator uses a combination of a moving average and average true range to detect the trend of a trading instrument. Supertrend indicator for MetaTrader 5 easily shows the trend as a line following the price. Triple SuperTrend Histo indicator  calculate  three supertrends to show the trend as a histogram. Changing the color from red to green means you can BUY , from green to red means you can SELL . Description of the method of drawing a histogram. The price is above the EMA 20
    Swing Tracer
    Ely Alsedy
    5 (2)
    it depends on ATR period to get swing points to help make better trading decisions  blue dot and red dot is the default color scheme of course you can change it later if you'd like  you can change the following : ATR PERIOD  sending notifications number of times to send notifications  sending notifications to your smart phone that's it very simple to use just drag and drop and follow the trend 
    This is an MTF indicator of support and resistance levels based on Advanced ZigZag Dynamic and/or Extended Fractals indicator extremums with price labels (can be disabled). More higher TFs can be selected for MTF mode. By default, the levels are generated based on ZigZag indicator dots. Fractals indicator dots can also be used together with ZigZag or instead of it. In order to simplify the use and save CPU time, calculation is performed once per each bar at its opening. Parameters: ForcedTF - ch
    Liquidity Oscillator
    Paolo Scopazzo
    5 (1)
    A powerful oscillator that provide Buy and Sell signals by calculating the investor liquidity. The more liquidity the more buy possibilities. The less liquidity the more sell possibilities. Please download the demo and run a backtest! HOW IT WORKS: The oscillator will put buy and sell arrow on the chart in runtime only . Top value is 95 to 100 -> Investors are ready to buy and you should follow. Bottom value is 5 to 0 -> Investors are ready to sell and you should follow. Alert + sound will app
    VR Cub MT 5
    Vladimir Pastushak
    VR Cub is an indicator for getting high-quality entry points. The indicator was developed to facilitate mathematical calculations and simplify the search for entry points into a position. The trading strategy for which the indicator was written has been proving its effectiveness for many years. The simplicity of the trading strategy is its great advantage, which allows even novice traders to successfully trade with it. VR Cub calculates position opening points and Take Profit and Stop Loss targe
    Indicator and Expert Adviser  EA Available in the comments section of this product. Download with Indicator must have indicator installed for EA to work. Mt5 indicator alerts for bollinger band and envelope extremes occurring at the same time. Buy signal alerts occur when A bullish candle has formed below both the lower bollinger band and the lower envelope  Bar must open and close below both these indicators. Sell signal occur when A bear bar is formed above the upper bollinger band and upp
    Premium level is a unique indicator with more than 80% accuracy of correct predictions! This indicator has been tested for more than two months by the best Trading Specialists! The author's indicator you will not find anywhere else! From the screenshots you can see for yourself the accuracy of this tool! 1 is great for trading binary options with an expiration time of 1 candle. 2 works on all currency pairs, stocks, commodities, cryptocurrencies Instructions: As soon as the red ar
    MetaCOT 2 is a set of indicators and specialized utilities for the analysis of the U.S. Commodity Futures Trading Commission reports. Thanks to the reports issued by the Commission, it is possible to analyze the size and direction of the positions of the major market participants, which brings the long-term price prediction accuracy to a new higher-quality level, inaccessible to most traders. These indicators, related to the fundamental analysis, can also be used as an effective long-term filter
    The 123 Pattern is one of the most popular, powerful and flexible chart patterns. The pattern is made up of three price points: a bottom, a peak or valley, and a Fibonacci retracement between 38.2% and 71.8%. A pattern is considered valid when the price breaks beyond the last peak or valley, moment at which the indicator plots an arrow, rises an alert, and the trade can be placed. [ Installation Guide | Update Guide | Troubleshooting | FAQ | All Products ] Clear trading signals Customizable c
    The indicator Supply Demand RSJ PRO calculates and plots the "Supply" and "Demand" zones on the graph, identifying the type of Zone (Weak, Strong, Verified, Proven) and in case of retests of the Zone it shows how many times it was retested. "Supply" Zones are the price zones where more supply than demand has occurred, driving prices down. "Demand" Zones are the price zones where more demand than supply has occurred, pushing prices up. Be sure to try our professional version with configurable f
    Candlestick Pattern Detector
    Adhemar Braganca Correa Travassos
    This indicator can identify more than 60 candlestick patterns on the chart, including their bullish and bearish variants. Just choose the pattern you want in the settings. Available Patterns 2 Crows Gravestone Doji On Neck 3 Black Crows Hammer Piercing 3 Inside Hanging Man Rick Shawman 3 Line Strike Harami Rising and Falling Three Method 3 Outside Harami Cross Separating Lines 3 Stars in South High Wave Shooting Star 3 White Soldiers Hikkake Short Line Abandoned Baby Hikkake Modified Spinning
    KT Horizontal Lines MT5
    KEENBASE SOFTWARE SOLUTIONS
    In MetaTrader, plotting multiple   horizontal lines   and then tracking their respective price levels can be a hassle. This indicator automatically plots multiple horizontal lines at equal intervals for setting price alerts, plotting support and resistance levels, and other manual purposes. This indicator is suitable for Forex traders who are new and looking for chances to make quick profits from buying and selling. Horizontal lines can help traders find possible areas to start trading when the
    Ichimoku Aiko MTF
    Michael Jonah Randriamampionontsoa
    Ichimoku Aiko MTF is a collection of technical indicators that show support and resistance levels, as well as momentum and trend direction. It is a multi-timeframe indicator so you don't need to change the chart timeframe when you want to see the ichimoku clouds on a higher timeframe.  eg. The chart timeframe is M15 and you want to see on the M15 timeframe chart the H1 ichimoku indicators (the ichimoku in Metatrader can't do that) that's why you need to use Ichimoku Aiko MTF.
    An indicator of patterns #24 and #26 ("Head and Shoulders") from Encyclopedia of Chart Patterns by Thomas N. Bulkowski. Parameters: Alerts - show alert when an arrow appears   Push - send a push notification when an arrow appears (requires configuration in the terminal) PeriodBars - indicator period K - an additional parameter that influences the accuracy of pattern shape recognition ArrowType - a symbol from 1 to 17 ArrowVShift - vertical shift of arrows in pixels   ShowLevels - show levels Col
    Buyers of this product also purchase
    Atomic Analyst MT5
    Issam Kassas
    4.22 (9)
    First of all Its worth emphasizing here that this Trading Indicator is   Non-Repainting ,   Non-Redrawing   and   Non-Lagging   Indicator, Which makes it ideal from both manual and robot trading.  The Atomic Analyst  is a PA Price Action Indicator that uses Strength and Momentum of the price to find a better edge in the market. Equipped with an AI filter which help remove noises and false signals, and Increase Trading Potential. Using Multiple layers of complex Indicators, the Atomic Analyst
    First of all Its worth emphasizing here that this Trading System is Non-Repainting , Non-Redrawing and Non-Lagging Indicator , Which makes it ideal from both manual and robot trading .  The Smart Trend Trading System MT5 is a comprehensive trading solution tailored for new and experienced traders . It combines over 10 premium indicators and features more than 7 robust trading strategies , making it a versatile choice for diverse market conditions . Trend Following Strategy : Provides precise ent
    Quantum Trend Sniper
    Bogdan Ion Puscasu
    5 (36)
    Introducing   Quantum Trend Sniper Indicator , the groundbreaking MQL5 Indicator that's transforming the way you identify and trade trend reversals! Developed by a team of experienced traders with trading experience of over 13 years,   Quantum Trend Sniper Indicator   is designed to propel your trading journey to new heights with its innovative way of identifying trend reversals with extremely high accuracy. ***Buy Quantum Trend Sniper Indicator and you could get Quantum Breakout Indicator fo
    Gold Stuff mt5
    Vasiliy Strukov
    4.88 (162)
    Gold Stuff mt5 is a trend indicator designed specifically for gold and can also be used on any financial instrument. The indicator does not redraw and does not lag. Recommended time frame H1. Contact me immediately after the purchase to get   personal bonus! Settings  and manual   here   SETTINGS Draw Arrow - on off. drawing arrows on the chart. Alerts -   on off audible alerts. E-mail notification - on off. email notifications. Puch-notification - on off. Push notifications. Next, adjust the co
    Trend Screener Pro MT5
    STE S.S.COMPANY
    4.88 (60)
    Unlock the Power of  Trends trading with Trend Screener Indicator: Your Ultimate Trend Trading Solution powered by fuzzy logic and Multi-currencies System ! Elevate your trend trading with Trend Screener, the revolutionary trend indicator powered by   fuzzy logic.  It is a powerful trend-following indicator that combines over  13 premium tools and features and 3 trading strategies  , making it a versatile choice to   make your Metatrader a Trend Analyzer. LIMITED TIME OFFER : Trend Screener Indi
    Advanced Supply Demand MT5
    Bernhard Schweigert
    4.53 (15)
    Best Solution for any Newbie or Expert Trader! This indicator is a unique, high quality and affordable trading tool because we have incorporated a number of proprietary features and a new formula. With this update, you will be able to show double timeframe zones. You will not only be able to show a higher TF but to show both, the chart TF, PLUS the higher TF: SHOWING NESTED ZONES. All Supply Demand traders will love it. :) Important Information Revealed Maximize the potential of Advanced Suppl
    RelicusRoad Pro MT5
    Relicus LLC
    4.81 (21)
    How many times have you bought a trading indicator with great back-tests, live account performance proof with fantastic numbers and stats all over the place but after using it, you end up blowing your account? You shouldn't trust a signal by itself, you need to know why it appeared in the first place, and that's what RelicusRoad Pro does best! NOW $147 (increasing to $499 after a few updates) - UNLIMITED ACCOUNTS (PCs or MACs) **  User Manual + Strategies + Training Videos + Private Group with
    First of all Its worth emphasizing here that this Trading Tool is Non Repainting , Non Redrawing and Non Lagging Indicator , Which makes it ideal for professional trading . The Smart Price Action Concepts Indicator is a very powerful tool for both new and experienced traders . It packs more than 20 useful indicators into one , combining advanced trading ideas like Inner Circle Trader Analysis and Smart Money Concepts Trading Strategies . This indicator focuses on Smart Money Concepts , prov
    Introducing   Quantum Breakout PRO , the groundbreaking MQL5 Indicator that's transforming the way you trade Breakout Zones! Developed by a team of experienced traders with trading experience of over 13 years,   Quantum Breakout PRO   is designed to propel your trading journey to new heights with its innovative and dynamic breakout zone strategy. Quantum Breakout Indicator will give you signal arrows on breakout zones with 5 profit target zones and stop loss suggestion based on the breako
    FX Power MT5 NG
    Daniel Stein
    5 (4)
    Trading GOLD, and currencies, with the dog walk strategy  - super smart Trading GOLD, and currencies, with the breakout strategy  - super easy Visit our all-new   Stein Investments Welcome Page   to get the latest information, updates and trading strategies. FX Power MT5 NG  is the next generation of our long-time very popular currency strength meter, FX Power.  And what does this next-generation strength meter offer? Everything you have loved about the original FX Power  PLUS GOLD/XAU st
    AW Trend Predictor MT5
    AW Trading Software Limited
    4.76 (54)
    The combination of trend and breakdown levels in one system. An advanced indicator algorithm filters market noise, determines the trend, entry points, as well as possible exit levels. Indicator signals are recorded in a statistical module, which allows you to select the most suitable tools, showing the effectiveness of the signal history. The indicator calculates Take Profit and Stop Loss marks. Manual and instruction ->  HERE  / MT4 version ->  HERE How to trade with the indicator:  Trading wit
    FX Volume MT5
    Daniel Stein
    4.94 (17)
    Visit our all-new   Stein Investments Welcome Page   to get the latest information, updates and trading strategies. FX Volume is the FIRST and ONLY volume indicator that provides a REAL insight into the market sentiment from a broker's point of view. It provides awesome insights into how institutional market participants, like brokers, are positioned in the Forex market, much faster than COT reports. Seeing this information directly on your chart is the real game-changer and breakthrough solut
    Top indicator for MT5   providing accurate signals to enter a trade without repainting! It can be applied to any financial assets:   forex, cryptocurrencies, metals, stocks, indices .  Watch  the video  (6:22) with an example of processing only one signal that paid off the indicator! MT4 version is here It will provide pretty accurate trading signals and tell you when it's best to open a trade and close it. Most traders improve their trading results during the first trading week with the help of
    TPSproTREND PrO MT5
    Roman Podpora
    5 (5)
    TPSpro TRENDPRO  - is a trend indicator that automatically analyzes the market and provides information about the trend and each of its changes, as well as giving signals for entering trades without redrawing! The indicator uses each candle, analyzing them separately. referring to different impulses - up or down impulse. Exact entry points into transactions for currencies, crypto, metals, stocks, indices!  -  Version MT4                  DETAILED DESCRIPTION        /       TRADING SETUPS       
    Bill Williams Advanced
    Siarhei Vashchylka
    5 (3)
    Bill Williams Advanced is designed for automatic chart analysis using Bill Williams' "Profitunity" system. The indicator analyzes four timeframes at once. Manual (Be sure to read before purchasing) Advantages 1. Automatically analyzes the chart using the "Profitunity" system of Bill Williams. The found signals are placed in a table in the corner of the screen. 2. Equipped with a trend filter based on the Alligator indicator. Most of the system signals are recommended to be used only accordi
    ICT, SMC, SMART MONEY CONCEPTS, SMART MONEY, Smart Money Concept, Support and Resistance, Trend Analysis, Price Action, Market Structure, Order Blocks, BOS/CHoCH,   Breaker Blocks ,  Momentum Shift,   Supply&Demand Zone/Order Blocks , Strong Imbalance,   HH/LL/HL/LH,    Fair Value Gap, FVG, Inversion FVG, IFVG,  Premium  &   Discount   Zones, Fibonacci Retracement, OTE, Buy Side Liquidity, Sell Side Liquidity, BSL/SSL Taken, Equal Highs & Lows, MTF Dashboard, Multiple Time Frame, BigBar, HTF OB
    TrendMaestro5
    Stefano Frisetti
    note: this indicator is for METATRADER4, if you want the version for METATRADER5 this is the link:  https://www.mql5.com/it/market/product/108106 TRENDMAESTRO recognizes a new TREND in the bud, he never makes mistakes. The certainty of identifying a new TREND is priceless. DESCRIPTION TRENDMAESTRO identifies a new TREND in the bud, this indicator examines the volatility, volumes and momentum to identify the moment in which there is an explosion of one or more of these data and therefore the mome
    Auto Order Block with break of structure based on ICT and Smart Money Concepts Futures Break of Structure ( BoS )             Order block ( OB )            Higher time frame Order block / Point of Interest ( POI )    shown on current chart           Fair value Gap ( FVG ) / Imbalance   ,  MTF      ( Multi Time Frame )    Volume Imbalance     ,  MTF          vIMB Gap’s Equal High / Low’s     ,  MTF             EQH / EQL Liquidity               Current Day High / Low           HOD /
    TrendDecoder Premium MT5
    Christophe, Pa Trouillas
    5 (1)
    Identify ranges  | Get earliest signals of Trends  | Get clear exits before reversal  | Spot the Fibo levels the price will test   |  Non-repainting, non-delayed indicator - ideal for manual and automated trading - for all assets and all time units $69   for launch - then back to >>   $149 After purchase,   please contact me on this channel   for recommended and personalised settings MT4   version:  Click here Get our full method with  BladeSCALPER  and   PowerZONES What is it about? TrendDE
    XQ Indicator MetaTrader 5
    Marzena Maria Szmit
    5 (1)
    Step into the realm of Forex trading with confidence and precision using XQ, a cutting-edge Forex indicator designed to elevate your trading game to unprecedented heights. Whether you're a seasoned trader or just stepping into the world of currency exchange, XQ Forex Indicator empowers you with the insights and signals needed to make informed trading decisions. The signal conditions are a combination of three indicators, and XQ Forex Indicator only display  medium and long-term trends . The ind
    Profit from market structure changes as price reverses and pulls back. The market structure reversal alert indicator identifies when a trend or price move is approaching exhaustion and ready to reverse. It alerts you to changes in market structure which typically occur when a reversal or major pullback are about to happen. The indicator identifies breakouts and price momentum initially, every time a new high or low is formed near a possible exhaustion point. The indicator draws in a rectangle on
    TrendLine PRO MT5
    Evgenii Aksenov
    4.78 (49)
    The Trend Line PRO indicator is an independent trading strategy. It shows the trend change, the entry point to the transaction, as well as automatically calculates three levels of Take Profit and Stop Loss protection Trend Line PRO is perfect for all Meta Trader symbols: currencies, metals, cryptocurrencies, stocks and indices Advantages of Trend Line PRO Never redraws its signals The possibility of using it as an independent strategy It has three automatic levels Take Profit and Stop Loss lev
    IX Power MT5
    Daniel Stein
    5 (1)
    IX Power   finally brings the unbeatable precision of FX Power to non-Forex symbols. It accurately determines the intensity of short, medium and long-term trends in your favourite indices, stocks, commodities, ETFs, and even cryptocurrencies. You can   analyse everything   your terminal has to offer. Try it out and experience how   your timing improves significantly   when trading. Read about our latest strategic development -  Easy scalping with IX Power Visit our all-new   Stein Investments
    Volume by Price MT5
    Brian Collard
    5 (3)
    The Volume by Price Indicator for MetaTrader 5 features Volume Profile and Market Profile TPO (Time Price Opportunity). Get valuable insights out of currencies, equities and commodities data. Gain an edge trading financial markets. Volume and TPO histogram bar and line charts. Volume Footprint charts. TPO letter and block marker charts including split structures. Versatile segmentation and compositing methods. Static, dynamic and flexible ranges with relative and/or absolute visualizations. Lay
    Quantum Heiken Ashi PRO MT5
    Bogdan Ion Puscasu
    4.5 (8)
    Introducing the Quantum Heiken Ashi PRO charts with integrated alerts Designed to provide clear insights into market trends, the Heiken Ashi candles are renowned for their ability to filter out noise and eliminate false signals. Say goodbye to confusing price fluctuations and hello to a smoother, more reliable chart representation. What makes the Quantum Heiken Ashi PRO truly unique is its innovative formula, which transforms traditional candlestick data into easy-to-read colored bars. Red and g
    A key element in trading is zones or levels from which decisions to buy or sell a trading instrument are made. Despite attempts by major players to conceal their presence in the market, they inevitably leave traces. Our task was to learn how to identify these traces and interpret them correctly. Reversal First Impulse levels (RFI)   -  Version MT4                  INSTRUCTIONS                 RUS                 ENG                         R ecommended to use with an indicator   -  TREND PRO  
    Was: $249  Now: $99   Market Profile defines a number of day types that can help the trader to determine market behaviour. A key feature is the Value Area, representing the range of price action where 70% of trading took place. Understanding the Value Area can give traders valuable insight into market direction and establish the higher odds trade. It is an excellent addition to any system you may be using. Inspired by Jim Dalton’s book “Mind Over Markets”, this indicator is designed to suit the
    Dark Power MT5
    Marco Solito
    4.84 (56)
    Dark Power  is an Indicator for intraday trading. This Indicator is based on   Trend Following  strategy, also adopting the use of an histogram to determine the right power . We can enter in good price with this Indicator, in order to follow the   strong trend   on the current instrument. The histogram is calculated based on the size of the bars and two moving averages calculated on the histogram determine the direction of the signal Key benefits Easily visible take profit/stop loss lines Int
    Golden Gate Algo MT5
    James David Lane
    4 (6)
    Introducing GoldenGate Algo: A Cutting-Edge Trading Solution!  Discover a revolutionary approach to trading with GoldenGate Algo (GGA), an advanced indicator designed to elevate your trading experience. GGA provides a comprehensive set of features to empower users with precision and confidence in their trading decisions. No re-painting! Pairs:   Any TimeFrames:   15m up to H1 Key Features: Buy and Sell Arrow Indications:   Receive Buy and Sell arrow indications accompanied by pop-up alerts,
    Gartley Hunter Multi
    Siarhei Vashchylka
    5 (5)
    Gartley Hunter Multi - An indicator for searching for harmonic patterns simultaneously on dozens of trading instruments and on all classic timeframes: (m1, m5, m15, m30, H1, H4, D1, Wk, Mn). Manual (Be sure to read before purchasing) | Version for MT4 Advantages 1. Patterns: Gartley, Butterfly, Shark, Crab. Bat, Alternate Bat, Deep Crab, Cypher 2. Simultaneous search for patterns on dozens of trading instruments and on all classic timeframes 3. Search for patterns of all possible sizes. Fr
    More from author
    Candle Timer Countdown displays the remaining time before the current bar closes and a new bar forms. It can be used for time management. MT4 version here! Feature Highlights Tracks server time not local time Configurable Text Color and Font Size Optional Visualization of the Symbol Daily Variation Optimized to reduce CPU usage Input Parameters Show Daily Variation: true/false Text Font Size Text Color If you still have questions, please contact me by direct message:  https://www.mql5.com/en
    FREE
    MACD Intraday Trend
    JETINVEST
    4.75 (44)
    MACD Intraday Trend is an Indicator developed through an adaptation made of the original MACD created by Gerald Appel in the 1960s. Through years of trading it was observed that by changing the parameters of the MACD with Fibonacci proportions we achieve a better presentation of the continuity of the trend movements, making that it is possible to more efficiently detect the beginning and end of a price trend. Due to its efficiency in detecting price trends, it is also possible to identify very c
    FREE
    Candle Timer Countdown displays the remaining time before the current bar closes and a new bar forms. It can be used for time management. MT5 version here! Feature Highlights Tracks server time not local time Configurable Text Color and Font Size Optional Visualization of the Symbol Daily Variation Optimized to reduce CPU usage Input Parameters Show Daily Variation: true/false Text Font Size Text Color If you still have questions, please contact me by direct message:  https://www.mql5.com/en
    FREE
    Setup Tabajara was created by a Brazilian trader known as  "The OGRO of Wall Street" . The idea of this setup is to indicate to the trader the current trend of prices and  the type of operation should be looked for in the graph. Operation It does this through the positioning of the closing of the candles and the  vwap until 10:40am and after by the arithmetic mean of 20 periods painting the candles in 4 possible colors: Green -> Price rising in upward trend (Search entry points for PURCHA
    FREE
    Pivot Point Fibo RSJ is an indicator that traces the support and resistance lines of the day using Fibonacci rates. This spectacular indicator creates up to 7 levels of support and resistance through Pivot Point using Fibonacci rates. It is fantastic how the prices respect each level of this support and resistance, where it is possible to perceive possible entry/exit points of an operation. Features Up to 7 levels of support and 7 levels of resistance Set the colors of the levels individual
    FREE
    MACD Intraday Trend is an Indicator developed through an adaptation made of the original MACD created by Gerald Appel in the 1960s. Through years of trading it was observed that by changing the parameters of the MACD with Fibonacci proportions we achieve a better presentation of the continuity of the trend movements, making that it is possible to more efficiently detect the beginning and end of a price trend. Due to its efficiency in detecting price trends, it is also possible to identify very c
    FREE
    Delta Aggression Volume PRO is an indicator developed to monitor the strength and continuity of the aggression volume of sell and buy negotiations. Note: This indicator DOES NOT WORK for Brokers and/or Markets WITHOUT the type of aggression (BUY or SELL). Cryptocurrencies and Forex do not provide this type of data, that is, it does not work with them. O Delta Agrression Volume PRO has features that allow you to view beyond the delta volume of the day. Operation Multi symbols  (those who pro
    Pivot Point Fibo RSJ is an indicator that traces the support and resistance lines of the day using Fibonacci rates. This spectacular indicator creates up to 7 levels of support and resistance through Pivot Point using Fibonacci rates. It is fantastic how the prices respect each level of this support and resistance, where it is possible to perceive possible entry/exit points of an operation. Features Up to 7 levels of support and 7 levels of resistance Set the colors of the levels individual
    FREE
    Weis Waves RSJ
    JETINVEST
    4.67 (9)
    The Weis Waves RSJ Indicator sums up volumes in each wave. This is how we receive a bar chart of cumulative volumes of alternating waves. Namely the cumulative volume makes the Weis wave charts unique. It allows comparing the relation of the wave sequence characteristics, such as correspondence of the applied force (expressed in the volume) and received result (the price progress). If you still have questions, please contact me by direct message:  https://www.mql5.com/en/users/robsjunqueira/
    FREE
    Tabajara Ogro
    JETINVEST
    4.75 (12)
    Setup Tabajara was created by a Brazilian trader known as  "The OGRO of Wall Street" . The idea of this setup is to indicate to the trader the current trend of prices and  the type of operation should be looked for in the graph. Operation It does this through the relation of the closing price position and the     of 20 periods, by painting the candles in 4 possible colors : Green -> Price rising in upward trend (Search entry points for PURCHASE) Black -> Price correcting in Bullish Trend
    FREE
    MACD Intraday Trend PRO is an Indicator developed through an adaptation made of the original MACD created by Gerald Appel in the 1960s. Through years of trading it was observed that by changing the parameters of the MACD with Fibonacci proportions we achieve a better presentation of the continuity of the trend movements, making that it is possible to more efficiently detect the beginning and end of a price trend. Due to its efficiency in detecting price trends, it is also possible to identify ve
    VWAP Fibo Bands RSJ
    JETINVEST
    4.91 (11)
    VWAP Fibo Bands RSJ is an indicator that traces the lines of the daily VWAP and from it creates bands using Fibonacci proportions. This spectacular indicator creates 10 band levels through the selected VWAP period using Fibonacci ratios. It is fantastic how the prices respect each level of the bands, where it is possible to realize that almost every time the price closes above / below a level of the bands he will seek the next one. If close above will seek to reach the level above and if close
    FREE
    Trend WIN B3
    JETINVEST
    5 (4)
    Trend WIN B3 is a professional trading system created for the MT5 platform and optimized to work with MINI FUTURE INDEX (WIN) on B3 in BRAZIL. The system uses Fuzzy Logic in several timeframes (1M, 5M, 15M, 30M, H1, H4, D1) to identify the price trend, applying weights in each timeframe according to the calculations made. After identified the trend, the system positions a STOP order (BUY or SELL) according to the average volatility, and when the position is opened, the EA conducts the trade thr
    Vwap RSJ
    JETINVEST
    4.93 (14)
    VWAP RSJ is an indicator that plots the Hourly, Daily, Weekly and Monthly  VWAP Lines. Large institutional buyers and   mutual funds   use the VWAP ratio to help move into or out of stocks with as small of a market impact as possible. Therefore, when possible, institutions will try to buy below the VWAP, or sell above it. This way their actions push the price back toward the average, instead of away from it. Based on this information I developed this indicator that combines 4 types of VWAP T
    FREE
    MACD Intraday Trend PRO is an Indicator developed through an adaptation made of the original MACD created by Gerald Appel in the 1960s. Through years of trading it was observed that by changing the parameters of the MACD with Fibonacci proportions we achieve a better presentation of the continuity of the trend movements, making that it is possible to more efficiently detect the beginning and end of a price trend. Due to its efficiency in detecting price trends, it is also possible to identify ve
    This simple indicator paints with a darker color on the volume bar when the quantity traded is above the average of select number of periods of the volume itself, highlighting the moments when there was a large volume of deals above the average. It is also possible to use a configuration of four colors where the color tone shows a candle volume strength. The indicator defaults to the simple average of 20 periods, but it is possible to change to other types of averages and periods. If you like
    FREE
    This indicator calculates the difference between the SELL aggression and the BUY aggression that occurred in each Candle, plotting the balance of each one graphically. Note: This indicator DOES NOT WORK for Brokers and/or Markets WITHOUT the type of aggression (BUY or SELL). Be sure to try our   Professional   version with configurable features and alerts:   Delta Agression Volume PRO Settings Aggression by volume (Real Volume) or by number of trades (Tick Volume) Start of the Aggression De
    FREE
    This indicator sums up the difference between the sells aggression and the buys aggression that occurred in each Candle, graphically plotting the waves of accumulation of the aggression volumes.   Through these waves an exponential average is calculated that indicates the direction of the business flow. Note: This indicator DOES NOT WORK for Brokers and/or Markets WITHOUT the type of aggression (BUY or SELL).   Be sure to try our Professional version with configurable features and alerts:  Agr
    FREE
    Sniper Major
    JETINVEST
    5 (1)
    The EA uses volatility, spread, frequency, and timing to decide when to trade. The EA uses the Limit Orders method to open Positions. In this case, the Slippage will at most be positive on executing the entries. The EA uses the Trailing Take Profit logic, as the focus of the system is to make money while protecting your capital. Most trades are closed quickly, so like a sniper headshot. Main features Does not use martingale Does not use grid Optimized currency pairs: EURUSD | GBPUSD | USDJPY
    This simple indicator paints with a darker color on the volume bar when the quantity traded is above the average of select number of periods of the volume itself, highlighting the moments when there was a large volume of deals above the average. It is also possible to use a configuration of four colors where the color tone shows a candle volume strength. The indicator defaults to the simple average of 20 periods, but it is possible to change to other types of averages and periods. If you like
    FREE
    Netting Panel RSJ
    JETINVEST
    4.2 (5)
    Funcionamento: O Painel  Netting Panel RSJ  funciona com   qualquer ativo   e em   qualquer tempo gráfico . Ele funciona em contas do tipo " Netting " e " Hedge ", mas gerencia apenas uma posição por ativo, por isso o nome   Netting.   Se ele for executado em contas do tipo " Hedge ", ele fará o gerenciamento e proteção   apenas da posição mais antiga , ou seja, da primeira posição que foi aberta por ele. Em contas " Netting " quando os botões " SELL " ou " BUY " forem pressionados,   ocorrer
    FREE
    RENKO PRICE ACTION ATR is an "Expert Advisor" developed through the construction of the Renko Chart where each BRICK has the size calculated through the ATR of the period selected by the user. Renko charts are designed to filter out minor price movements, thus making it easier for traders to focus on important trends. Due to its efficiency in detecting price trends, it is also possible to clearly identify supports and resistances as well as top and bottom divergences, thus making better use of t
    The indicator Supply Demand RSJ PRO calculates and plots the "Supply" and "Demand" zones on the graph, identifying the type of Zone (Weak, Strong, Verified, Proven) and in case of retests of the Zone it shows how many times it was retested. "Supply" Zones are the price zones where more supply than demand has occurred, driving prices down. "Demand" Zones are the price zones where more demand than supply has occurred, pushing prices up. Be sure to try our professional version with configurable f
    Aggression Wave PRO is an indicator developed to monitor the divergence, strength, and continuity of the aggression volume of sell and buy negotiations.  The  Agrression Wave PRO   has features that allow you to view beyond the accumulated delta volume of the day. Note: This indicator DOES NOT WORK for Brokers and/or Markets WITHOUT the type of aggression (BUY or SELL). Cryptocurrencies and Forex do not provide this type of information, that is, it does not work with it. Operation It is pos
    The indicator Supply Demand RSJ PRO calculates and plots the "Supply" and "Demand" zones on the graph, identifying the type of Zone (Weak, Strong, Verified, Proven) and in case of retests of the Zone it shows how many times it was retested. "Supply" Zones are the price zones where more supply than demand has occurred, driving prices down. "Demand" Zones are the price zones where more demand than supply has occurred, pushing prices up. Classification of zones Weak: Price region which, if re-te
    Trend WDO B3
    JETINVEST
    5 (2)
    Trend WDO B3 is a professional trading system created for the MT5 platform and optimized to work with MINI DOLAR INDEX (WDO) on B3 in BRAZIL. The system uses Fuzzy Logic in several timeframes (1M, 5M, 15M, 30M, H1, H4, D1) to identify the price trend, applying weights in each timeframe according to the calculations made. After identified the trend, the system positions a STOP order (BUY or SELL) according to the average volatility, and when the position is opened, the EA conducts the trade thro
    SniperBot EURUSD
    JETINVEST
    5 (1)
    The EA uses volatility, spread, frequency, and timing to decide when to trade. The EA uses the Limit Orders method to open Positions. In this case, the Slippage will at most be positive on executing the entries. The EA uses the Trailing Take Profit logic, as the focus of the system is to make money while protecting your capital. Most trades are closed quickly, so like a sniper headshot. Main features Does not use martingale Does not use grid Optimized currency pair: EURUSD Timeframe: M5 PAY A
    JetBot
    JETINVEST
    This is an EXPERT with a FOCUS on LEARNING and PROFESSIONAL DEVELOPMENT!!! The idea of this product is to commercialize the source code, allowing those who want to develop their own robots, or start a professional activity developing customized experts, to have a reference source code that helps them in the learning and development process. This source code will be increased, that is, new functionalities will be created, thus allowing the project to continue evolving. For every 10 sales a new v
    This is an EXPERT with a FOCUS on LEARNING and PROFESSIONAL DEVELOPMENT!!! The idea of this product is to commercialize the source code, allowing those who want to develop their own robots, or start a professional activity developing customized experts, to have a reference source code that helps them in the learning and development process. This source code will be increased, that is, new functionalities will be created, thus allowing the project to continue evolving. For every 10 sales a new v
    This is an EXPERT with a FOCUS on LEARNING and PROFESSIONAL DEVELOPMENT!!! The idea of this product is to commercialize the source code, allowing those who want to develop their own robots, or start a professional activity developing customized experts, to have a reference source code that helps them in the learning and development process. This source code will be increased, that is, new functionalities will be created, thus allowing the project to continue evolving. For every 10 sales a new v
    Filter:
    Σάκης Καρανικόλας
    33
     

    I recently downloaded an indicator for MT5, and I must say it's proven to be an incredibly useful tool for my trading endeavors. What I appreciate most about this indicator is its simplicity and functionality. It has streamlined my trading process and made it much more efficient. The user-friendly interface and straightforward design make it easy for even beginners to navigate. It doesn't overwhelm me with unnecessary features or complex settings, which is a common issue with many trading apps. Instead, it provides the essential tools and information I need to make well-informed decisions. However, if I could suggest one improvement, it would be to have the option to change the starting point for the count. To start from the normal opening of the market (RTH). Overall, I'm quite pleased with this indicator!

    JETINVEST
    245099
    Reply from developer Roberto Sant Ana Junqueira 2023.10.24 18:41
    tks
    sergiotanb
    14
    sergiotanb 2023.09.05 00:43 
     

    Muito bom

    JETINVEST
    245099
    Reply from developer Roberto Sant Ana Junqueira 2023.09.05 00:43
    obrigado pelo review
    marcelotk
    14
    marcelotk 2023.08.12 16:22 
     

    Prático... Muito útil... Fácil de configurar.. gostei muito

    JETINVEST
    245099
    Reply from developer Roberto Sant Ana Junqueira 2023.08.12 16:27
    obrigado pelo review
    gfedrigo
    94
    gfedrigo 2021.10.15 13:19 
     

    great tool

    JETINVEST
    245099
    Reply from developer Roberto Sant Ana Junqueira 2023.02.07 23:33
    tks
    Diogo Gomes
    190
    Diogo Gomes 2021.09.26 14:14 
     

    obrigado

    JETINVEST
    245099
    Reply from developer Roberto Sant Ana Junqueira 2021.09.26 16:27
    Obrigado pelo review
    Fabio_Novaes
    175
    Fabio_Novaes 2021.06.30 21:41 
     

    como estava sentindo falta desse contador, obrigado!

    JETINVEST
    245099
    Reply from developer Roberto Sant Ana Junqueira 2021.06.30 23:09
    tks
    Robson Souza
    122
    Robson Souza 2021.06.30 14:56 
     

    User didn't leave any comment to the rating

    JETINVEST
    245099
    Reply from developer Roberto Sant Ana Junqueira 2021.06.30 15:08
    Hi Robson, tks for your review.
    Marilise Ravaglio Da Cunha Junqueira
    386
     

    User didn't leave any comment to the rating

    JETINVEST
    245099
    Reply from developer Roberto Sant Ana Junqueira 2021.06.30 15:09
    Obrigado pelo review Marilise.
    Reply to review
    Version 2.0 2021.09.21
    Add some input parameters:
    - Plot Numbers Config
    - Distance from Candle
    - Font Size