Unfortunately, "VolumeReduction" is unavailable
You can check out other products of Vasyl Temchenko:

This little script will brighten your life.
Below is its code, you can insert it into OnInit of any robot.
Or change the colors and scale to suit your taste #property copyright "V.Temchenko Skype:vasily.temchenko" #property link " Mailto:tvp.prog.96 @gmail.com" #property version "1.00" #property strict #property description "Have questions? Skype: vasily.temchenko Viber: +38098 800-6-800" ; #property description "If the voice - only Russian, Ukrainian or Belarusian" ; #proper
FREE

Indicatorless robot with a graphical interface . Automatic, semi-automatic and manual trading. Dozens of settings options - from conservative long-term trading to aggressive grid martingale. Intuitive interface, easy customization.
Full controllability in the tester's visual mode.
Smart trailing stop by distance and levels with separate parameters for the first (most profitable) and subsequent trades. The trailing distance dynamically increases with the profit growth. But, if the movement stop

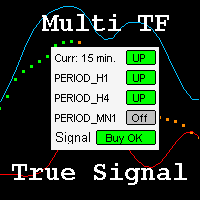
This is a function in the indicator shell. Generates a trading signal for a specified number of TFs (from 1 to 4). The indicators supplied with the terminal are not used . The basic calculation is made using the MACD formula , but using a modified third generation EMA (responds more quickly to a sudden change in trend).
In addition, the function:
- draws two bands showing the strength of the trend.
- detects the moment of trend change to the opposite one and informs about it with an ale

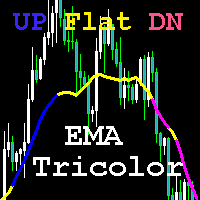
The indicator compares with the Difer constant the ClosePrice difference between the offset point Point1 and Bar1 (the last closed bar). If the value is positive and exceeds Difer , then the Blue line is drawn, which corresponds to the UP-trend . If the value is negative and exceeds Difer , the Magenta line is drawn, which corresponds to the DN-trend . The absence of trend ( Flat ) is indicated by the color Yellow . You can also trade by crossing the fast and slow MA. This option is preferab

The application displays data from several dozen pairs on one sheet. This allows you to quickly identify promising pairs for trading. There is no need to open and analyze dozens of charts, you will only open 3-4-5 charts and exactly the ones that need to be analyzed. See in "Comments" full size picture. The menu can be set from 1 to 30 symbols. If this is not enough, then you can add an unlimited number through the graphical interface. You can also delete unnecessary pairs there. The GUI also