EA Golden Elephant
- Experts
- Vitali Vasilenka
- Version: 20.0
- Updated: 7 December 2023
- Activations: 5
Buy an EA Golden Elephant advisor and receive an EA Thomas advisor as a gift
EA Golden Elephant is a trading advisor based on its own trend indicator. Here are some of the main advantages of this advisor: uses a unique trend indicator, which can allow you to more accurately determine the direction of price movement in the market. Trading in the direction of the trend can be more profitable since the EA is focused on capturing opportunities in accordance with the main market movement. The advisor carries out trading automatically, which allows you to avoid emotional decisions and ensures that transactions are executed in accordance with predefined parameters. EA Golden Elephant includes a risk management system, including stop losses and take profits, to effectively manage risk and preserve the trader's capital. The advisor has been tested on historical data to confirm its effectiveness, and may include parameters optimization mechanisms. The advisor provides the user with the flexibility to configure parameters in accordance with his trading preferences. The advisor is able to work on different timeframes, which allows it to be adapted to different trading styles.
Attention! After purchasing, write me a private message to get better settings and access to VIP chat.
Trend trading indicators are based on various mathematical and statistical approaches to identify and confirm the current direction of the market trend. Here are several types of indicators that are often used to evaluate a trend:
- Moving Averages: Basics: Trend indicators such as the simple moving average (SMA) or exponential moving average (EMA) calculate the average price of an asset over a period of time. They help to identify the general direction of price movement.
- Directional Movement Index (DMI): Basics: DMI measures the strength and direction of a trend. Includes plus-DMI (shows the strength of an uptrend), minus-DMI (shows the strength of a downtrend) and ADX (shows the overall strength of a trend).
- Parabolic SAR: Basics: SAR provides points that can indicate a change in trend direction. At the same time, they are located above or below the current price, depending on the direction of the trend.
- Relative Strength Index (RSI): Basics: RSI measures the speed and change of prices, signaling when an asset is becoming overbought or oversold. This can help determine the strength and sustainability of a trend.
- MACD (Moving Average Convergence Divergence): Basics: MACD compares two exponential moving averages to determine the strength and direction of a trend. Includes a signal line that confirms the direction of the trend.
- Ichimoku Kinko Hyo:Baseline: This indicator provides comprehensive trend information including cloud, base line and periodic line. It can be used to determine the strength and direction of a trend.
- Trend Lines and Channels: Basics: Drawing trend lines and channels on a chart is also a method of determining the direction of a trend. Continued movement within the channel can signal the strength of the trend.
The best broker for trading this advisor is https://bit.ly/3Nic8uL
Full description of all advisor settings - https://bit.ly/3TsIXsY
Community channel - https://bit.ly/489oY6p
Recommended pairs for trading EURUSD/GBPUSD/XAUUSD/USDCAD/NZDUSD/AUDUSD/EURJPY/
Timeframe M30 – H1
Minimum account balance $1000 (per pair)
Lot calculation 0.01 lot for every $1000 deposit
Minimum spread
Set up the advisor according to the instructions!!!
Important information!
For the first 2 weeks, trade on a demo account or cent account (to choose the best trading conditions for yourself)
Install a trading advisor on VPS
Profit from a real account Recorded every Friday (end of the trading week)
Forex/CFD trading carries a high level of risk and is not suitable for everyone.
You may lose some or all of your principal if market conditions change unfavorably.
you should only invest money that you can afford to lose, meaning that losing it will not affect your basic needs or obligations.

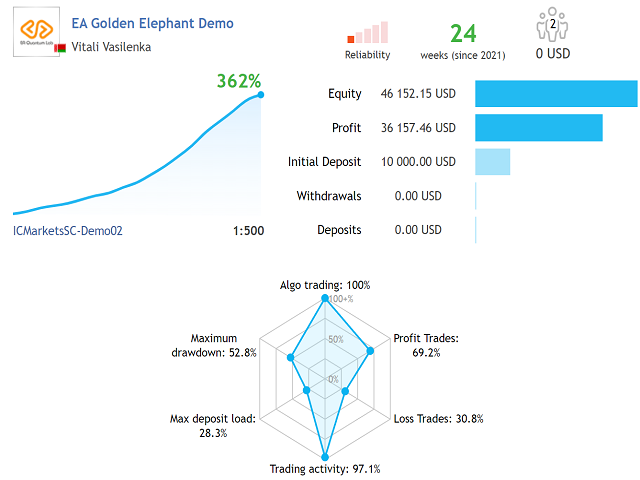
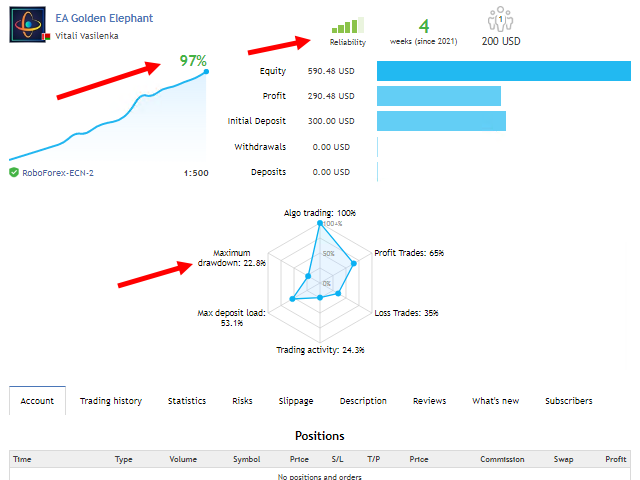
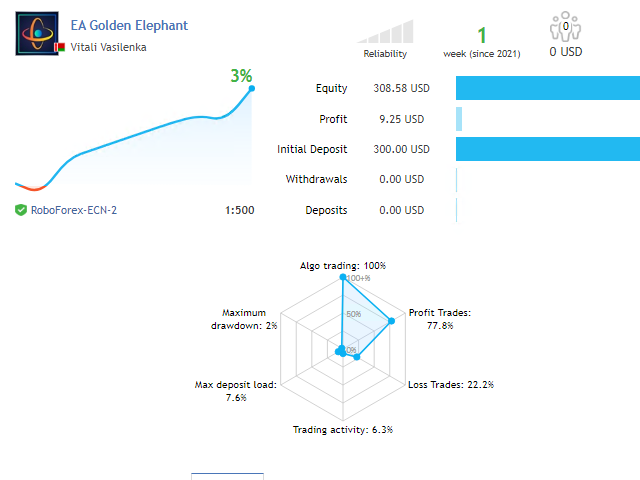











The original version of this advisor is how I discovered the great work from Vitali. For me this advisor has been amazing, it is now improved with more features and continues to perform fantastically!!! I thank Vitali and everyone from the group for the support, brilliant community.