• Overview
  • Reviews (1)
  • Comments (2)
  • What's new

ExtremeFinder

5

Description:

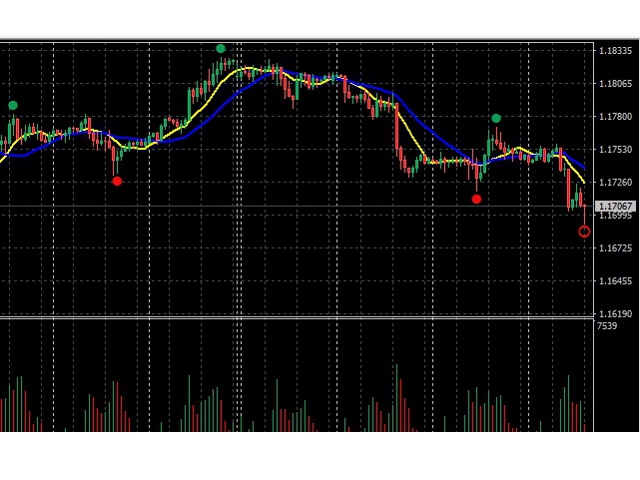
ExtremeFinder analyze chart and find local extremes - maximum and minimum. Searched extreme is always of opposite type then previous. Local extreme is confirmed when price difference is higher then set price difference, but not sooner then after set number of candles. Two different types of Local extreme confirmation are performed: Normal for common Price changes, Quick for steep Price changes. Price difference to confirm local extreme can be set as absolute value, in percent of local extreme price or as a multiple of ATR in time of local extreme. Confirmed local extreme is depicted by filled circle, unconfirmed by blank circle.

Settings:

Number of candles to confirm common extreme: When Price moving reasonably, Local extreme can't be confirmed sooner then after set number of candles. Default value is 16.

Number of candles to confirm steep extreme: When Price moving steeply (price move below previous Local min or above previous Local max), Local extreme can't be confirmed sooner then after set number of candles. Default value is 4.

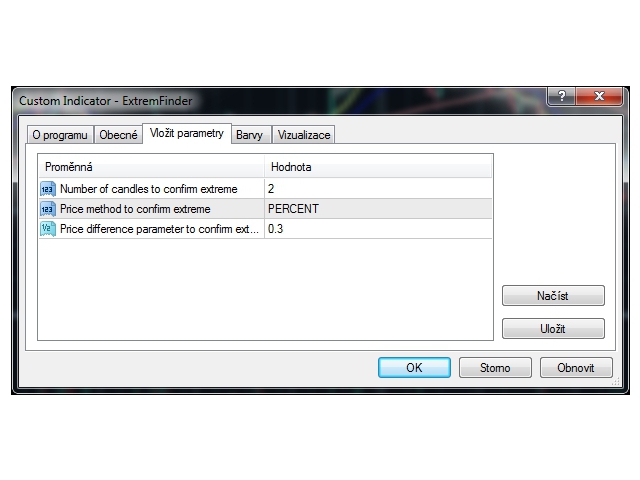
Price method to confirm extreme: Method to determine price difference to confirm local extreme. Following can be selected:

  • ABSOLUTE: Current price and local extreme price difference to confirm local extreme is set as absolute value.
  • ATR: Current price and local extreme price difference to confirm local extreme is set as multiple of ATR value in the time of local extreme.
  • PERCENT: Current price and local extreme price difference to confirm local extreme is set in percents of price of local extreme

Price difference parameter to conf. extreme: Parameter to calculate price difference to confirm local extreme. Meaning differs in dependence of previou parameter:

  • For ABSOLUTE method: Absolute price difference shall be set. Range is 0 to instrument price.
  • For ATR method: Multiple of ATR shall be set. Value shall be above 0.
    • Example: Pending local maximum price is 12300, ATR at pending local max. time is 38, Price difference parameter is 2.
    • Pending local maximum will be confirmed when price drops to 12300 - (38 * 2) = 12224.
  • For PERCENT method: Percents of local extreme price shall be set. Range is 0 to 100.

ATR period if ATR selected as conf. method: ATR period (if ATR selected as price method). Default value is 14.

Restricted free DEMO version of ExtremeFinder can be found in free section as ExtremeFinder DEMO.


Reviews 1
jmhuang
3067
jmhuang 2021.06.13 16:49 
 

very good indicator if combined with Elliott Wave analysis. Deserves 5 stars

Recommended products
PLEASE NOTE:   You can  customize the settings of all 3 EMA as per your requirement. The accuracy will change as per your settings. 100% Non repaint Pre-alert (get ready) signals Non-delay indications 24/7 signals 100% No lag No recalculating Lifetime license This is a EMA crossover indicator and its 100% non repaint indicator. The EMA_1 and the EMA_2 is based on which signal is generated. EMA_3 is a Higher EMA value which will remain below or above the candle (market) to identify the trend. M
Arrow indicator, to determine adjustments and local trends The arrow appears on the current bar and after closing the bar will not disappear. Allows you to enter the transaction at the very beginning of the movement Thanks to the flexible settings you can use on any currency pairs, metals and cryptocurrency Can be used when working with binary options Distinctive features Does not redraw. Additional parameters for fine tuning. Works on all timeframes and symbols. Suitable for trading c
MACD Alerts MT4
KEENBASE SOFTWARE SOLUTIONS
KT MACD Alerts is a personal implementation of the standard MACD indicator available in Metatrader. It provides alerts and also draws vertical lines for the below two events: When MACD crosses above the zero line. When MACD crosses below the zero line. Features It comes with an inbuilt MTF scanner, which shows the MACD direction on every time frame.  A perfect choice for traders who speculate the MACD crossovers above/below the zero line. Along with the alerts, it also draws the vertical line
Mars 6 is a  Oscillators  indicator  is a powerful indicator of  Break Zone  for any par and any timeframe. It doesn't requires any additional indicators for the trading setup.The indicator gives clear signals about opening and closing trades.This Indicator is a unique, high quality and affordable trading tool. Perfect For New Traders And Expert Traders Low risk entries. Never repaints signal. Never backpaints signal. Never recalculates signal. For MT4 Only Great For Scalping Great For Swing
KT DMA is a modified and advanced version of the classic Displaced Moving Averages with buy/sell crossover alerts and a Multi-Timeframe scanner that shows DMA's direction across each real-time time frame. A Displaced Moving Average is a simple moving average that moves ahead or backward in a time frame (either short-term or long-term). It also allows you to predict price movement more accurately. Features Depicts the trend direction using the alignment of three moving averages. Buy/Sell signa
ExtremeFinder DEMO
Matous Bartl
1 (2)
Description: ExtremeFinder DEMO analyze chart and find local extremes - maximum and minimum. Searched extreme is always of opposite type then previous. Local extreme is confirmed when price difference is higher then set price difference, but not sooner then after set number of candles. Two different types of Local extreme confirmation are performed: Normal for common Price changes, Quick for steep Price changes. Price difference to confirm local extreme can be set as absolute value, in percent
FREE
" Valiant Strong Trend " - Your Ultimate MT4 Signal Indicator Are you ready to elevate your trading game to new heights? Look no further than the "Valiant Strong Trend" MT4 signal indicator, your indispensable tool for navigating the complex world of financial markets. Key Features: Precise Trend Identification : "Valiant Strong Trend" employs advanced algorithms to accurately identify market trends, whether they are bullish or bearish. Say goodbye to guesswork and hello to informed trading deci
This indicator is based on the standard MACD indicator, but showing the changes up and down colored. It is a nice assistance to visualize our Expert MAGIC MACD. MAGIC MACD MT4: https://www.mql5.com/en/accounting/buy/market/41144?period=0 MAGIC MACD MT5: https://www.mql5.com/en/accounting/buy/market/41151?period=0 Inputs in the Indicator: Fast EMA: standard is 12 Slow EMA: standard is 26 Signal: depending on what you want to see. For the MAGIC MACD the standard is 1 in common settings: Fixe
Lisek Stochastic
Darius Hans Lischka
3 (7)
Lisek Stochastic   oscillator indicator with Alarm, Push Notifications and e-mail  Notifications. The Stochastic indicator is a momentum indicator that shows you how strong or weak the current trend is. It helps you identify overbought and oversold market conditions within a trend. The Stochastic indicator is lagging indicator, which means it don't predict where price is going, it is only providing data on where price has been !!! How to trade with Stochastic indicator: Trend following: As lon
FREE
Th3 BarPlay Signals Mt4
Nnamdi Kennedy Ifeorah
This is a Price Action/momentum based strategy know as the 3Bar_Play and it is based on the 3Bar candlestick pattern formation. Additional indicators are added for filter and confirmations prior to popping up buy/sell signal arrows. It can be traded either in an uptrend, downtrend or sideways market.  Indicators added include: Stochastic - Momentum Fish - Trend ATR - Volatility which also clearly defines Stop-Loss placement at base of signal arrow (using the ATR Stop-loss method). Risk to Reward
This indicator uses multiple indicators to generate high-winning signal trades The R Signals indicator is a complete FX trading system that prints accurate buy & sell arrows on the chart. The indicator appears in the main MT4 chart window as colored green and red arrows. Using signals generated by a single indicator can be risky while trading. This is because using just one indicator to trade can give more false signals. Thus, many forex traders used three or more indicators to filter out g
Real Trade
Thomas Bradley Butler
Real Trade trades on time frames under 1 hour.  Trade in uptrends and downtrend directions.  Trade with the higher time trend directions and trade the first candle.  Use the opposite to exit or use ratio to exit 1:1 or higher along with trailing stops.  Trade Real Trends during active hours and with higher trend direction for the best results.  Load indicator in tester to study the results and potential.  Use the scalping arrows trading with the trend or use the Fib targets or both.  Recommend f
BinaryMartini
Abdulkarim Karazon
an indicator for binary trading based on 3ma cross with macd , it gives buy and sell signals on bar open and it Doesn't Repaint or Back paint the indicator is not focused on high win rate as it is made for martingale trading , the indicator focus on lowest losing signal count in a row. Strategy : Minimum Deposit is 1000 unite , we start the trading with 1 unite (trade size is 1 unite for every 1000 capital) we double trade size on next signal if current signal lost , we only take indicator
The indicator monitors the Dinapoli MACD trend in multiple timeframes for the all markets filtered and shows the results on Dashboard. Key Features Indicator can be used for all markets Monitors every timeframe, from 1 Min to Monthly Parameters UseMarketWatch: Set true to copy all symbols available in market watch MarketWatchCount : Set the number of symbols that you want to copy from the market watch list. CustomSymbols: Enter the custom symbols that you want to be available in dashboard.
KT Psar Arrows
KEENBASE SOFTWARE SOLUTIONS
KT Psar Arrows plots the arrows on chart using the standard Parabolic SAR indicator. A bullish arrow is plotted when the candle's high touch the SAR. A bearish arrow is plotted when the candle's low touch the SAR. The signals are generated in the real-time without waiting for the bar close.  Features A beneficial tool for traders who want to experiment with the trading strategies that include the use of Parabolic Sar indicator.  Can be used to find turning points in the market. Use custom PSA
BeST_Profit Taker Exits is a Metatrader Indicator based on the corresponding vital part of Jim Berg's Trading System.It timely locates the most likely points/bars of significant Profit Taking and can be easily used as an add-on to any Trading System/Method . The Indicator consists of 2 Take Profit lines deriving as (MA ± times the ATR) usually the upper one above the prices (for Long Trades) and the lower one below prices (for Short Trades). When the Close (or High by choice) of a bar is above
Introducing the Donchian Channels indicator for MQL4, a powerful technical analysis tool designed to boost your trading success. This indicator consists of four lines that represent the upper and lower boundaries of price movement over a specified period. With the Donchian Channels indicator, you can easily identify potential breakouts and reversals in the market. The upper line shows the highest high of the specified period, while the lower line represents the lowest low. The space between thes
Technical Indicator for Detecting Strong Price Action Patterns: Pin Bar, Inside Bar, and Outside Bar Introduction: In the realm of technical analysis, price action patterns serve as vital indicators of potential market movements. We've developed a sophisticated technical indicator that streamlines the identification of robust price action patterns on charts. Our indicator specializes in detecting three essential patterns: Pin Bar, Inside Bar, and Outside Bar. Key Patterns Detected: Pin Bar: The
ASC Signal AM
Andriy Matviyevs'kyy
A popular signal indicator marking buy/sell points. In this version, it is supplemented with optimal SL points. Recommended for use in conjunction with a trend indicator to filter signals. The indicator has only one adjustable parameter that determines its sensitivity, which greatly simplifies setting the indicator to the current market and the user's trading style. Indicator signals are given only after the full formation of the bar. The indicator can be used to trade any market. Its basic para
MACD Scanner With Alerts
Niravkumar Maganbhai Patel
4 (1)
MACD Dashboard Panel   This indicator helps you to scan symbols which are in the Market Watch window and filter out a trend according to MACD. Moving Average Convergence Divergence (MACD) is a trend-following momentum indicator that shows the relationship between two moving averages of a security’s price. The MACD is calculated by subtracting the 26-period Exponential Moving Average (EMA) from the 12-period EMA. The result of that calculation is the MACD line. A nine-day EMA of the MACD call
FREE
The intelligent algorithm of the Trend Detects indicator shows the points of potential market reversal. Strategy for trend trading, filtering market noise and all the necessary functions built into one tool! The system itself shows in the form of arrows when to buy and when to sell. Uses only one parameter for settings. Simple, visual and effective trend detection. Most often, a good trend is visible on the price chart visually. But an experienced trader must clearly understand the current ba
This indicator is designed to find the difference in MACD price and indicator.  This indicator shows the price and indicator difference on the screen. The user is alerted with the alert sending feature. Our Popular Products Super Oscillator HC Cross Signal Super Cross Trend Strong Trend Super Signal Parameters divergenceDepth -  Depth of 2nd ref. point search Fast ema -  Fast ema setting Slow ema - slow ema setting MACD sma - macd sma setting indAppliedPrice -  Applied price of indicator indMA
Trend Suffer
Philip Effiong Philip
Alerts you on new trends, with ENTRY and EXIT points. INSTRUCTIONS  Select asset of choice, activate the indicator on the chart and just follow the signals from the arrows. ITS FREE, GIVE ME A GOOD RATING! Platform : Metatrader4 Asset : All Currencies, Gold, BTCUSD, NASDAQ PS : F or newbie and pro traders. Used by more 3,000 traders around the world. Send  a mail for further help and information...........
Arrows appear after Reversal-Pattern and when the confirmation-candle reaches its value, it won't disappear (no repaint). but with fix settings no additional settings necessary Entry : immediately after arrow Stop loss : a few pips above the high of the arrow - candle / below the low of the arrow - candle Take Profit : at least the next candle / move to break even after candle closed / trail the SL works on : Major Forex-pairs / M15 and higher time-frames The Value of the  confirmation-candle =>
RSI Divergence Scanner
Reza Aghajanpour
4.5 (14)
** All Symbols x All Timeframes scan just by pressing scanner button ** ***Contact me after purchase to send you instructions and add you in "RSI scanner group" for sharing or seeing experiences with other users. Introduction RSI divergence is a main technique used to determine trend reversing when it’s time to sell or buy because prices are likely to drop or pick in the charts. The RSI Divergence indicator can help you locate the top and bottom of the market. This indicator finds Regular div
KT De Munyuk MT4
KEENBASE SOFTWARE SOLUTIONS
The KT De Munyuk is a trend-based indicator that uses   Parabolic SAR   to identify the market direction. The indicator shows the PSAR in the form of green/red dots using a separate window. Buy Signal:   When a green dot appears after a series of at least three red dots. Buy Exit:   When a red dot appears on the current or next higher time frame. Sell Signal:   When a red dot appears after a series of at least three green dots. Sell Exit:   When a green dot appears on the current or next higher
Probe arrow
Gbenga Ayodele
Just an excellent arrow indicator with 96 percent accuracy. It uses trend moving averages to detect trend direction change and alert with corresponding arrow. It does not repaint and the alert is optional on the basis of current bar or previous bar. Please this indicator is not responsible for every of your trading  position and it must be used in conjunction with other indicators to  make trading.
A useful scanner/dashboard that shows the RSI values for multiple symbols and time-frames. It can be easily hidden/displayed with a simple click on the scanner man top left of the dashboard. You can input upper and lower RSI values and the colours can be set to show when above/below these values. The default values are 70 and 30. There are also input colours for when the RSI is above or below 50 (but not exceeding the upper/lower levels Symbols and time-frames are input separated by comma
This indicator shows in a subwindow the trend in M1, M5, H1, D1 timeframes based on MA, MACD, Stochastic This way you could see in once in different timeframes what happening.  This is my first free indicator. Please follow I will put here some more. Thank you for you attention.  . . . . . lfknglkslksnlgslgnsflgjrpoesv ,msv lkrjpfjésmdg sd.npo4wsmdglknsp4jwpkeégmfs.lkmp Thank you
FREE
Global Trend
Vitalii Zakharuk
Global Trend Indicator, shows the signals for entry. Displays both entry points and the trend itself. Shows statistically calculated moments for entering the market with arrows. When using the indicator, the risk factor can be optimally distributed. Settings: Uses all one parameter for settings. Choosing a parameter, it is necessary to visually resemble it so that the appropriate graph has a projection of extremes. Parameters: Length - the number of bars for calculating the indicator.
Buyers of this product also purchase
Gann Made Easy
Oleg Rodin
4.95 (43)
Gann Made Easy is a professional and easy to use Forex trading system which is based on the best principles of trading using the theory of mr. W.D. Gann. The indicator provides accurate BUY and SELL signals including Stop Loss and Take Profit Levels. You can trade even on the go using PUSH notifications. PLEASE CONTACT ME AFTER PURCHASE TO GET MY TRADING TIPS PLUS A GREAT BONUS! Probably you heard already many times about Gann trading methods. Usually Gann's theory is very complex thing not only
Introducing the Miraculous Forex Indicator: Unleash the Power of Precision Trading Are you tired of searching for the perfect forex indicator that truly delivers exceptional results across all time frames? Look no further! The Miraculous Forex Indicator has arrived to revolutionize your trading experience and propel your profits to new heights. Built upon a foundation of cutting-edge technology and years of meticulous development, the Miraculous Forex Indicator stands as the pinnacle of str
Currently 20% OFF ! Best Solution for any Newbie or Expert Trader! This dashboard software is working on 28 currency pairs plus one. It is based on 2 of our main indicators (Advanced Currency Strength 28 and Advanced Currency Impulse). It gives a great overview of the entire Forex market plus Gold or 1 indices. It shows Advanced Currency Strength values, currency speed of movement and signals for 28 Forex pairs in all (9) timeframes. Imagine how your trading will improve when you can watch the e
TPSproTREND PrO
Roman Podpora
5 (15)
TPSpro TRENDPRO  - is a trend indicator that automatically analyzes the market and provides information about the trend and each of its changes, as well as giving signals for entering trades without redrawing! The indicator uses each candle, analyzing them separately. referring to different impulses - up or down impulse. Exact entry points into transactions for currencies, crypto, metals, stocks, indices!  -  Version MT5               DETAILED DESCRIPTION        /       TRADING SETUPS           
TPSpro RFI Levels
Roman Podpora
5 (13)
A key element in trading is zones or levels from which decisions to buy or sell a trading instrument are made. Despite attempts by major players to conceal their presence in the market, they inevitably leave traces. Our task was to learn how to identify these traces and interpret them correctly. Reversal First Impulse levels (RFI)   -  Version MT5                INSTRUCTIONS                 RUS                 ENG                                       R ecommended to use with an indicator   -  
CURRENTLY 26% OFF Best Solution for any Newbie or Expert Trader! This Indicator is a unique, high quality and affordable trading tool because we have incorporated a number of proprietary features and a new formula. With only ONE chart you can read Currency Strength for 28 Forex pairs! Imagine how your trading will improve because you are able to pinpoint the exact trigger point of a new trend or scalping opportunity? User manual: click here That's the first one, the original! Don't buy a worthle
Atomic Analyst
Issam Kassas
5 (1)
First of all Its worth emphasizing here that this Trading Indicator is   Non-Repainting ,   Non-Redrawing   and   Non-Lagging   Indicator, Which makes it ideal from both manual and robot trading.  The Atomic Analyst  is a PA Price Action Indicator that uses Strength and Momentum of the price to find a better edge in the market. Equipped with Advanced filters which help remove noises and false signals, and Increase Trading Potential. Using Multiple layers of complex Indicators, the Atomic Anal
Scalper Inside PRO
Alexey Minkov
4.75 (55)
An exclusive indicator that utilizes an innovative algorithm to swiftly and accurately determine the market trend. The indicator automatically calculates opening, closing, and profit levels, providing detailed trading statistics. With these features, you can choose the most appropriate trading instrument for the current market conditions. Additionally, you can easily integrate your own arrow indicators into Scalper Inside Pro to quickly evaluate their statistics and profitability. Scalper Inside
Trend Screener
STE S.S.COMPANY
4.83 (86)
Unlock the Power of  Trends trading with Trend Screener Indicator: Your Ultimate Trend Trading Solution powered by fuzzy logic and Multi-currencies System ! Elevate your trend trading with Trend Screener, the revolutionary trend indicator powered by   fuzzy logic.  It is a powerful trend-following indicator that combines over  13 premium tools and features and 3 trading strategies  , making it a versatile choice to   make your Metatrader a Trend Analyzer. LIMITED TIME OFFER : Trend Screener Indi
TrendMaestro
Stefano Frisetti
5 (2)
note: this indicator is for METATRADER4, if you want the version for METATRADER5 this is the link: TRENDMAESTRO recognizes a new TREND in the bud, he never makes mistakes. The certainty of identifying a new TREND is priceless. DESCRIPTION TRENDMAESTRO identifies a new TREND in the bud, this indicator examines the volatility, volumes and momentum to identify the moment in which there is an explosion of one or more of these data and therefore the moment in which prices have strong probability of f
First of all Its worth emphasizing here that this Trading Tool is Non-Repainting Non-Redrawing and Non-Lagging Indicator Which makes it ideal for professional trading . The Smart Price Action Concepts Indicator is a very powerful tool for both new and experienced traders . It packs more than 20 useful indicators into one combining advanced trading ideas like Inner Circle Trader Analysis and Smart Money Concepts Trading Strategies . This indicator focuses on Smart Money Concepts providing in
XQ Indicator MetaTrader 4
Marzena Maria Szmit
3 (2)
Step into the realm of Forex trading with confidence and precision using XQ, a cutting-edge Forex indicator designed to elevate your trading game to unprecedented heights. Whether you're a seasoned trader or just stepping into the world of currency exchange,   XQ Forex Indicator   empowers you with the insights and signals needed to make informed trading decisions. The signal conditions are a combination of three indicators, and XQ Forex Indicator only display  medium and long-term trends . The
Discover the Secret to Successful Forex Trading with Our Custom MT4 Indicator! Have you ever wondered how to achieve success in the Forex market, consistently earning profits while minimizing risk? Here is the answer you've been searching for! Allow us to introduce our proprietary MT4 indicator that will revolutionize your approach to trading. Unique Versatility Our indicator is specially designed for users who prefer Renko and Rangebar candle formations. We understand that these chart types are
Currency Strength Wizard is a very powerful indicator that provides you with all-in-one solution for successful trading. The indicator calculates the power of this or that forex pair using the data of all currencies on multiple time frames. This data is represented in a form of easy to use currency index and currency power lines which you can use to see the power of this or that currency. All you need is attach the indicator to the chart you want to trade and the indicator will show you real str
Advanced Supply Demand
Bernhard Schweigert
4.92 (310)
CURRENTLY 26% OFF !! Best Solution for any Newbie or Expert Trader! This indicator is a unique, high quality and affordable trading tool because we have incorporated a number of proprietary features and a new formula. With this update, you will be able to show double timeframe zones. You will not only be able to show a higher TF but to show both, the chart TF, PLUS the higher TF: SHOWING NESTED ZONES. All Supply Demand traders will love it. :) Important Information Revealed Maximize the potenti
Introducing   Quantum Trend Sniper Indicator , the groundbreaking MQL5 Indicator that's transforming the way you identify and trade trend reversals! Developed by a team of experienced traders with trading experience of over 13 years,   Quantum Trend Sniper Indicator   is designed to propel your trading journey to new heights with its innovative way of identifying trend reversals with extremely high accuracy. ***Buy Quantum Trend Sniper Indicator and you could get Quantum Breakout Indicator fo
Quantum Breakout Indicator PRO
Bogdan Ion Puscasu
4.96 (26)
Introducing   Quantum Breakout PRO , the groundbreaking MQL5 Indicator that's transforming the way you trade Breakout Zones! Developed by a team of experienced traders with trading experience of over 13 years, Quantum Breakout PRO is designed to propel your trading journey to new heights with its innovative and dynamic breakout zone strategy. Quantum Breakout Indicator will give you signal arrows on breakout zones with 5 profit target zones and stop loss suggestion based on the breakout box.
Quantum Heiken Ashi PRO MT4
Bogdan Ion Puscasu
4.43 (7)
Introducing the   Quantum Heiken Ashi PRO charts with alerts Designed to provide clear insights into market trends, the Heiken Ashi candles are renowned for their ability to filter out noise and eliminate false signals. Say goodbye to confusing price fluctuations and hello to a smoother, more reliable chart representation. Buy  Quantum Heiken Ashi PRO and you could  get Quantum Breakout Indicator or Quantum Trend Sniper Indicator for free. Ask us how with a private message. What makes the Qua
Introducing ON Trade Waves Patterns Harmonic Elliot Wolfe, an advanced indicator designed to detect various market patterns using both manual and automated methods. Here's how it works: Harmonic Patterns: This indicator can identify harmonic patterns that appear on your chart. These patterns are essential for traders practicing harmonic trading theory, as popularized by Scott Carney's book "Harmonic Trading vol 1&2." Whether you draw them manually or rely on automated detection, ON Trade Waves
Scalper Vault
Oleg Rodin
5 (27)
Scalper Vault is a professional scalping system which provides you with everything you need for successful scalping. This indicator is a complete trading system which can be used by forex and binary options traders. The recommended time frame is M5. The system provides you with accurate arrow signals in the direction of the trend. It also provides you with top and bottom signals and Gann market levels. The indicator provides all types of alerts including PUSH notifications. Please contact me aft
PRO Renko System
Oleg Rodin
5 (24)
PRO Renko System is a highly accurate trading system specially designed for trading RENKO charts. The ARROWS and Trend Indicators DO NOT REPAINT! The system effectively neutralizes so called market noise giving you access to accurate reversal signals. The indicator is very easy to use and has only one parameter responsible for signal generation. You can easily adapt the tool to any trading instrument of your choice and the size of the renko bar. I am always ready to provide extra support to help
FX Power MT4 NG
Daniel Stein
5 (8)
Trading GOLD, and currencies, with the dog walk strategy  - super smart Trading GOLD, and currencies, with the breakout strategy  - super easy Visit our all-new   Stein Investments Welcome Page   to get the latest information, updates and trading strategies. FX Power MT4 NG  is the next generation of our long-time very popular currency strength meter, FX Power.  And what does this next-generation strength meter offer? Everything you have loved about the original FX Power  PLUS GOLD/XAU stre
Advanced Currency IMPULSE with ALERT
Bernhard Schweigert
4.91 (493)
CURRENTLY 31% OFF !! Best Solution for any Newbie or Expert Trader! This indicator is a unique, high quality and affordable trading tool because we have incorporated a number of proprietary features and a secret formula. With only ONE chart it gives Alerts for all 28 currency pairs. Imagine how your trading will improve because you are able to pinpoint the exact trigger point of a new trend or scalping opportunity! Built on new underlying algorithms it makes it even easier to identify and confir
First of all Its worth emphasizing here that this Trading System is Non-Repainting, Non-Redrawing and Non-Lagging Indicator, Which makes it ideal for professional trading. The "Smart Support and Resistance Trading System" is an advanced indicator tailored for  new  and  experienced  traders. It empowers traders with precision and confidence in the forex market. This comprehensive system combines 7+ strategies, 10 indicators, and various trading approaches, including day trading strategy, swing
TrendDecoder Premium
Christophe, Pa Trouillas
5 (2)
Identify ranges  | Get earliest signals of Trends  | Get clear exits before reversal  | Spot the Fibo levels the price will test Non-repainting, non-delayed indicator - ideal for manual and automated trading - for all assets and all time units $69   for launch - then back to >>   $149 After purchase,   please contact me on this channel   for recommended and personalised settings MT5   version:  Click here Get our full method with  BladeSCALPER  and   PowerZONES What is it about? TrendDECOD
Introducing the Zeus Indicator: Your Ultimate Profit-Breakthrough Trading Tool. This indicator simplifies trading, eliminating the need for in-depth analysis with breakout strategies. It automatically draws zones based on your preset timeframes, suggests Stop Loss (SL), Take Profit (TP), and Trailing Stop levels. The Zeus Indicator will promptly notify you and display signal arrows as the price approaches buy or sell entry points. It also offers recommendations for four different take profi
Cycle Sniper
Elmira Memish
4.41 (34)
NEW YEAR SALE PRICE FOR LIMITED TIME!!! Please contact us after your purchase and we will send you the complimentary indicators to complete the system Cycle Sniper is not a holy grail but when you use it in a system which is explained in the videos, you will feel the difference. If you are not willing to focus on the charts designed with Cycle Sniper and other free tools we provide, we recommend not buying this indicator. We recommend watching the videos about the indiactor and system before pu
TakePropips Donchian Trend Pro
Eric John Pajarillaga Aldana
4.82 (17)
TakePropips Donchian Trend Pro  (MT4) is a powerful and effective tool that automatically detects the direction of the trend using the Donchian Channel and provides you with an entry and exit trading signals! This multi-function indicator includes a trend scanner, trading signals, statistical panel, screener, trading sessions, and alerts history dashboard. It is designed to provide you with trading signals and save you hours analyzing the charts! You can download the user manual and installation
Trend Forecasting
Mohamed Hassan
5 (10)
This indicator is unstoppable when combined with our other indicator called Katana . After purchase, send us a message and you could get Katana  for FREE as a BONUS!  You can also ask to join our private group where we discuss together with other members!  MT5 version: click here There are limited copies available at $45 (3 copies left). Next price is $99. Don't miss this great deal!  The Trend Forecasting indicator is a very unique & easy tool that is able to make prediction a
IX Power MT4
Daniel Stein
5 (5)
IX Power finally brings the unbeatable precision of FX Power to non-Forex symbols. It accurately determines the intensity of short, medium and long-term trends in your favourite indices, stocks, commodities, ETFs, and even cryptocurrencies. You can analyse everything your terminal has to offer. Try it out and experience how your timing improves significantly when trading. Read about our latest strategic development -  Easy scalping with IX Power Visit our all-new   Stein Investments Welcome
More from author
ContiStat restricted - Free DEMO version of the ContiStat indicator Free version of the indicator is ment as DEMO of full paid version. Full functionality is available, however The indicator work only on M30 chart period . Find the ContiStat indicator for full functionality Brief description The ContiStat indicator calculate statistic frequency of green (up) and red (down) movement in the chart and determine movement dynamics (silver curve). There are two key parameters to understand the Conti
FREE
ExtremeFinder DEMO
Matous Bartl
1 (2)
Description: ExtremeFinder DEMO analyze chart and find local extremes - maximum and minimum. Searched extreme is always of opposite type then previous. Local extreme is confirmed when price difference is higher then set price difference, but not sooner then after set number of candles. Two different types of Local extreme confirmation are performed: Normal for common Price changes, Quick for steep Price changes. Price difference to confirm local extreme can be set as absolute value, in percent
FREE
ContiStat restricted - Free DEMO version of the ContiStat indicator Free version of the indicator is ment as DEMO of full paid version. Full functionality is available, however The indicator work only on M30 chart period . Find the ContiStat indicator for full functionality Brief description The ContiStat indicator calculate statistic frequency of green (up) and red (down) movement in the chart and determine movement dynamics (silver curve). There are two key parameters to understand the Cont
FREE
Brief description TrendWatch DEMO indicator analyze chart trend strength and acceleration. Analysis is based on close price SMA with configurable period. Result is given as set of two curves in the indicator window. Blue (default color) curve identify trend direction and strength. Yellow curve (default color) identify trend tendency to accelerate/deceleare. Scale of curves is normed to maximal value in given time period. DEMO version is restricted. See list of restrictions at the bottom. Find
FREE
DataGrabber store selected instrument history to .csv files. It's purpose is to automatically create extensive history database. DataGrabber is added to the selected instrument chart window as an indicator. It periodically check presence of bar data on the server and presence of .csv files on client PC (local database). If missing files detected in local database, it's created, filled with data and added to the database. Range of bar history in days beeing checked on server is configurabl
FREE
DataGrabber The database creator DataGrabber store selected instrument history to .csv files. It's purpose is to automatically create extensive history database. DataGrabber is added to the selected instrument chart window as an indicator. It periodically check presence of bar data on the server and presence of .csv files on client PC (local database). If missing files detected in local database, it's created, filled with data and added to the database. Range of bar history in days bee
Brief description TrendWatch indicator analyze chart trend strength and acceleration. Analysis is based on close price SMA with configurable period. Result is given as set of two curves in the indicator window. Blue (default color) curve identify trend direction and strength. Yellow curve (default color) identify trend tendency to accelerate/deceleare. Scale of curves is normed to maximal value in given time period. Both curves can be additionally smoothed using configurable SMA and/or set to
ContiStat
Matous Bartl
Brief description The ContiStat indicator calculate statistic frequency of green (up) and red (down) movement in the chart and determine movement dynamics (silver curve). There are two key parameters to understand the ContiStat principle: Block height and Block count . The ContiStat engine convert instrument price chart move to Blocks of constant height (price) regardles of how much time it take. Example 1: Block height is set to 50. DE30 index price make move from 15230 to 15443 in an hour. 4 g
Filter:
jmhuang
3067
jmhuang 2021.06.13 16:49 
 

very good indicator if combined with Elliott Wave analysis. Deserves 5 stars

Matous Bartl
2430
Reply from developer Matous Bartl 2021.09.03 14:28
Many thanks for review.
Reply to review
Version 3.20 2022.02.27
Alerts and defaults has been added for improper color setting - invisible low / high extreme points
Version 3.10 2021.12.26
Unused parameters deleted
Version 3.0 2021.12.26
New etreme detection engine implemented. In case of inconveniences, please downgread to version 2.10 and give me a feedback.
Version 2.10 2020.11.10
Minor bugfix: Local extreme Rate Index distance calculation fixed
Version 2.0 2020.11.10
Major update: Output data available in the indicator buffers. ExtremeFinder can be used with iCustom() MQL4 function now.

Buxfix: Multiple detection/graphic objects for one local extreme (mark repainting) bug found and fixed
Version 1.10 2020.10.19
"ATR multiple" added as a method to estimate extreme and current price difference to confirm local extreme