Double HMA MTF for MT5
- Indicators
- Pavel Zamoshnikov
- Version: 3.1
- Updated: 2 June 2021
- Activations: 8
This is an advanced multi-timeframe version of the popular Hull Moving Average (HMA)
Features
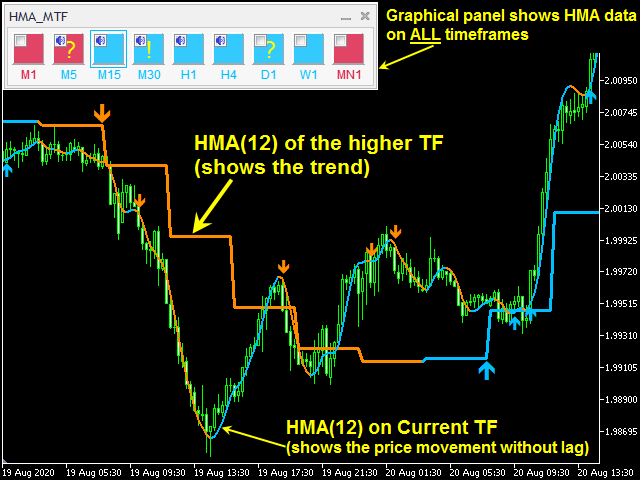
- Two lines of the Hull indicator of different timeframes on the same chart. The HMA line of the higher timeframe defines the trend, and the HMA line of the current timeframe defines the short-term price movements.
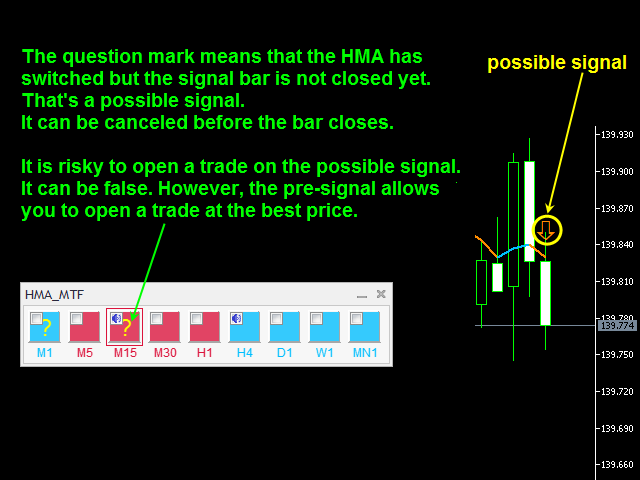
- A graphical panel with HMA indicator data from all timeframes at the same time. If the HMA switched its direction on any timeframe, the panel displays a question or exclamation mark with a text and audio message. Customize separate messages for each timeframe using the appropriate checkboxes.
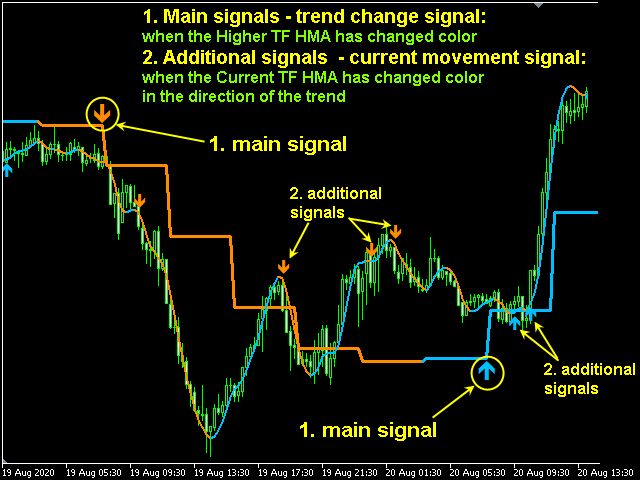
- Convenient visual signals of entry points in the form of arrows on the chart:
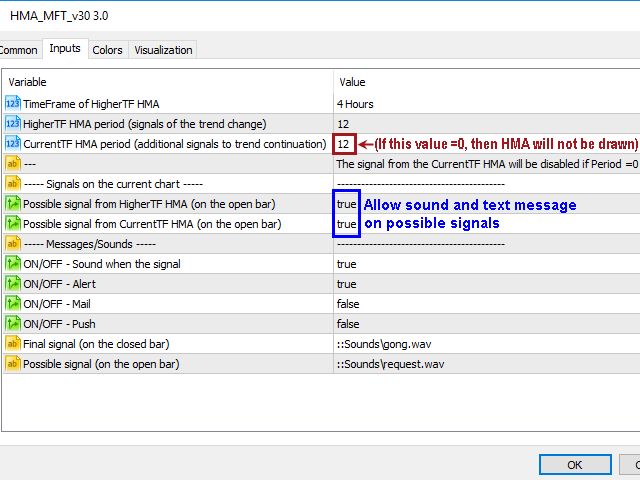
- A preliminary signal is generated when the color of the HMA line switches when the bar is not closed yet. The pre-signal is displayed with a transparent arrow on the indicator line and a question mark on the graphical panel. It is risky to open a position on this signal, because it may be canceled if the HMA color recovers before the close of the bar. However, the preliminary signal allows you to open a trade at the best price. The pre-signal can be turned off.
- A final signal is formed when the color of the HMA line switches and the bar has already closed. This signal is never redrawn again. The final signal is shown with a bold arrow on the indicator line and an exclamation mark on the graphical panel.
- Information about the signal is displayed in the Alert window and is duplicated by sound. Sending email messages and push messages to mobile devices is also supported.
"Double HMA MTF for MT4" - analogue for the MetaTrader4 platform
"Double HMA MTF for MT4 Light" - free simplified version for easy visualization of the indicator’s job
How do I use the indicator?
Watch the video for more information about using the indicator
The main idea behind my indicator:
the Hull Moving Average line with a period of 10-12 repeats the price movement almost without lag, while smoothing out the noise well.
Install the simple HMA(12) indicator on any instrument and any timeframe and you will see how this indicator line describes the current movement well!
The indicator draws two HMA lines on the chart - the current and the higher timeframe. HMA(12) of the current TF gives the current price movement (we can say that this is a wave of the current TF), and HMA(12) of a higher TF shows a trend (that is, it is a wave of a higher TF).
1. Open a trade when the final signal arrow appears on the HMA line of the higher TF.2. You can open an additional deal at the 1st signal of the current TF towards the higher TF, if this entry point is at a better price.
3. Set StopLoss for the lowest point.
4. Look for a profit-taking level when the HMA of the higher TF makes 4-6 bars in this direction or move the StopLoss below the nearest fractal. You can also take profits at support/resistance levels, “round” levels, Fibonacci levels.









Can you help me change all the signals, including the ship type signal, to up red and down green? In addition, can you add a calculation method of optional closing price, opening price, maximum price, minimum price and average price? Thank you. If you feel troublesome, just change the color, thank you!!! Please send it to my mailbox; Youcaoyong@outlook.com
Thank you very much!