• Overview
  • Reviews (3)
  • Comments (6)
  • What's new

UPD1 Pivot Levels

5

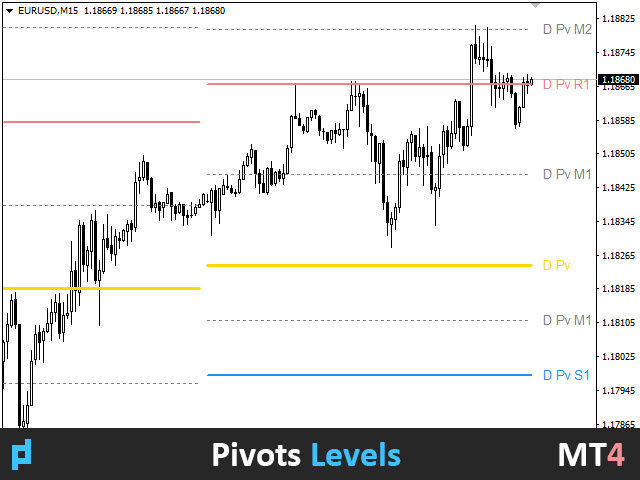
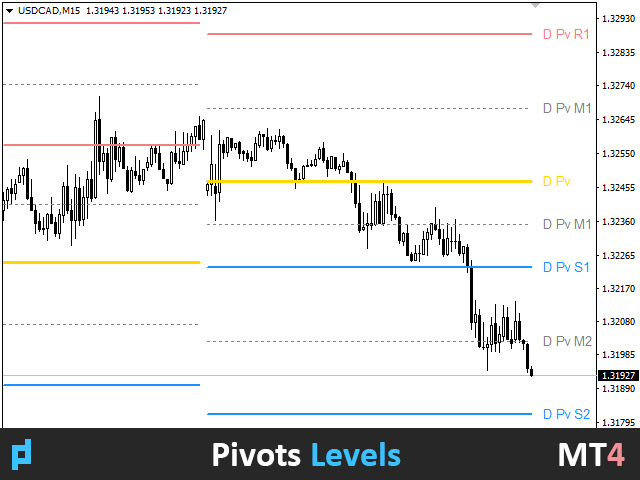
The indicator shows on the chart the classic pivot levels calculated on the basis of the previous day.

You can choose from what hour to calculate the formula.

Trade on reversal levels in a flat. In a trending market, use them as a target.

Combine with your strategies for successful trading.

The levels are drawn using buffers and displayed on the entire available quote history.


Input parameters.


Start Hour - Choose from what hour to start building levels. 00 - Default.

Show Mid Pivots - Middle Levels.


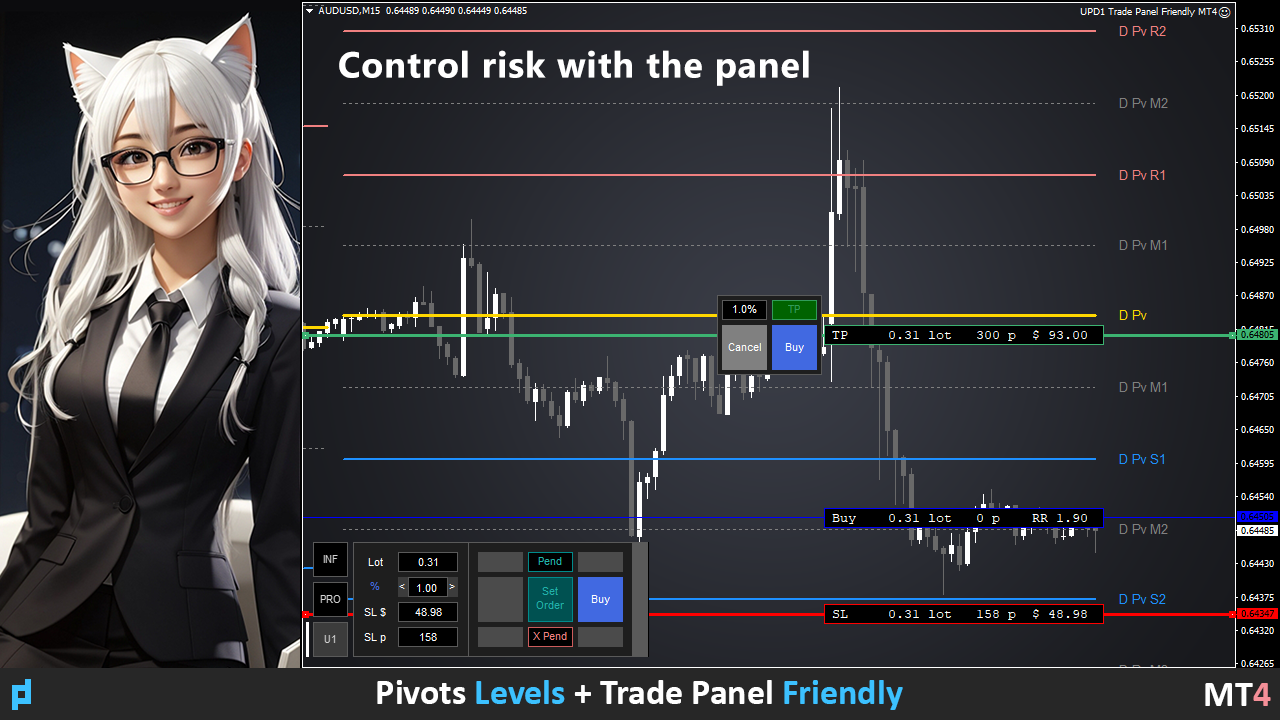
Visual Button - (On / Off).

Corner - (UP Left / DN Left / UP Right / DN Right).

X indent - in pixels.

Y indent - in pixels.


    Label Visual - On/Off digital level marking.

    Label Font Size.

    Label Shift Bars.

    Label Tooltip.


      Levels Style.

      Levels Width.

      Levels Color.


        Alert - On/Off.

        Alert Work Time - 00:00-23:59 (edit).

        Alert Pop Up -  On/Off.

        Alert Push -  On/Off.

        Alert Email -  On/Off.

        Alert Sound -  On/Off.

        Alert Sound Name.


        Reviews 3
        Edgar Dario Ortigoza Vera
        458
        Edgar Dario Ortigoza Vera 2023.03.27 00:19 
         

        Muy buen indicador, funciona bien

        tr4ppist
        97
        tr4ppist 2021.03.12 21:54 
         

        Thanks for the button, great idea

        Recommended products
        KFX Symbol Changer
        Peter Kariuki Thande
        4.67 (3)
        KFX SMA: Symbol Changer + Moving Average (3x) + ATR + RSI + Candle Timer. This indicator allows you to create a Symbol list and change between symbols of the current chart or Timeframe by selecting the appropriate button. On Chart there are three(3) multi timeframe Moving Averages shown (selected by you), ATR Value MTF ( selected by you -  helps with setting SL and TP), RSI Value MTF (selected by you) and a Candle Timer.   Features: - Symbol Changer : Change Symbol and Timeframe of Chart.   (
        FREE
        The Wing Patterns indicator scans for many different kinds of Patterns using an XABCD structure. The term Wing Pattern is used to refer to all types of patterns based on a general XABCD structure, which is plotted in an alternate high-low extreme form. In other words, assume that point X is started at a low point on the chart. The point A is plotted at the next highest point within a certain number of bars. This certain number of bars is called the depth level. In this example, point B would be
        PW Oscillator
        Svyatoslav Kucher
        PW Oscillator   - индикатор предназначенный для поиска локальных экстремумов, определения текущей тенденции. В расчетах индикатора используется авторская методика. С помощью индикатора можно определять места возможного разворота цены желательно в направлении тенденции, но также с достаточной точностью и против нее. Также с помощью индикатора можно определять текущую тенденцию. Индикатор подходит для любых валютных пар, но для адекватного отображения показания необходимо, чтобы было достаточно ис
        A laser sharp and very affordable indicator FOR BEGINNERS AND EXPERTS ALSO AND YOU CAN TRADE THE ZONE BY SIMPLY PRESSING IT! Draws fresh, tested, broken, old, and nested zones up to 3 higher timeframes, and sends Alerts if the zones are touched , entered , or broken, or reversal candle is leaving the zone! NO REPAINT! After purchase  leave a comment or a review and i will send you the user manual and  EA designed for the indicator This indicator is using multitimeframe data and chart interacti
        F ully automated Expert Advisor using the  advanced   algorithm for trading the EURUSD Designed for profit in a short period of time and big profit in a long run. Prefers EURUSD 1H. Principle of operation The SELL and BUY orders are opened (depending on the parameters set), guided by signals and the market situation.     Recommended parameter: Use an ECN broker account. minimum deposit of 100$ USD. use it in H1 time frame recommended symbol is EURUSD input parameter: TrendType               
        Atr Suplied and Demand Mr Beast
        Luis Mariano Vazquez Marcos
        MR BEAST INDICATOR ATR SUPLIED AND DEMAND ¡Descubre la herramienta definitiva para la toma de decisiones financieras con nuestro asesor experto! Diseñado para operar en la vanguardia de los mercados globales, este asesor se destaca por su capacidad única para analizar tendencias en tiempo real utilizando el indicador Average True Range (ATR) y el equilibrio de oferta y demanda. Al aprovechar el ATR, nuestro asesor experto evalúa la volatilidad actual del mercado, proporcionándote una visión clar
        MACD Decision Tree
        Thomas Bradley Butler
        This indicator was constructed using decision trees.  I will only give a few insights into the algorithm since it is original. But there are 4 trees in the inputs and by default they are 10. The decision tree logic for buy signals is as follows: If the MACD line is less than  certain bullish divergence (determined by the "BUY_TREE_1" and "BUY_TREE_2" variables) The decision tree logic for sell signals is as follows: If the MACD line is greater than certain bearish divergence  (determined by the
        Grid MATR
        Abraham Correa
        X-axis lines prevail in grid manner, ruled by Average True Range. There’s an evitable change in specific periods of time! MATR means “multiplying average true range” in order to find the boundaries of the Grid expansion. It’ll stretch, shrink, and evolve with 4 timely choices of grid states! This origin code recognizes the participation on a chart, noticing the development in volume! If you were to click on the gifs attached, you'd see it in action!              |This is an indicator | Mat
        FREE
        Firstly , the script estimates how many Mx bars of the chart (on which this script is applied) the future trend will most likely continue and what is its quality. Secondly (and most importantly), the script is an auxiliary tool for the extremely mathematically advanced and extremely effective ScientificTrade indicator in trading. The script calculates the optimal averaging period, which is also equal to Mx, of the ScientificTrade indicator, which gives the maximum profit according to the strate
        The indicator automatically calculates and plots Fibonacci support and resistance levels - one of the most effective tools for market analysis. The calculation uses the averaged price data for the selected period and timeframe. The minimum and maximum for this period are taken as the beginning and end of the movement. Fibonacci levels allow you to see potential reference points, around which the price movement can slow down or reverse, that is, they are used to predict further movement, as well
        Fibonacci SR Indicator
        Martin Eshleman
        3 (2)
        Fibonacci SR Indicator This indicator creates support and resistance lines. This indicator is based on Fibonacci Retracement and Extension levels. It will consider many combinations of the Fibonacci levels and draw support/resistance lines based on these. This indicator uses tops and bottoms drawn by the ZigZag indicator in its calculations. The ZigZag can also be drawn on the chart, if necessary. The indicator considers many combinations of past reversal points and Fibonacci ratio levels, and
        FREE
        SX Currency Strength indicator allows users to analyze currency strength through a selected period, with results resetting periodically and accumulating thereafter. It displays the historical relative strength of eight major currencies (USD, EUR, GBP, JPY, AUD, CHF, CAD and NZD) across a selected timeframe. Assessing a currency's relative strength aids in evaluating its performance against a basket of other currencies. Users can select to visualize relative strength of the currencies in the shap
        RedeeCash AROON
        Patrick Odonnell Ingle
        Version History Date Version Changes 07/08/2022 1.00 Initial Release Description The Aroon indicator is a technical indicator   that is used to identify trend changes in the price of an asset, as well as the strength of that trend. In essence, the indicator measures the time between highs and the time between lows over a time period. The idea is that strong uptrends will regularly see new highs, and strong downtrends will regularly see new lows. The indicator signals when this is happening, and
        FREE
        Ichimoku wave
        Bardia Mohammadi
        Goichi Hosada ( founder of Ichimoku )  in his development of Ichimoku, spent 4.5yrs of his study just on number theory.  He studied pretty much every Eastern and Western theory under the sun, and eventually settled upon 3 basis numbers that he not only made the basis of Ichimoku theory, but underlined all of reality. NOTE: I have an interesting follow up story to tell about this so remind me to discuss it later. The three numbers he made as the basis for Ichimoku were 9, 17 and 26. So the idea t
        FREE
        Hi! Between the given time range. Adds profit and lot. This can be written on the charter in English and Hungarian. The name of the symbol must be entered exactly. Good used for it. :) Szia! A meg adott idősáv között Összeadja a profitot és lot-ot. Ezt ki írathatjuk Angolul és Magyarul a chartra. Pontosan kell beírni a szimbólum nevét. Jó használatott hozzá. :)
        Singal Engulfing Candle
        Cristobal Hidalgo Soriano
        Indicador: Engulfing Candle Strategy  El indicador "Engulfing Candle Strategy"! Este indicador personalizado para MetaTrader 4 identifica y resalta automáticamente las formaciones de velas "Engulfing", una poderosa señal técnica utilizada por traders de todo el mundo. ¿Qué es una vela "Engulfing"? Una vela "Engulfing" es una formación de dos velas consecutivas en un gráfico de precios. La primera vela es más pequeña y está completamente contenida dentro del rango de la segunda vela, que es sign
        The most effective signals generated by Ichimoku strategies. Ichimoku Trade Alarm is a supplement for Ichimoku Trade Panel and it shows the signals that Expert Advisor reacts to. Visualization of signals:  Price / Kijun sen cross - the candle body must be between Min_Candlestick_Body and Max_Candlestick_Body. The candle must close above / below Kijun sen, minimum in 1/3 of its body. Open candle must be located above / below Kijun sen. Chinkou span must be under the price of 26 periods in advan
        This EA is an extension for the free trade indicator Trend Mate . https://www.mql5.com/en/market/product/50082 The main idea is to support your decision to  trade  according to the current trend. It is possible to configure alert and push notification to receive when entering to first candle for bull / bear trend. For this extension of the free indicator now it is possible to filter the current trend info with other timeframes. For example show trend for timeframe M5 considering also timefra
        Pivot Point Multi Method is a fully automatic pivot point indicator and indicate support and resistances (S1,S2,S3,S4,R1,R2,R3,R4) based on four Methods that you can select on of them Pivot point detection and drawing support resistances Methods( Classic ,Camarilla ,Woodie ,Fibonacci) Pivot Point Multi Method is working on all time frames and all currency pairs and gold silver and crypto currencies . Recommended Setting : Pivot_Method    select one of the methods ( Classic ,Camarilla ,Woodi
        NAM Divergences
        NAM TECH GROUP, CORP.
        5 (1)
        MT4 Multi-timeframe Divergence and Overbougt/Oversold detection indicator. Features - Fully customizable on chart control panel, provides complete interaction. - Hide and show control panel wherever you want. - Real time information about non-capitalized divergences. - Real time information about overbougt / oversold situations. - Real time information about regular divergences. - Real time information about hidden divergences. - Oscillators available for divergences detection: AO, RSI, CCI, M
        SR levels true mql4
        Egidijus Bikulcius
        5 (1)
        Indicator SR levels true in small time frames is very useful for scalping while in bigger ones it is good for day or position trading. SR levels true can draw 4 support/resistance levels based on defined maximum rebouds from price level. Indicator scans  defined number of bars in time axis and defined number of pips in price axis (both sides - up and down) and calculates how much times price was rejected from scanned price levels. At the price levels where maximum rebounds are counted, support
        FREE
        Pirate
        Anatoliy Lukanin
        3.9 (20)
        Deposit :   from 100 deposit units Trading pairs: I recommend currency pairs: EURAUD, CHFJPY, EURCHF, EURGBP, AUDCHF, CADCHF, USDCHF. Trading period :  Any Account: You should use ECN-ECN.Pro accounts with five-digit quotes with a moderate size (spread). Parameters: USING - Choice, trading risk or fixed lot RISK/LOT - Lot Risk Value RESTORING_THE_BALANCE - Restoring balance* HOW_THE_RESET_WINDOW - Reset the Global Variable TAKE_PROFIT - Set profit STOP_LOSS - Set loss COUNT_BUY - The number of
        The main idea of this indicator is rates analysis and prediction by Fourier transform. Indicator decomposes exchange rates into main harmonics and calculates their product in future. You may use the indicator as a standalone product, but for better prediction accuracy there is another related indicator - FreqoMaster - which uses FreqoMeterForecast as a backend engine and combines several instances of FreqoMeterForecast for different frequency bands. Parameters: iPeriod - number of bars in the ma
        Exclusive Limited Time Offer! Grab this useful indicator for a lifetime at just $49. Note: It is requested that purchases must be refrained from if the buyer is from India, Bangladesh, or Pakistan, as developer support for these regions is unavailable due to legal restrictions. Volatility indicator dashboard designed to revolutionize how traders perceive and navigate market volatility. Track volatile for multiple currency pairs one at time for multiple timeframes. Works best with Forex Market,
        Awesome Oscillator by Bill Williams with the ability to fine-tune and replace the averaging algorithms of the indicator, which significantly expands the possibilities of using this oscillator in algorithmic trading and brings it closer in its properties to such an indicator as the MACD. To reduce price noise, the final indicator is processed with an additional Smooth averaging. The indicator has the ability to give alerts, send mail messages and push signals when the direction of movement of th
        Super Gator
        Agustinus Biotamalo Lumbantoruan
        This indi shows the following 1. Supertrend 2. Alligator (Not a regular alligator) 3. ZigZag 4. Moving Average 5. Trend Continuation/Mini correction Signal (plotted in X) (See screenshots in green background color 6. Early Signal Detection (See screenshots in green background color) You may treat Alligator as the lagging indicator The leading indicator is the supertrend. The zig zag is based on the leading indicator where it gets plotted when the leading indicator got broken to the opposite.
        Daily Pivots Multi Indicator Daily Pivots Multi is an exclusive indicator to draw your pivots levels and much more. Most indicators draw daily pivots for the day. Daily Pivots Multi is able to draw levels for different days. The indicator can do the calculation for unlimited number of days backward. It means that you can draw the levels for today but also for the past days. This is very useful if you want to study a strategy with Pivots levels over a period of time. Another problem is th
        Wave Wolf MT4
        Andrei Salanevich
        The Wave Wold MT4 Forex indicator is designed to search for Wolf waves and display them in the current window of the trading terminal. An excellent indicator for traders who use Wolf waves in trading. Its application in trading strategies will significantly increase their efficiency and profitability. INFORMATION ABOUT THE INDICATOR Unlike other Wolf wave indicators, the Wave Wold MT4 forex indicator has a number of features that significantly increase its effectiveness: The first is the
        MQLTA Supertrend Multi Timeframe
        MQL4 Trading Automation
        4.86 (14)
        Earn trading cryptocurrencies nowadays. (2023) Hello Everyone I would like to introduce you to my short guide about Trading with cryptocurrency pretty short but can be useful for everyone for this year, with patterns based on past experiences, could help those who want to earn with cryptocurrencies. Here im attaching the archive with full guide. https://files.catbox.moe/quwwzw.rar
        FREE
        Bigger chart labels would allow the user to be entirely aware of which chart he/she is on.  Each chart window is unique, containing different patterns and economic motives so acknowledging the chart window would be absolutely essential!  There are well known Economic Time Zones included in clear view, by choice!    Simple does it! Use your computing mouse scroller, clicking with the right finger on the label, in order to customize the label properties. From there, choose your preferred color, f
        FREE
        Buyers of this product also purchase
        Gann Made Easy
        Oleg Rodin
        4.95 (43)
        Gann Made Easy is a professional and easy to use Forex trading system which is based on the best principles of trading using the theory of mr. W.D. Gann. The indicator provides accurate BUY and SELL signals including Stop Loss and Take Profit Levels. You can trade even on the go using PUSH notifications. PLEASE CONTACT ME AFTER PURCHASE TO GET MY TRADING TIPS PLUS A GREAT BONUS! Probably you heard already many times about Gann trading methods. Usually Gann's theory is very complex thing not only
        Introducing the Miraculous Forex Indicator: Unleash the Power of Precision Trading Are you tired of searching for the perfect forex indicator that truly delivers exceptional results across all time frames? Look no further! The Miraculous Forex Indicator has arrived to revolutionize your trading experience and propel your profits to new heights. Built upon a foundation of cutting-edge technology and years of meticulous development, the Miraculous Forex Indicator stands as the pinnacle of str
        Currently 20% OFF ! Best Solution for any Newbie or Expert Trader! This dashboard software is working on 28 currency pairs plus one. It is based on 2 of our main indicators (Advanced Currency Strength 28 and Advanced Currency Impulse). It gives a great overview of the entire Forex market plus Gold or 1 indices. It shows Advanced Currency Strength values, currency speed of movement and signals for 28 Forex pairs in all (9) timeframes. Imagine how your trading will improve when you can watch the e
        TPSpro RFI Levels
        Roman Podpora
        5 (13)
        A key element in trading is zones or levels from which decisions to buy or sell a trading instrument are made. Despite attempts by major players to conceal their presence in the market, they inevitably leave traces. Our task was to learn how to identify these traces and interpret them correctly. Reversal First Impulse levels (RFI)   -  Version MT5                INSTRUCTIONS                 RUS                 ENG                                       R ecommended to use with an indicator   -  
        TPSproTREND PrO
        Roman Podpora
        5 (15)
        TPSpro TRENDPRO  - is a trend indicator that automatically analyzes the market and provides information about the trend and each of its changes, as well as giving signals for entering trades without redrawing! The indicator uses each candle, analyzing them separately. referring to different impulses - up or down impulse. Exact entry points into transactions for currencies, crypto, metals, stocks, indices!  -  Version MT5               DETAILED DESCRIPTION        /       TRADING SETUPS           
        Atomic Analyst
        Issam Kassas
        5 (1)
        First of all Its worth emphasizing here that this Trading Indicator is   Non-Repainting ,   Non-Redrawing   and   Non-Lagging   Indicator, Which makes it ideal from both manual and robot trading.  The Atomic Analyst  is a PA Price Action Indicator that uses Strength and Momentum of the price to find a better edge in the market. Equipped with Advanced filters which help remove noises and false signals, and Increase Trading Potential. Using Multiple layers of complex Indicators, the Atomic Anal
        Gold Stuff
        Vasiliy Strukov
        4.89 (250)
        Gold Stuff is a trend indicator designed specifically for gold and can also be used on any financial instrument. The indicator does not redraw and does not lag. Recommended time frame H1. At it indicator work full auto  Expert Advisor EA Gold Stuff. You can find it at my profile. Contact me immediately after the purchase to get   personal bonus! Settings  and manual here   SETTINGS Draw Arrow - on off. drawing arrows on the chart. Alerts -   on off audible alerts. E-mail notification - on off. e
        CURRENTLY 26% OFF Best Solution for any Newbie or Expert Trader! This Indicator is a unique, high quality and affordable trading tool because we have incorporated a number of proprietary features and a new formula. With only ONE chart you can read Currency Strength for 28 Forex pairs! Imagine how your trading will improve because you are able to pinpoint the exact trigger point of a new trend or scalping opportunity? User manual: click here That's the first one, the original! Don't buy a worthle
        Scalper Inside PRO
        Alexey Minkov
        4.75 (55)
        An exclusive indicator that utilizes an innovative algorithm to swiftly and accurately determine the market trend. The indicator automatically calculates opening, closing, and profit levels, providing detailed trading statistics. With these features, you can choose the most appropriate trading instrument for the current market conditions. Additionally, you can easily integrate your own arrow indicators into Scalper Inside Pro to quickly evaluate their statistics and profitability. Scalper Inside
        Trend Screener
        STE S.S.COMPANY
        4.83 (86)
        Unlock the Power of  Trends trading with Trend Screener Indicator: Your Ultimate Trend Trading Solution powered by fuzzy logic and Multi-currencies System ! Elevate your trend trading with Trend Screener, the revolutionary trend indicator powered by   fuzzy logic.  It is a powerful trend-following indicator that combines over  13 premium tools and features and 3 trading strategies  , making it a versatile choice to   make your Metatrader a Trend Analyzer. LIMITED TIME OFFER : Trend Screener Indi
        Introducing   Quantum Trend Sniper Indicator , the groundbreaking MQL5 Indicator that's transforming the way you identify and trade trend reversals! Developed by a team of experienced traders with trading experience of over 13 years,   Quantum Trend Sniper Indicator   is designed to propel your trading journey to new heights with its innovative way of identifying trend reversals with extremely high accuracy. ***Buy Quantum Trend Sniper Indicator and you could get Quantum Breakout Indicator fo
        TrendMaestro
        Stefano Frisetti
        5 (2)
        note: this indicator is for METATRADER4, if you want the version for METATRADER5 this is the link: TRENDMAESTRO recognizes a new TREND in the bud, he never makes mistakes. The certainty of identifying a new TREND is priceless. DESCRIPTION TRENDMAESTRO identifies a new TREND in the bud, this indicator examines the volatility, volumes and momentum to identify the moment in which there is an explosion of one or more of these data and therefore the moment in which prices have strong probability of f
        First of all Its worth emphasizing here that this Trading Tool is Non-Repainting Non-Redrawing and Non-Lagging Indicator Which makes it ideal for professional trading . The Smart Price Action Concepts Indicator is a very powerful tool for both new and experienced traders . It packs more than 20 useful indicators into one combining advanced trading ideas like Inner Circle Trader Analysis and Smart Money Concepts Trading Strategies . This indicator focuses on Smart Money Concepts providing in
        Currency Strength Wizard is a very powerful indicator that provides you with all-in-one solution for successful trading. The indicator calculates the power of this or that forex pair using the data of all currencies on multiple time frames. This data is represented in a form of easy to use currency index and currency power lines which you can use to see the power of this or that currency. All you need is attach the indicator to the chart you want to trade and the indicator will show you real str
        XQ Indicator MetaTrader 4
        Marzena Maria Szmit
        3 (2)
        Step into the realm of Forex trading with confidence and precision using XQ, a cutting-edge Forex indicator designed to elevate your trading game to unprecedented heights. Whether you're a seasoned trader or just stepping into the world of currency exchange,   XQ Forex Indicator   empowers you with the insights and signals needed to make informed trading decisions. The signal conditions are a combination of three indicators, and XQ Forex Indicator only display  medium and long-term trends . The
        Discover the Secret to Successful Forex Trading with Our Custom MT4 Indicator! Have you ever wondered how to achieve success in the Forex market, consistently earning profits while minimizing risk? Here is the answer you've been searching for! Allow us to introduce our proprietary MT4 indicator that will revolutionize your approach to trading. Unique Versatility Our indicator is specially designed for users who prefer Renko and Rangebar candle formations. We understand that these chart types are
        Advanced Supply Demand
        Bernhard Schweigert
        4.92 (310)
        CURRENTLY 26% OFF !! Best Solution for any Newbie or Expert Trader! This indicator is a unique, high quality and affordable trading tool because we have incorporated a number of proprietary features and a new formula. With this update, you will be able to show double timeframe zones. You will not only be able to show a higher TF but to show both, the chart TF, PLUS the higher TF: SHOWING NESTED ZONES. All Supply Demand traders will love it. :) Important Information Revealed Maximize the potenti
        Quantum Breakout Indicator PRO
        Bogdan Ion Puscasu
        4.96 (26)
        Introducing   Quantum Breakout PRO , the groundbreaking MQL5 Indicator that's transforming the way you trade Breakout Zones! Developed by a team of experienced traders with trading experience of over 13 years, Quantum Breakout PRO is designed to propel your trading journey to new heights with its innovative and dynamic breakout zone strategy. Quantum Breakout Indicator will give you signal arrows on breakout zones with 5 profit target zones and stop loss suggestion based on the breakout box.
        Scalper Vault
        Oleg Rodin
        5 (27)
        Scalper Vault is a professional scalping system which provides you with everything you need for successful scalping. This indicator is a complete trading system which can be used by forex and binary options traders. The recommended time frame is M5. The system provides you with accurate arrow signals in the direction of the trend. It also provides you with top and bottom signals and Gann market levels. The indicator provides all types of alerts including PUSH notifications. Please contact me aft
        FX Power MT4 NG
        Daniel Stein
        5 (8)
        Trading GOLD, and currencies, with the dog walk strategy  - super smart Trading GOLD, and currencies, with the breakout strategy  - super easy Visit our all-new   Stein Investments Welcome Page   to get the latest information, updates and trading strategies. FX Power MT4 NG  is the next generation of our long-time very popular currency strength meter, FX Power.  And what does this next-generation strength meter offer? Everything you have loved about the original FX Power  PLUS GOLD/XAU stre
        Introducing ON Trade Waves Patterns Harmonic Elliot Wolfe, an advanced indicator designed to detect various market patterns using both manual and automated methods. Here's how it works: Harmonic Patterns: This indicator can identify harmonic patterns that appear on your chart. These patterns are essential for traders practicing harmonic trading theory, as popularized by Scott Carney's book "Harmonic Trading vol 1&2." Whether you draw them manually or rely on automated detection, ON Trade Waves
        PRO Renko System
        Oleg Rodin
        5 (24)
        PRO Renko System is a highly accurate trading system specially designed for trading RENKO charts. The ARROWS and Trend Indicators DO NOT REPAINT! The system effectively neutralizes so called market noise giving you access to accurate reversal signals. The indicator is very easy to use and has only one parameter responsible for signal generation. You can easily adapt the tool to any trading instrument of your choice and the size of the renko bar. I am always ready to provide extra support to help
        Entry Points Pro
        Yury Orlov
        4.7 (224)
        Top indicator for MT4 providing accurate signals to enter a trade without repainting! Watch  the video  (6:22) with an example of processing only one signal that paid off the indicator! It can be applied to any financial assets:  forex, cryptocurrencies, metals, stocks, indices.  MT5 version is here   It will provide pretty accurate trading signals and tell you when it's best to open a trade and close it. Most traders improve their trading results during the first trading week with the help of t
        Advanced Currency IMPULSE with ALERT
        Bernhard Schweigert
        4.91 (493)
        CURRENTLY 31% OFF !! Best Solution for any Newbie or Expert Trader! This indicator is a unique, high quality and affordable trading tool because we have incorporated a number of proprietary features and a secret formula. With only ONE chart it gives Alerts for all 28 currency pairs. Imagine how your trading will improve because you are able to pinpoint the exact trigger point of a new trend or scalping opportunity! Built on new underlying algorithms it makes it even easier to identify and confir
        First of all Its worth emphasizing here that this Trading System is Non-Repainting, Non-Redrawing and Non-Lagging Indicator, Which makes it ideal for professional trading. The "Smart Support and Resistance Trading System" is an advanced indicator tailored for  new  and  experienced  traders. It empowers traders with precision and confidence in the forex market. This comprehensive system combines 7+ strategies, 10 indicators, and various trading approaches, including day trading strategy, swing
        TrendDecoder Premium
        Christophe, Pa Trouillas
        5 (2)
        Identify ranges  | Get earliest signals of Trends  | Get clear exits before reversal  | Spot the Fibo levels the price will test Non-repainting, non-delayed indicator - ideal for manual and automated trading - for all assets and all time units $69   for launch - then back to >>   $149 After purchase,   please contact me on this channel   for recommended and personalised settings MT5   version:  Click here Get our full method with  BladeSCALPER  and   PowerZONES What is it about? TrendDECOD
        TakePropips Donchian Trend Pro
        Eric John Pajarillaga Aldana
        4.82 (17)
        TakePropips Donchian Trend Pro  (MT4) is a powerful and effective tool that automatically detects the direction of the trend using the Donchian Channel and provides you with an entry and exit trading signals! This multi-function indicator includes a trend scanner, trading signals, statistical panel, screener, trading sessions, and alerts history dashboard. It is designed to provide you with trading signals and save you hours analyzing the charts! You can download the user manual and installation
        Introducing the Zeus Indicator: Your Ultimate Profit-Breakthrough Trading Tool. This indicator simplifies trading, eliminating the need for in-depth analysis with breakout strategies. It automatically draws zones based on your preset timeframes, suggests Stop Loss (SL), Take Profit (TP), and Trailing Stop levels. The Zeus Indicator will promptly notify you and display signal arrows as the price approaches buy or sell entry points. It also offers recommendations for four different take profi
        Up Down v6
        Guner Koca
        4.67 (9)
        up-down indicator is no repaint and works all pairs and lower than weekly time frames charts. it is suitable also 1 m charts for all pairs. and hold long way to signal. dont gives too many signals. when red histogram cross trigger line that is up signal.and price probably will down when blue histogram cross trigger line that is down signal.and price probably will go up. when the signals not seen press + button on terminal . too see weekly chart because of low data on chart ,it needs to lower p
        FX Volume
        Daniel Stein
        4.6 (35)
        Visit our all-new   Stein Investments Welcome Page   to get the latest information, updates and trading strategies. FX Volume is the FIRST and ONLY volume indicator that provides a REAL insight into the market sentiment from a broker's point of view. It provides awesome insights into how institutional market participants, like brokers, are positioned in the Forex market, much faster than COT reports. Seeing this information directly on your chart is the real game-changer and breakthrough solut
        More from author
        UPD1 Profile Levels MT5
        Vitaliy Kuznetsov
        5 (3)
        The indicator finds the levels of the maximum and minimum price volume (market profile) on the working histogram for the specified number of bars.  Composite profile . The height of the histogram is fully automatic and adapts to any instrument and timeframe. The author's algorithm is used and does not repeat well-known analogues. The height of the two histograms is approximately equal to the average height of the candle. Smart alert will help you to inform about the price concerning the volume l
        UPD1 Volume BOX
        Vitaliy Kuznetsov
        5 (13)
        The indicator displays the horizontal volume profile in the specified area (BOX) and the maximum volume (POC). Product Features. 1. You can use ticks or just price. 2. Adaptive grid spacing (M1-MN). 3. Adaptive high volume (median) search step depending on box size. 4. Automatic chameleon color for box lines and buttons. 5. Multiple boxes, easy to create and delete. 6. 70% volume area (enable in settings). 7. There is an alert for touching the maximum horizontal volume line (POC). 8. VWAP. 9.
        Trading panel with preset orders and automatic lot calculation for the MT4 terminal. Attention, the Trading Panel does not work in the strategy tester (only trailing stop testing). Manual, Description, Download Light Demo. Successful traders are distinguished by self-discipline and competent money management. If you use a fixed lot, then you are at risk. After all, there are different distances on different timeframes and one unprofitable transaction can cover several profitable ones. If you use
        UPD1 Profile Levels
        Vitaliy Kuznetsov
        5 (6)
        The indicator finds the levels of the maximum and minimum price volume (market profile) on the working histogram for the specified number of bars.  Composite profile . The height of the histogram is fully automatic and adapts to any instrument and timeframe. The author's algorithm is used and does not repeat well-known analogues. The height of the two histograms is approximately equal to the average height of the candle. Smart alert will help you to inform about the price concerning the volume
        UPD1 Volume Cluster
        Vitaliy Kuznetsov
        4.77 (13)
        The algorithm finds the zones of reduced volatility based on the UPD1 Trend Direction Indicator and builds the maximum horizontal volume based on the UPD1 Volume Box Indicator . As a rule, a strong trend movement occurs when exiting accumulation. If the price has left the accumulation, then it can test its maximum horizontal volume (POC). Smart alerts are available in the settings. Input parameters. Main Settings. Bars Count – the number of history bars on which the indicator will work. Tim
        FREE
        UPD1 Impulse Level
        Vitaliy Kuznetsov
        5 (8)
        The indicator finds impulse waves on the chart. Analyzes the breakdown of the fractal channel and builds impulse levels . In addition, it finds the alleged places of false breakouts and liquidity grabs . In the settings, you can enable a multi-currency dashboard and select any tools and timeframes. Notification Choose between the current schedule or the entire list. There are separate impulse and false breakdown signals. Blog-Link -  Retest and Fake Breakout with UPD1 . Trade Patterns: + Ret
        UPD1 Trend Direction
        Vitaliy Kuznetsov
        4.75 (8)
        This indicator is used to display the places of the flat and trend. The construction is based on an oscillator. It is used as an additional filter, both for trading on a regular chart and for binary options. Flat places are used in the UPD1 Volume Cluster indicator for trading according to the concept of smart money The built-in alert signals the places of the greatest overbought/oversold. Input parameters. Main Settings. Bars Count - indicate the number of bars on which the trend direction
        FREE
        UPD1 Volume Footer
        Vitaliy Kuznetsov
        5 (8)
        The indicator shows the vertical volume. In the settings there are 2 coefficients for determining high and extreme volume and 1 for determining low volume. A similar algorithm is also used in the UDP1 Volume Pixel indicator . When the specified volume is detected, the histogram is painted in the appropriate color. The width of the histogram is selected automatically, depending on the scale. As a rule, the price reacts to the maximum and minimum volume. But it is necessary to use confirmation si
        FREE
        The indicator builds a three-period semaphore and reversal pattern 123 from the extremum. The signal comes at the opening of the second candle. This pattern can be traded in different ways (test point 3, breakout and others). Exit from the channel or breakout of the trendline is the main trigger for finding an entry point. Icons are colored according to Fibonacci levels. Yellow icons indicate a test of a level at which the signal is amplified. Using the multi-currency dashboard, you can track w
        UPD1 Pin Bar Dashboard
        Vitaliy Kuznetsov
        5 (2)
        An indicator that displays the Pin Bar candlestick pattern. With the help of coefficient settings, the ratio of shadow, body and size is easily adjusted. It is possible to filter by trend (2 moving averages) and by reversal (RSI and Bollinger Bands). This is the most popular price action pattern. A multi-currency dashboard is available. With it, you can easily switch between charts. Trading Patterns: Retest by trend. False breakout. Other. EURUSD, GBPUSD, XAUUSD, ... M15, M30, H1. Input p
        UPD1 Volume TimeFrame POC
        Vitaliy Kuznetsov
        5 (3)
        The indicator display the maximum horizontal volume on the selected timeframe. Based on the UPD1 Volume Box indicator . The lines can be connected or separated. In the settings, you can enable smart touch alert. Such an indicator will be useful for those who trade according to the market profile and the concept of smart money. Input parameters. Main Settings. Bars Count - indicate the number of bars on which the TF POC will be drawn. Data Source - the time frame from which the ticks will be
        FREE
        The meaning of this indicator is to   find Murray levels on all timeframes   and combine them into   combo levels , including signal levels based on strong Murray levels (+2, +1, 8, 4, 0, -1, -2). The lower the timeframe, the more chances you have to see the combo level immediately. It will be highlighted in color. When you hover over any number, a hint will pop up to which timeframe the level belongs to. But you will always see the current timeframe as the leftmost one. A  smart alert  will he
        UPD1 Watermark MT4
        Vitaliy Kuznetsov
        5 (1)
        The indicator shows any text and any image on the chart, and can also output the information requested by macros. There are three text blocks and one block for images. Available font selection, size, color, indentation and positioning. If you want to brand your screenshots or display the necessary information on a graph, then UPD1 Watermark will be a very useful tool. Description of settings. Text Settings (3 blocks). Text 1, 2, 3 – enter the text and, or a macro. Font Name – write the font
        FREE
        UPD1 Rsi Dots Dashboard
        Vitaliy Kuznetsov
        5 (1)
        The indicator shows signals based on the terminal RSI oscillator on the chart. It is possible to filter out repeated signals. Here the oscillator is used to search for a reverse signal. It is recommended as an entry point in swing strategies and trading from levels. A multi-currency dashboard is available. With it, you can easily switch between charts. In product discussions, you can suggest an algorithm in which you can embed a dashboard. Input parameters. Main Settings. Bars Count – t
        FREE
        The Average True Range ( ATR ) is a measure of market volatility over a specified number of days. You should not expect a big continuation move when the price has reached the end of the range. The market is considered to have run out of fuel. If the price has not reached the edge, it still has a range. The indicator formula allows you to calculate High-Low levels both in aggregate and individually. You can also use these levels as support/resistance and target. Input parameters. Start Day -
        FREE
        UPD1 Impulse Channel
        Vitaliy Kuznetsov
        5 (8)
        The channel indicator is trending and does not repaint. It creates an ATR price channel with the opposite volatility border. The indicator has proven itself well in the strategy of trading on impulse levels and fake breakout. The entry point should be looked for on the correction to the indicator line, and the take profit should be set on the opposite border. Blog-Link -   Retest and Fake Breakout with UPD1 . Input parameters. Bars Count - history to display. ATR - average true range peri
        FREE
        UPD1 Murrey Math Levels
        Vitaliy Kuznetsov
        5 (7)
        Murray's mathematical levels are based on observations by Gann and his theory of the squareness of prices. According to Gann, the price moves in 1/8 of the range. These 1/8 allow us to get different resistance and support levels for a given chart, which have their own characteristics. After a breakout of -2 or +2 levels, or with a decrease in volatility, they are rebuilt. You can choose which period to display (current or entire history). All lines are drawn through buffers. Blog-Link -   Murrey
        FREE
        UPD1 D Levels
        Vitaliy Kuznetsov
        5 (1)
        Levels indicator based on the previous day. Mathematical formula determines entry and exit levels.  Trading recommendations. Levels are traded at the beginning of the European session when volatility appears. In case of insufficient volatility use half of take profit to exit. If the price reversed at half take profit, then on the reversal look for a target also at the level of half take profit. If the price bounced from the entry level, then in the opposite direction the price can reach the s
        FREE
        UPD1 X00 Levels MT5
        Vitaliy Kuznetsov
        5 (1)
        The indicator shows   round levels   on the chart. They are also called   psychological , banking, or levels of major players. At these levels, there is a real fight between bulls and bears, the accumulation of many orders, which leads to increased volatility. The indicator   automatically   adjusts to any instrument and timeframe. When the   level 80   is broken through and then tested, we   buy. When   level 20   is broken through and then tested, we   sell. The target is 00. Attention. Due to
        FREE
        UPD1 X00 Levels
        Vitaliy Kuznetsov
        4.92 (12)
        The indicator shows   round levels   on the chart. They are also called   psychological , banking, or levels of major players. At these levels, there is a real fight between bulls and bears, the accumulation of many orders, which leads to increased volatility. The indicator   automatically   adjusts to any instrument and timeframe. When the   level 80   is broken through and then tested, we   buy. When   level 20   is broken through and then tested, we   sell. The target is 00. Attention. Due t
        FREE
        UPD1 Volume Pixel
        Vitaliy Kuznetsov
        5 (3)
        The indicator finds the low, high, extreme volume based on the specified coefficients and paints them in the specified colors. This replaces the standard volume drawing function in the metatrader terminal. Bars can also be painted in the color of the volume. On bars with extreme volume, the maximum horizontal volume (cluster/POC) is determined. Depending on its location (pushing, neutral, stopping), the cluster also has its own color. If the cluster is in the shadow, and the bar has an extreme
        UPD1 Fibo Levels
        Vitaliy Kuznetsov
        5 (3)
        The indicator analyzes the specified number of candles and plots Fibonacci levels based on the high-low. Since the levels are rearranging, we are interested in the right side of the range. The price magnetizes the levels and reacts to the touch. Use this tool to find a trend entry point after a correction. If on the left we see that the levels have risen perfectly, then we can assume that we have found the end of the movement at the extreme point. All lines are drawn through buffers or objects (
        FREE
        The indicator searches for impulse candles and displays them on the chart. It includes a shadow filter. It also finds breakout levels of Bollinger Bands. You can enable multi-currency dashboard in the settings. Alerting choose between the current chart or the entire list. Blog-Link -  Retest and Fake Breakout with UPD1 Trading patterns: Trend retest. False Breakout. Others. EURUSD, GBPUSD, XAUUSD, ... M15, M30, H1. Input parameters. Basic. Bars Count - the number of history bars on whic
        The meaning of this indicator is to   find Murray levels on all timeframes   and combine them into   combo levels , including signal levels based on strong Murray levels (+2, +1, 8, 4, 0, -1, -2). The lower the timeframe, the more chances you have to see the combo level immediately. It will be highlighted in color. When you hover over any number, a hint will pop up to which timeframe the level belongs to. But you will always see the current timeframe as the leftmost one. A  smart alert  will hel
        The indicator builds a three-period semaphore and reversal pattern 123 from the extremum. The signal comes at the opening of the second candle. This pattern can be traded in different ways (test point 3, breakout and others). Exit from the channel or breakout of the trendline is the main trigger for finding an entry point. Icons are colored according to Fibonacci levels. Yellow icons indicate a test of a level at which the signal is amplified. Using the multi-currency dashboard, you can track w
        The indicator searches for and displays large shadows on the chart automatically based on volatility. Shadows are additionally filtered by the wave size. The algorithm analyzes the fractal breakdown by the shadow in the specified range and displays the level. In the settings, you can enable a multi-currency dashboard. The alert is selected between the current schedule or the entire dashboard sheet. Signals for large shadows and those that have broken through the fractal level can be turned on s
        The indicator displays the "Rails" pattern on the chart. This pattern consists of two multidirectional candles with identical bodies and small shadows. If on the current timeframe the pattern "Rails", then on the x2 timeframe it will look like a Pin Bar (Doji). This indicator was created to automatically find the pattern in the most efficient way with logically simple settings that you can easily change. There is an option to filter by trend (2 moving averages) and reversal (RSI and Bollinger B
        An indicator that displays the Engulfing candlestick pattern. In the settings, you can specify the type of engulfing (body, shadow and combination). It is possible to filter by trend (2 moving averages) and by reversal (RSI and Bollinger Bands). This is a very popular price action pattern. A multi-currency dashboard is available. With it, you can easily switch between charts. Trading Patterns: Retest by trend. False breakout. Order Block. Other. EURUSD, GBPUSD, XAUUSD, ... M15, M30, H1. I
        The indicator shows a signal on the chart when the second candlestick is inside the first candlestick, i.e. has not gone beyond its limits. This candlestick pattern is called the Inside Bar. This pattern is not as popular as Pin Bar or Engulfing, but it is sometimes used by some traders. There is a possibility to filter by trend (2 moving averages) and by reversal (RSI and Bollinger Bands). Multicurrency panel is available. With its help you can easily switch between charts. Trading patterns:
        Filter:
        Edgar Dario Ortigoza Vera
        458
        Edgar Dario Ortigoza Vera 2023.03.27 00:19 
         

        Muy buen indicador, funciona bien

        tr4ppist
        97
        tr4ppist 2021.03.12 21:54 
         

        Thanks for the button, great idea

        Vladimir Nikolaychuk
        169
        Vladimir Nikolaychuk 2020.08.19 13:14 
         

        User didn't leave any comment to the rating

        Reply to review
        Version 1.25 2023.12.09
        fixed Start Hour
        improved the structure of alerts
        compiled a new build 1400
        Version 1.15 2023.09.05
        New build
        Version 1.12 2020.10.08
        Add Button Mode On/Off (Default Off)