Price Action Finder MT5
- Indicators
- Siarhei Vashchylka
- Version: 1.15
- Updated: 8 January 2023
- Activations: 10
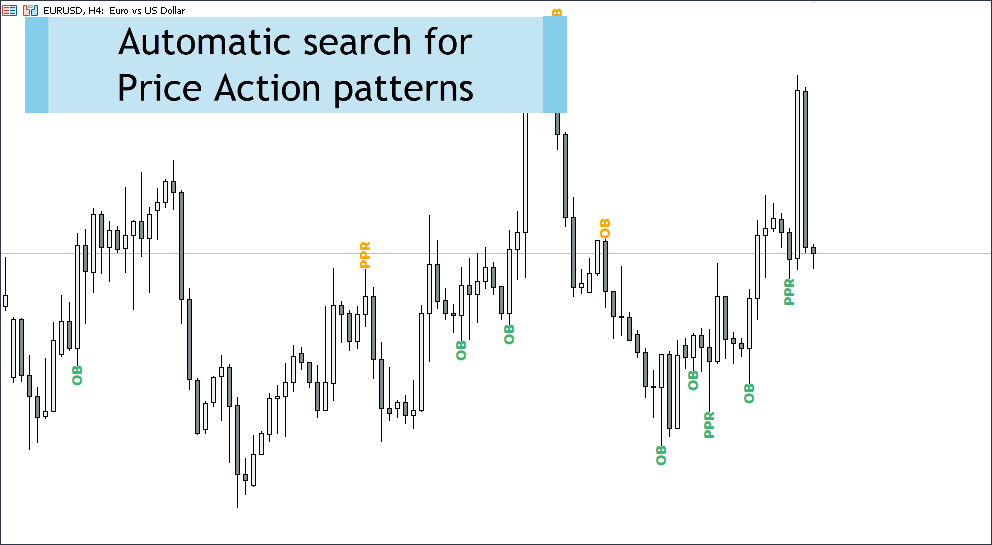
The Price Action Finder indicator is an indicator of entry points, which is designed to search and display patterns of the Price Action system on a price chart. The indicator is equipped with a system of trend filters, as well as a system of alerts and push notifications.
Manual (Be sure to read before purchasing) | Version for MT4
Advantages
1. Patterns: Pin bar, Outside bar, Inside bar, PPR, Power bar, Hanging man, Inverted hammer
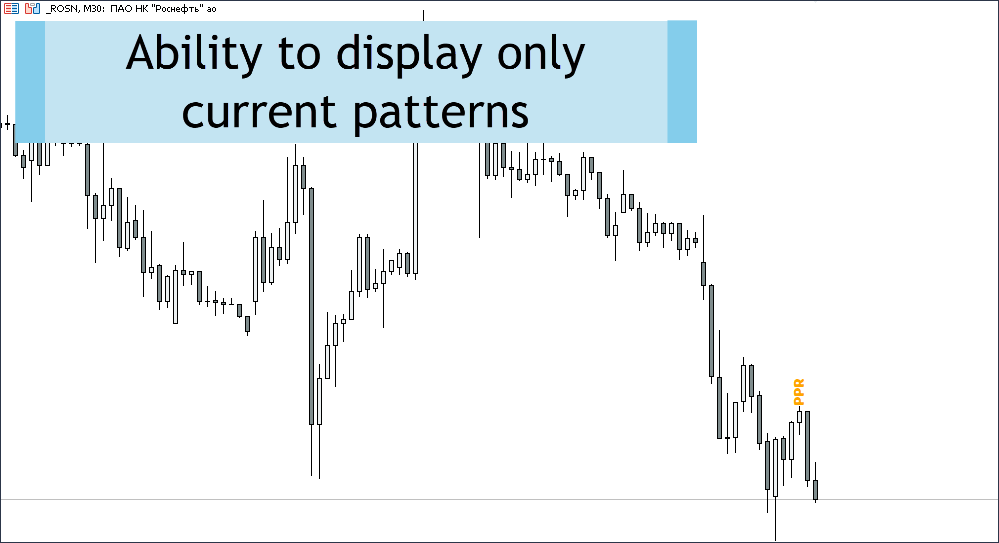
2. Pattern filtering system. Removes countertrend patterns from the chart, leaving only trending ones
3. Candle closing timer. Allows you to track not only the closure of the current candle, but also the closure of a candle of a higher time frame.
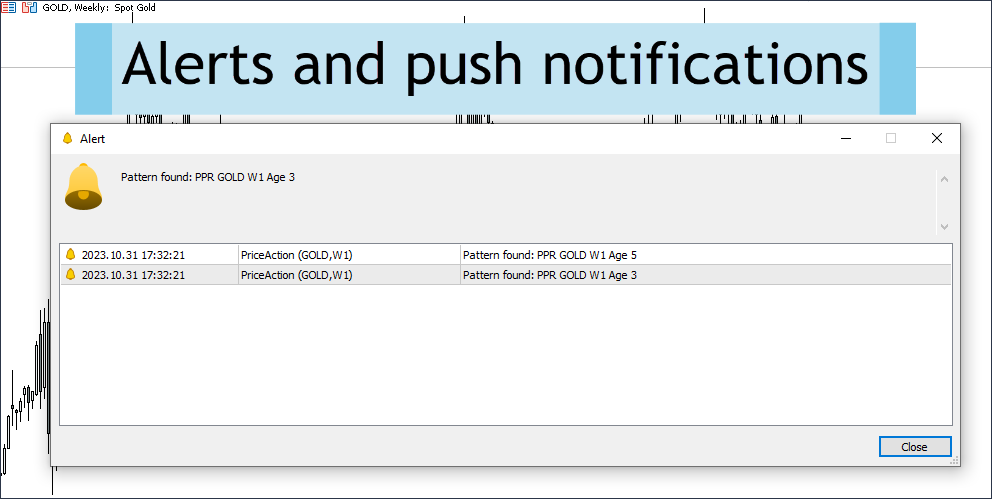
4. System of alerts and push notifications. After the pattern appears, the indicator will let you know about it.
5. Indicator customization system. You can change the color, size and font type of the patterns.


Все отлично работает возможность установки фильтра по тренду сильно помогает