Di Napoli Thrust Scanner Dashboard MT5
- Indicators
- Samil Bozuyuk
- Version: 1.1
- Updated: 13 May 2023
- Activations: 20
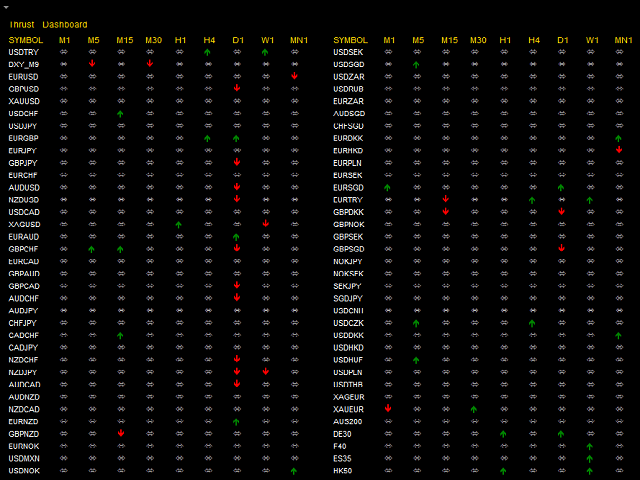
The indicator scans for Dinapoli thrust pattern in multiple timeframes for the all markets filtered and shows the results on Dashboard.
Key Features
- Dashboard can be used for all markets
- It can scan for thrust pattern on MN1, W1, D1, H4, H1, M30, M15 ,M5, M1 timeframes
- Ability to choose number of bars required above/below displaced moving average to define thrust
Parameters
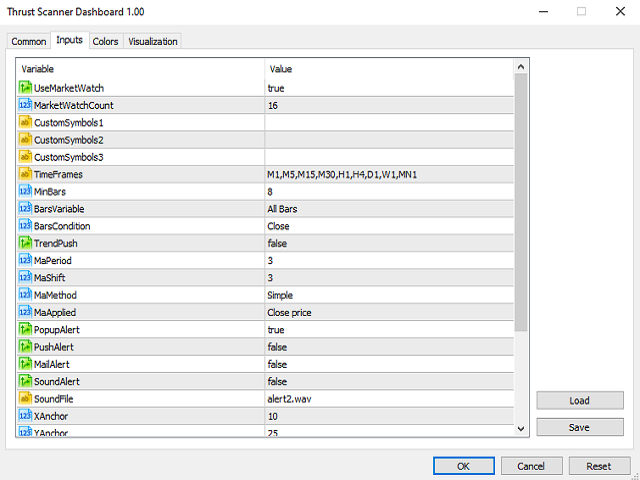
- UseMarketWatch: Set true to copy all symbols available in market watch
- MarketWatchCount : Set the number of symbols that you want to copy from the market watch list.
- CustomSymbols: Enter the custom symbols that you want to be available in dashboard.
- Minimum Bars: Least amount of bars to account for Thrust
- Bars Variable : Able to count only up or down bars
- Bars Condition: Variable to count only not touching bars over DMA line
- Trend Push : Variable to count consecutive bars with higher lows or lower highs.
- DMA Period: Moving average period
- DMA Shift: Number or bars requested to shift moving average
- DMA Method: Moving average method
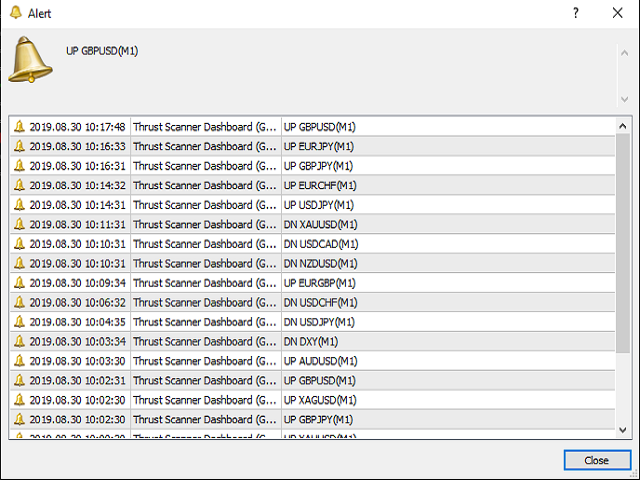
- Alert On Thrust: Specify the direction of thrust to receive an alert about. Default is Both
- Popup Alert: Set True to enable window popup and sound alert on the terminal when a fresh thrust is generated. Set False to disable
- Email Alert: Set True to receive email notifications when a fresh thrust is generated. Set False to disable.
- Push Alert: Set True to receive push notifications on your Apple or Android devices when a fresh thrust is generated. Set False to disable
- MaxRow: Limit the number of rows in dashboard.
For MT4 version, Please visit => https://www.mql5.com/en/market/product/52832
User didn't leave any comment to the rating