• Overview
  • Reviews
  • Comments
  • What's new

Current Trade Profit

Current Pips and Money Profit

This indicator displays the results of the currently open position on the graph. Result in pips and in the invoice currency. Thanks to this, you can enlarge the chart to the entire screen and have control over the result of trading without opening a terminal window which takes a space of a screen. The display positions of this data can be adjusted at the user's discretion and colors also.


Recommended products
The indicator detects and displays М. Gartley's Butterfly pattern. The pattern is plotted by the extreme values of the ZigZag indicator (included in the resources, no need to install). After detecting the pattern, the indicator notifies of that by the pop-up window, a mobile notification and an email. The pattern and wave parameters are displayed on the screenshots. The default parameters are used for demonstration purposes only in order to increase the amount of detected patterns. Parameters
30 USD
Extremum Reverse Bar
Yurij Izyumov
3.6 (10)
This indicator has been created for finding the probable reversal points of the symbol price. A small candlestick reversal pattern is used it its operation in conjunction with a filter of extremums. The indicator is not redrawn! If the extremum filter is disabled, the indicator shows all points that have a pattern. If the extremum filter is enabled, the condition works – if the history Previous bars 1 candles back contains higher candles and they are farther than the Previous bars 2 candle, such
FREE
The indicator detects and displays Shark harmonic pattern (see the screenshot). The pattern is plotted by the extreme values of the ZigZag indicator (included in the resources, no need to install). After detecting the pattern, the indicator notifies of that by a pop-up window, a mobile notification and an email. The indicator highlights the process of the pattern formation and not just the complete pattern. In the former case, it is displayed in the contour triangles. After the pattern is comple
30 USD
Great Indicator
Ruben David Santana Rodriguez
Les presento un indicador que funciona como estrategia por si solo , trabaja muy bien en periodos de 4 horas pero puedes aplicarlo a cualquier timeframe , las señales son muy faciles de interpretar , en momento en que la linea naranja pasa hacia arriba las media azul y roja , se entra en largos , la operativa se mantiene abierta hasta que la linea naranja cruce la media mas cercana ya sea la azul o la roja , si la operacion era long y la linea azul cruza hacia arriba la linea roja y la naranja c
30 USD
ChangeSymbolbutton
Zhi Peng Pei
5 (1)
ChangeSymbol Change current chart Symbol by panel button.Do not change other indicators. ChangeSymbol Change current chart Symbol by panel button.Do not change other indicators. ChangeSymbol Change current chart Symbol by panel button.Do not change other indicators. ChangeSymbol Change current chart Symbol by panel button. If you have any comments or suggestions, please leave a message for feedback If you feel good, please give five stars! Star rated comments on the left! 通过按钮改变当前货币名,不改变其他已经加载的指
FREE
Fishing
Yasha Firooz
1 (1)
Personal Note (How best to use this fishing indicator) (Metatrader 4) This is a highly intuitive indicator. I will express here, how I trade with it personally.   (Trend) 1. One way, you insert the fishing indicator onto your charts, and wait around 10mins at least, you can wait more.  The dot will become a more reliable direction color. Then you could choose to trade it. Once done. take the indicator off your chart. And then you can repeat and rinse.   (scalping)  2.   This is my perso
45 USD
Ultimate pattern builder indicator Allows you to build any pattern with up to 3 candlesticks (+ special fourth). This indicator is special because you can create any pattern you want, by modifying body and both wicks separately to your needs. If you ever wanted to create your own patterns , or just adjust any known popular pattern, then this is perfect for you. With this indicator you can learn how to build candles, testing it in strategy tester and get marked new candles on realtime charts, h
FREE
Pips Average Range
Francesco Petralla
1 (1)
This indicator compares the pips of the current day with the average of pips made in the previous three days. The "Percentage today range" is red if today's figure is less than the range of the previous three days, but turns green when the percentage exceeds 100%. When the range exceeds 100% there are good trading opportunities because we are in the presence of increased volatility of the past three days. Best use with Banks Day Levels indicator. Parameters settings corner (indicator display p
30 USD
Advanced Ichimoku Toggle Button With Alert Indicator A Very useful tool that every trader should have in their tool box This Indicator is an unique and high quality tool because it has many useful features. The ichimoku indicator consists of many elements such as kumo cloud,Kijunsen,Tenkansen,chinkou span,Span A and Span B. Different Traders use the ichimoku indicator for different strategies such as cloud breakout strategy, Tenkan kijun cross, chinkou price cross and many more...    But for m
30 USD
An indicator in the form of a panel for collecting statistics on spreads from a specified list of pairs. It is enough to open one chart and set an indicator to collect statistics for all specified pairs. After completion of work, the panel writes values to a file, which allows not to interrupt statistics after completion of work. Input parameters: -Interval to update the spread for pairs (sec) Allows you to specify how often to collect statistics (allows you to reduce the load) -List of p
FREE
Hidden V0lume
Christian Ricard
This indicator allows to hide Volume (on all MT4 timeframes) from a date define by the user with a vertical line (Alone) or a panel (with "Hidden Candles").  The color of each bar depends if this one is higher or lower of the previous bar. Indicator Inputs: No inputs for this indicator Information on "Volume" indicator is available in this post:   https://www.mql5.com/en/forum/134260 ************************************************************* Hey traders!!  Give me your feeds!  We are a commun
FREE
This indicator will mirror the assets in use in another metatrader, being able to choose the timeframe and a template. This is the Metatrader 4 Client, it needs the Metatrader 4 or 5 Server versions: Metatrader 4 Mirror Chart Server: https://www.mql5.com/en/market/product/88644 Metatrader 5 Mirror Chart Server:   https://www.mql5.com/en/market/product/88652 Details of how it works in the video.
FREE
BE auto
Muhammad Ridzuan Mohd Radzali
5 (2)
Indicator automatically draw bullish and bearish engulfing without any rules. Bearish and Bullish engulf is well known area for supply and demand area marking. This indicator can be used in any strategy that required supply demand zone. Show Last Engulf : Enable this option to show unfresh engulfing  Candle to calculate : set 0 will load all history bar and can use up more memory Bearish Engulfing Colour : Pick any colour that suit Bearish Engulfing Colour  : Pick any colour that suit -Use thi
FREE
Market Ticker Free
John Louis Fernando Diamante
5 (1)
A scrolling Market Ticker that displays price changes from all symbols in the Market Watch list. Provides an easy snapshot of symbol prices, and keeps scrolling automatically while you trade and analyse the chart. A fully featured paid version is available, with several additional options including ticker speed, and mini-charts provided: product 70671 Options include: - MTF, eg choose to show price changes of the daily chart, or the hourly - use the live candle or the recently completed - font
FREE
ST Engulfing
Curtis Daniel Jr -
Engulfing candlestick patterns are   comprised of two bars on a price chart. They are used to indicate a market reversal. The second candlestick will be much larger than the first, so that it completely covers or 'engulfs' the length of the previous bar. By combining this with the ability to look at trend direction this indicator eliminates a lot of false signals that are normally generated if no overall trend is taken into consideration
FREE
FFx Bulls Power
Eric Venturi-Bloxs
4 (4)
The purpose of this new version of the MT4 standard indicator provided in your platform is to display in a sub-window multiple timeframes of the same indicator. See the example shown in the picture below. But the display isn’t like a simple MTF indicator. This is the real display of the indicator on its timeframe. Here's the options available in the FFx indicator: Select the timeframes to be displayed (M1 to Monthly) Define the width (number of bars) for each timeframe box Alert pop up/sound/ema
FREE
EnkiSoft TrendWatch Indicator with Pips counter New version 1.62 (2020.10.16)  Product blog page   With TrendWatch Indicator you will be able to identify trends on any symbol and any timeframe. Choose the easy way, use TrendWatch indicator, and find your settings on your favourite chart. The embedded pips counter helps you to find the best settings, that differ almost on every pair and timeframe. I will provide you some settings, so you can begin profitable trading. With many setting, you can
30 USD
The indicator displays signals according to the strategy of Bill Williams on a chart: 1. Signal "First Wise Man" is formed when there is a divergent bar with angulation. A bullish divergent bar has a lower minimum and the closing price in its upper half. A bearish divergent bar has a higher maximum and the closing price at the bottom half. Angulation is formed when all three lines of Alligator are intertwined, and the price has gone up significantly(or downwards). A valid bullish/bearish div
49 USD
The Analytical cover trend indicator is a revolutionary trend trading and filtering solution with all the important features of a trend tool built into one tool! The Analytical cover indicator is good for any trader, suitable for any trader for both forex and binary options. You don’t need to configure anything, everything is perfected by time and experience, it works great during a flat and in a trend. The Analytical cover trend indicator is a tool for technical analysis of financial markets
69 USD
The indicator detects and displays 3 Drives harmonic pattern (see the screenshot). The pattern is plotted by the extreme values of the ZigZag indicator (included in the resources, no need to install). After detecting the pattern, the indicator notifies of that by a pop-up window, a mobile notification and an email. The indicator highlights the process of the pattern formation and not just the complete pattern. In the former case, it is displayed in the contour triangles. After the pattern is com
30 USD
PZ The Zone
PZ TRADING SLU
4 (3)
This indicator displays buy or sell signals according to Bill Williams' definition of the Trading Zone. [ Installation Guide | Update Guide | Troubleshooting | FAQ | All Products ] Easy to use and understand Avoid trading flat markets Deterministic indicator with clear rules The indicator is non-repainting It implements alerts of all kinds It has straightforward trading implications. A blue arrow is a buy signal A red arrow is a sell signal According to Bill Williams trading in the zone helps to
FREE
MarketProfile EForex
Veridiana Adorno Kendrick
Market Profile Shows where the price has spent more time, highlighting important levels that can be used in trading. It is a powerful tool which is designed to take the fundamental components which comprise every market; price/volume/time, and visually display their relationship in real-time as the market develops for a pre-determined time period. Very powerful tool!
30 USD
This free version can only be used for GBPUSD M15 chart . To use on all time frames and pairs , Get Pro Version The swing continuation pattern happens in a trend direction after a short reversal / pull back . As the name suggests , these patterns occurs along the swing high and swing lows of a trend , this makes the patterns very low risk patterns with potential high rewards . The swing continuation indicator also combines Currency Meter as a filter for its execution. The idea is to go with
FREE
News Scalping Executor Pro is an utility which helps to trade high impact and huge volatility   news . This utility helps to create two opposite orders with risk management and profit protection. It moves automatically stop loss level to avoid losses as much as possible by using many different algorithms. It helps to avoid trading the news if spread suddenly becomes very huge. It can lock profit by moving stop loss or partially closing of orders. To be profitable with this type of trading yo
FREE
BoxInside MT4
Evgeny Shevtsov
4.5 (8)
This indicator calculates the volume profile and places labels that correspond to the VAH, VAL and POC levels, for each candle individually. Indicator operation features The indicator works on the timeframes from M5 to MN, but it uses the history data of smaller periods: M1 - for periods from M5 to H1, M5 - for the H4 period, M30 - for the D1 period, H4 - for the W1 period, D1 - for the MN period. The color and location of the VAL, VAH and POC labels on the current candle are considered to be
FREE
Italo Trend Indicator
Italo Santana Gomes
4.76 (29)
BUY INDICATOR AND GET EA FOR FREE AS A BONUS + SOME OTHER GIFTS! ITALO TREND INDICATOR  is the best trend indicator on the market, the Indicator works on all time-frames and assets, indicator built after 6 years of experience on forex and many other markets. You know many trend indicators around the internet are not complete, does not help, and it's difficult to trade, but the Italo Trend Indicator is different , the Italo Trend Indicator shows the signal to buy or sell, to confirm the signal t
65 USD
PW Oscillator
Svyatoslav Kucher
PW Oscillator   - индикатор предназначенный для поиска локальных экстремумов, определения текущей тенденции. В расчетах индикатора используется авторская методика. С помощью индикатора можно определять места возможного разворота цены желательно в направлении тенденции, но также с достаточной точностью и против нее. Также с помощью индикатора можно определять текущую тенденцию. Индикатор подходит для любых валютных пар, но для адекватного отображения показания необходимо, чтобы было достаточно ис
30 USD
This indicator allows to hide Parabolic SAR (on all MT4 timeframes) from a date define by the user, with a vertical line (Alone) or a panel (with "Hidden Candles"). Indicator Inputs: Step Maximum  Color Width Information on "Parabolic SAR" indicator is available here:   https://www.metatrader4.com/en/trading-platform/help/analytics/tech_indicators/parabolic ************************************************************* Hey traders!!  Give me your feeds!  We are a community here and we have the sa
FREE
Plotter is an indicator that was created during the ICT mentorship to make charting quick, easy and fun for everybody. Assign a function to any hotkey in indicator settings or use the default keys to perform smart actions that usually takes a lot of time to perform. Click on any bar, press OHLCMBVPOKJH to plot objects, color them with keys 0-9 or modify them with keys ERAZ and much much more. Indicator settings are described below. CHART SETTINGS gmt_offset auto -23 - 23 daylightsavings= set dst
49 USD
This is a trading EA on M1 Chart for currency pair GBPUSD. I don't recommend you to use in other charts or currency pairs.  Backtests are performed at mt5 and my Broker is FxPro.    (Mt5 version is  https://www.mql5.com/en/market/product/55467 ) "Works On M1 Chart"; // GBPUSD Strategy Properties    Parameters are, LessOrderMoreProfitFactor_Flag = false; // Less Order More Profit Factor (trade is very rare but profit factor is high Entry_Amount = 0.01; // __Amount for a new position [lot] Take_Pr
FREE
Buyers of this product also purchase
RelicusRoad Pro
Relicus LLC
4.94 (87)
How many times have you bought a trading indicator with great back-tests, live account performance proof with fantastic numbers and stats all over the place but after using it on your account, you end up blowing your account? You shouldn't trust a signal by itself, you need to know why it appeared in the first place, and that's where RelicusRoad Indicator comes in to save the day. NOW $147 ($602 DISCOUNT) - UNLIMITED ACCOUNTS (10 PCs LICENSE) - PRICE WILL INCREASE TO $749 SOON User Manual + St
147 USD
Gold Stuff
Vasiliy Strukov
4.89 (147)
Gold Stuff is a trend indicator designed specifically for gold and can also be used on any financial instrument. The indicator does not redraw and does not lag. Recommended time frame H1. At it indicator work full auto  Expert Advisor EA Gold Stuff. You can find it at my profile. Contact me immediately after the purchase to get the settings and a personal bonus!  SETTINGS Draw Arrow - on off. drawing arrows on the chart. Alerts -   on off audible alerts. E-mail notification - on off. email notif
125 USD
Advanced Supply Demand
Bernhard Schweigert
4.94 (286)
CURRENTLY 26% OFF !! Best Solution for any Newbie or Expert Trader! This indicator is a unique, high quality and affordable trading tool because we have incorporated a number of proprietary features and a new formula. With this update, you will be able to show double timeframe zones. You will not only be able to show a higher TF but to show both, the chart TF, PLUS the higher TF: SHOWING NESTED ZONES. All Supply Demand traders will love it. :) Important Information Revealed Maximize the potenti
148 USD
Ultimate Sniper Dashboard
Hispraise Chinedum Abraham
4.78 (18)
Discounted at $299! Prices may increase in the future! Read description below! Best Entry System for Ultimate Sniper Dashboard: ULTIMATE DYNAMIC LEVELS. (Please Check my products) The Ultimate Sniper Dashboard ONLY works on live markets due to MT4 multicurrency testing limits. Introducing the Ultimate-Sniper Dashboard! Our very best which contains both HA-Sniper, MA-Sniper. and many special modes. The Ultimate Sniper Dashboard is an absolute beast! Best Solution for any Newbie or Expert Trad
299 USD
A top and bottom indicator that can intuitively identify the trend of the band. It is the best choice for manual trading, without redrawing or drifting. How to get this indicator for free: Learn more For any novice and programming trading friend, you can write the signal into the EA to play freely. Array 3 and array 4, for example, 3>4 turns green, 3<4 turns red. If you don't understand, please contact me. Original price of USD 198 ( current price of USD 69 ) - Next update price increase- unlimi
69 USD
CURRENTLY 26% OFF Best Solution for any Newbie or Expert Trader! This Indicator is a unique, high quality and affordable trading tool because we have incorporated a number of proprietary features and a new formula. With only ONE chart you can read Currency Strength for 28 Forex pairs! Imagine how your trading will improve because you are able to pinpoint the exact trigger point of a new trend or scalping opportunity? User manual: click here That's the first one, the original! Don't buy a worthle
148 USD
Scalper Vault
Oleg Rodin
5 (11)
Scalper Vault is a professional scalping system which provides you with everything you need for successful scalping. This indicator is a complete trading system which can be used by forex and binary options traders. The recommended time frame is M5. The system provides you with accurate arrow signals in the direction of the trend. It also provides you with top and bottom signals and Gann market levels. The indicators provides all types of alerts including PUSH notifications. Please contact me af
65 USD
Advanced Currency IMPULSE with ALERT
Bernhard Schweigert
4.93 (458)
CURRENTLY 31% OFF !! Best Solution for any Newbie or Expert Trader! This indicator is a unique, high quality and affordable trading tool because we have incorporated a number of proprietary features and a secret formula. With only ONE chart it gives Alerts for all 28 currency pairs. Imagine how your trading will improve because you are able to pinpoint the exact trigger point of a new trend or scalping opportunity! Built on new underlying algorithms it makes it even easier to identify and confir
88 USD
Ultimate Dynamic Levels
Hispraise Chinedum Abraham
4.86 (7)
Discounted at $199 for early birds! Prices may increase in the future. Read description below. Introducing Ultimate Dynamic Levels - the BEST Entry Indicator for the Ultimate Sniper Dashboard! Extremely Low-Risk timely entries and high RR! Find the Ultimate Sniper Dashboard Here The most important ability for both beginner and pro traders is to tell exactly where and when a market is most likely to turn, and how to get in safely and exit with profits. The Ultimate Dynamic Levels indicator ea
199 USD
Market Reversal Alerts
LEE SAMSON
4.19 (114)
Profit from market structure changes as price reverses and pulls back. The market structure reversal alert indicator identifies when a trend or price move is approaching exhaustion and ready to reverse. It alerts you to changes in market structure which typically occur when a reversal or major pullback are about to happen. The indicator identifies breakouts and price momentum initially, every time a new high or low is formed near a possible exhaustion point. The indicator draws in a rectangle on
49 USD
ICT, SMC, SMART MONEY CONCEPTS, SMART MONEY, Smart Money Concept, Support and Resistance, Trend Analysis, Price Action, Market Structure, Order Blocks, BOS/CHoCH,   Momentum Shift, HH/LL/HL/LH,    Fair Value Gap, FVG,  Premium  &   Discount   Zones, Fibonacci Retracement, OTE, Buy Side Liquidity, Sell Side Liquidity, BSL/SSL Taken, Equal Highs & Lows, MTF Dashboard, Multiple Time Frame, BigBar, HTF OB, HTF Market Structure,  Liquidity Voids, Long Wicks, Candle Timer, Fractals, ZigZag, Time Zone,
63 USD
Owl smart levels
Sergey Ermolov
5 (7)
Indicator Guide   |  Owl Smart Levels Strategy  |  MT5 version  |  How to install?  | FAQ The Owl Smart Levels Indicator  is a complete trading system within the one indicator that includes such popular market analysis tools as  Bill Williams' advanced fractals , Valable ZigZag which builds  the correct wave structure  of the market, and  Fibonacci levels  which mark the exact levels of entry into the market and places to take profits. For a detailed description of the trading system, see the a
97 USD
Italo Volume Indicator
Italo Santana Gomes
4.96 (70)
BUY INDICATOR AND GET EA FOR FREE AS A BONUS + SOME OTHER GIFTS! ITALO VOLUME INDICATOR  is the best volume indicator ever created, and why is that? The Indicator works on all time-frames and assets, indicator built after 6 years of experience on forex and many other markets. You know many volume indicators around the internet are not complete, does not help, and it's difficult to trade, but the Italo Volume Indicator is different , the Italo Volume Indicator shows the wave volume, when market
65 USD
Entry Points Pro
Yury Orlov
4.72 (214)
Top indicator for MT4 providing accurate signals to enter a trade without repainting! It can be applied to any financial assets:  forex, cryptocurrencies, metals, stocks, indices.  MT5 version is here   It will provide pretty accurate trading signals and tell you when it's best to open a trade and close it. Watch  the video  (6:22) with an example of processing only one signal that paid off the indicator! Most traders improve their trading results during the first trading week with the help of
125 USD
Currently 20% OFF ! Best Solution for any Newbie or Expert Trader! This dashboard software is working on 28 currency pairs. It is based on 2 of our main indicators (Advanced Currency Strength 28 and Advanced Currency Impulse). It gives a great overview of the entire Forex market. It shows Advanced Currency Strength values, currency speed of movement and signals for 28 Forex pairs in all (9) timeframes. Imagine how your trading will improve when you can watch the entire market using a single indi
199 USD
Cycle Sniper
Elmira Memish
4.6 (30)
NEW YEAR SALE PRICE FOR LIMITED TIME!!! Please contact us after your purchase and we will send you the complimentary indicators to complete the system. Cycle Sniper is not a holy grail but when you use it in a system which is explained in the videos, you will feel the difference. If you are not willing to focus on the charts designed with Cycle Sniper and other free tools we provide, we recommend not buying this indicator. We recommend watching the videos about the indiactor and system before
200 USD
PRO Renko System
Oleg Rodin
5 (14)
PRO Renko System is a highly accurate trading system specially designed for trading RENKO charts. The ARROWS and Trend Indicators DO NOT REPAINT! The system effectively neutralizes so called market noise giving you access to accurate reversal signals. The indicator is very easy to use and has only one parameter responsible for signal generation. You can easily adapt the tool to any trading instrument of your choice and the size of the renko bar. I am always ready to provide extra support to help
75 USD
Trend Screener
STE S.S.COMPANY
4.75 (57)
Trend Indicator, Breakthrough  unique Solution For Trend Trading And Filtering With All Important trend Features Built   Inside One Tool!   It's   100% non-repainting multi-timeframe and Multi-currencies   indicator that can be used on all symbols/instruments: forex, commodities, cryptocurrencies, indices and stocks. LIMITED TIME OFFER : Trend Screener Indicator is available for only 50 $ and lifetime. ( Original price 125$ ) Trend Screener   is efficient indicator trend following indicator ta
50 USD
Supply and Demand Dashboard PRO
Bernhard Schweigert
4.79 (19)
Currently 20% OFF ! This dashboard is a very powerful piece of software working on multiple symbols and up to 9 timeframes. It is based on our main indicator (Best reviews:   Advanced Supply Demand ). The dashboard gives a great overview. It shows: Filtered Supply and Demand values including zone strength rating, Pips distances to/and within zones, It highlights nested zones, It gives 4 kind of alerts for the chosen symbols in all (9) time-frames. It is highly configurable for your personal
199 USD
Trend Scanner GS
Vasiliy Strukov
5 (15)
Trend Scanner scans market trends from Multi-Symbols and Multi-Time frames and displays it on a movable panel on the chart. It uses  Gold stuff indicator for analysis.   Features include alerts and e-mail, as well as push notifications.  The trader can select multiple pairs of his choice for display.   Trend Scanner is a great tool to see the direction of the trend and can be used for manual trading or EA trading by allowing only buy or sell orders according to the trend. Real-time results can
125 USD
This dashboard is an alert tool for use with the market structure reversal indicator. It's primary purpose is to alert you to reversal opportunities on specific time frames and also to the re-tests of the alerts (confirmation) as the indicator does. The dashboard is designed to sit on a chart on it's own and work in the background to send you alerts on your chosen pairs and timeframes. It was developed after many people requested a dash to monitor multiple pairs and time frames at once rather th
49 USD
M1 Arrow
Oleg Rodin
5 (6)
Please contact me after purchase! I will share my trading tips with you and great bonus indicators for free! This is an intraday strategy based on two fundamental principles of the market.  Trading is conducted on M1 charts, though it is possible to use other time frames as well. The algorithm is based on the analysis of volumes and price waves using additional filters. The intelligent algorithm of the indicator gives a signal only when two market factors combine into one. The indicator calcula
65 USD
Swing Scanner
Reza Aghajanpour
4.6 (20)
** All Symbols x All Timeframes scan just by pressing scanner button ** *** Contact me after the purchase to send you instructions and add you in "Swing scanner group" for sharing or seeing experiences with other users. CURRENT PRICE $39..... Future Price $200 Introduction: Swing Scanner is the indicator designed to detect swings in the direction of the trend and possible reversal swings. The indicator studies several price and time vectors to track the aggregate trend direction and detects si
39 USD
Strong Support
Vasiliy Strukov
5 (14)
Support and resistance levels have long been a powerful tool for market analysis. The Strong Support indicator plots support levels based on local price minima, and resistance levels based on local price maxima. My other developments can be viewed here It is recommended to use together with a trend indicator, for example, Gold Stuff - this will allow you to trade according to the trend and simultaneously determine the zones of consolidation or trend reversal, as well as set stop loss and ta
125 USD
The ADR Reversal Indicator shows you at a glance where price is currently trading in relation to it's normal average daily range. You will get instant alerts via pop-up, email or push when price exceeds it's average range and levels above it of your choosing so you can jump into pullbacks and reversals quickly. The indicator draws horizontal lines on the chart at the average daily range extremes and also extensions above those levels which have mathematical probabilities attached to them of pric
49 USD
TrendLine PRO MT4
Evgenii Aksenov
4.88 (248)
The Trend Line PRO indicator is an independent trading strategy. It shows the trend change, the entry point to the transaction, as well as automatically calculates three levels of Take Profit and Stop Loss protection Trend Line PRO is perfect for all Meta Trader symbols: currencies, metals, cryptocurrencies, stocks and indices Advantages of Trend Line PRO Never redraws its signals The possibility of using it as an independent strategy It has three automatic levels Take Profit and Stop Loss leve
75 USD
Forex Master Pattern MT4
Alberto Gauer Borrego
4.62 (13)
The Forex Master Pattern  is an alternative form of technical analysis that provides a framework which will help you to find and follow the hidden price pattern that reveals the true intentions of financial markets. This algorithm here does a good job detecting the Phase 1 of the Forex Master Pattern cycle, which is the contraction point (or Value).  On Phase 2 we get higher timeframe activation (also called Expansion), which is where price oscillates above and below the average price defined
49 USD
Volume by Price MT4
Brian Collard
5 (14)
The Volume by Price Indicator for MetaTrader 4 features Volume Profile and Market Profile TPO (Time Price Opportunity). Get valuable insights out of currencies, equities and commodities data. Gain an edge trading financial markets. Highest quality real-time and historical price data distributions. Versatile range selection methods. Drag and drop with time/price option. Unlimited segmentation. Session filtering with built-in presets for New York, London, Tokyo, Sydney and São Paulo. Composites w
149.95 USD
TPA True Price Action indicator reveals the true price action of the market makers through 100% non-repainting signals (except early signals mode) strictly at the close of a candle! TPA shows entries and re-entries, every time the bulls are definitely stronger than the bears and vice versa. Not to confuse with red/green candles. The shift of power gets confirmed at the earliest stage and is ONE exit strategy of several. There are available now two free parts of the TPA User Guide for our custo
168 USD
Scalper Inside PRO
Alexey Minkov
4.67 (42)
This is an innovative indicator that uses an exclusive algorithm to quickly and accurately determine the trend. The indicator automatically calculates the opening and closing time of positions, as well as detailed statistics of the indicator's performance for a certain period of history, which allows you to choose the best trading tool for your trade. You can also connect your custom arrow indicators to Scalper Inside Pro to check and calculate their statistics and profitability. Scalper Inside
139 USD
More from author
Economic Calendar Viewer
Boguslaw Nejmanowski
3 (1)
Economic Calendar Viewer This economic events reader is adapted to load data from a csv file. You can prepare the csv file yourself according to this template, you can do it in notepad or csved. The file should normally be named Calendar-MM-DD-YYYY.csv. And contain lines with data column headers according to this example. In the Impact column, i.e. impact on the market depending on the importance of the event, the names accepted from the least important are: None, Low, Medium, High. In column
FREE
The London Stock Exchange Session's Hours This indicator facilitates observing the currency pair's quotations during subsequent parts of the stock exchange session live. Before the session starts, a rectangle is drawn on the chart but not filled in with color. It means the extent of the session duration. Before the first bar enters the rectangle of the session, a sound signal or pop-up window will notify us that the session will just start. When the price graph crosses the edge of the session
FREE
My Account Brokers Details
Boguslaw Nejmanowski
5 (1)
My Account Brokers Details This indicator displays the account data and broker terms regarding its operation. For example, broker name, account number, financial leverage, account currency, automatic trading approval, minimum lot, lot step, maximum number of lot, margin call, stop out and many other important data. It is easier to display such data on the chart in one moment with a click of the mouse, than to look for it in the contract or call the broker.
FREE
The Stock Exchange One Sessions Hours version 2.00 This indicator facilitates observing the currency pair's quotations during subsequent parts of the stock exchange session live. Before the session starts, a rectangle is drawn on the chart but not filled in with color. It means the extent of the session duration. Before the first bar enters the rectangle of the session, a sound signal or pop-up window will notify us that the session will just start. When the price graph crosses the edge of th
FREE
Calendar File Converter This script adapts the csv economic calendar file downloaded from the myfxbook.com portal for use by the Economic Calendar Viewer indicator. This indicator displays on the MT4 chart data about the upcoming current economic event and displays its data. It also notifies you with a sound before the upcoming event time. The read file should be named: - calendar_statement.csv The temporary intermediate file is named: - calendar_statement2.csv The output file is named: - Cal
FREE
The Tokyo Stock Exchange Session's Hours This indicator facilitates observing the currency pair's quotations during subsequent parts of the stock exchange session live. Before the session starts, a rectangle is drawn on the chart but not filled in with color. It means the extent of the session duration. Before the first bar enters the rectangle of the session, a sound signal or pop-up window will notify us that the session will just start. When the price graph crosses the edge of the session
FREE
Todays High and Low
Boguslaw Nejmanowski
Todays High and Low This indicator draws lines at the highest price of the day and at the lowest price of the day. Both lines are ended with labels with the maximum and minimum prices written. Lines and labels are moved according to the chart progress in real time. The indicator works on all chart time intervals. You can change and set colors and shift the chart. The indicator allows you to observe the price movement on the chart and not lose sight of the price maxima and minima achieved.
FREE
The Toronto Stock Exchange Session's Hours This indicator facilitates observing the currency pair's quotations during subsequent parts of the stock exchange session live. Before the session starts, a rectangle is drawn on the chart but not filled in with color. It means the extent of the session duration. Before the first bar enters the rectangle of the session, a sound signal or pop-up window will notify us that the session will just start. When the price graph crosses the edge of the sessio
FREE
The Bombay Stock Exchange Session's Hours This indicator facilitates observing the currency pair's quotations during subsequent parts of the stock exchange session live. Before the session starts, a rectangle is drawn on the chart but not filled in with color. It means the extent of the session duration. Before the first bar enters the rectangle of the session, a sound signal or pop-up window will notify us that the session will just start. When the price graph crosses the edge of the session
FREE
Current Order Take Profit this indicator shows settled level of Take profit current opened order. If order Take Profit will be changed it will be shown on screen immediately. The same with pips left to get so as to close the position. If the price will drop beneeth the open order price it will change the color of pips digits left to gain. That is usefull when you change Take profit level by drag the price line using mouse to new level na wykresie.
FREE
My Account Brokers Details List This script displays the account data and broker terms regarding its operation. For example, broker name, account number, financial leverage, account currency, automatic trading approval, minimum lot, lot step, maximum number of lot, margin call, stop out and many other important data. It is easier to display such data on the chart in one moment with a click of the mouse, than to look for it in the contract or call the broker. Details are printed not on the scree
FREE
Account Cash Status
Boguslaw Nejmanowski
Account Cash Status This indicator shows actual account balance and equity. Can be placed in any position on chart even in subwindow. Account Balance is displayed in gray color. When there is no opened position the account equity is displayed in dark gray color. When there is opened position and equity value is lower than balance value the color is changed for red. When there is opened position and equity value outperforms balance value the color is changed for lime. Colors may be set freely by
FREE
The Shanghai Stock Exchange Session's Hours This indicator facilitates observing the currency pair's quotations during subsequent parts of the stock exchange session live. Before the session starts, a rectangle is drawn on the chart but not filled in with color. It means the extent of the session duration. Before the first bar enters the rectangle of the session, a sound signal or pop-up window will notify us that the session will just start. When the price graph crosses the edge of the sessi
FREE
The Hong Kong Stock Exchange Session's Hours This indicator facilitates observing the currency pair's quotations during subsequent parts of the stock exchange session live. Before the session starts, a rectangle is drawn on the chart but not filled in with color. It means the extent of the session duration. Before the first bar enters the rectangle of the session, a sound signal or pop-up window will notify us that the session will just start. When the price graph crosses the edge of the sess
FREE
That indicator shows on chart actual amount of lots currently opened position and Take Profit pips numnber and pips left to get. All objects can be placed at any place of chart by user choice. Objects text can be set by user also by writing new text in indicator's parameters window. Each object color can ve set to any color from the palette of colors delivered by MT4 editor.
FREE
The Shenzhen Stock Exchange Session's Hours This indicator facilitates observing the currency pair's quotations during subsequent parts of the stock exchange session live. Before the session starts, a rectangle is drawn on the chart but not filled in with color. It means the extent of the session duration. Before the first bar enters the rectangle of the session, a sound signal or pop-up window will notify us that the session will just start. When the price graph crosses the edge of the sessi
FREE
The New York Stock Exchange Session's Hours This indicator facilitates observing the currency pair's quotations during subsequent parts of the stock exchange session live. Before the session starts, a rectangle is drawn on the chart but not filled in with color. It means the extent of the session duration. Before the first bar enters the rectangle of the session, a sound signal or pop-up window will notify us that the session will just start. When the price graph crosses the edge of the sessi
30 USD
The NASDAQ Stock Exchange Session's Hours This indicator facilitates observing the currency pair's quotations during subsequent parts of the stock exchange session live. Before the session starts, a rectangle is drawn on the chart but not filled in with color. It means the extent of the session duration. Before the first bar enters the rectangle of the session, a sound signal or pop-up window will notify us that the session will just start. When the price graph crosses the edge of the session
30 USD
Filter:
No reviews
Reply to review
Version 15.0 2021.03.25
Current Trade Profit ver. 15.0

That is the final improvement of display objects.
Version 14.0 2021.03.24
Current Trade Profit ver. 14.0

There were improved pocedure of color display of every object on the chart.
Version 13.0 2021.03.21
Current Trade Profit ver. 13.0

Umproved display colors of digits.
Version 12.0 2021.03.20
Current trade Profit ver. 12.0

There were made few improvements of display pips to get and TP value.
Version 11.0 2021.03.17
Current Trade Profit ver. 11.0

Last bugs removed and final improvement of code execution.
Version 10.0 2021.03.16
Current Trade Profit ver. 10

Couple improvements to accelerate executive of indicator.
Version 9.0 2021.03.10
Current Trade Profit ver. 9.0

Finally were added all of the possible situations of changing type of currently opened position and color changing options.
Version 8.0 2021.03.10
Current Trade Profit ver. 8.0

This is the last version of this utility clean from bugs and smoothly working.
Version 7.0 2021.03.09
Current Trade Profit ver. 7.0

Optimized execution process, and improved objects display.
Version 6.0 2021.03.09
Currrent Trade Profit ver. 6.0

Final improvement for display objects colors and changing them and some bugs remove.
Version 5.0 2021.03.09
Current Trade Profit ver. 5.0

Last error was removed and improved color display.
Version 4.0 2021.03.09
Current Trade Profit ver. 4.0

there was made couple of improvements and bugs cleaning changes.
Version 3.0 2021.03.08
Current Trade Profit 3.0

Just removed some bugs.
Version 2.0 2021.03.08
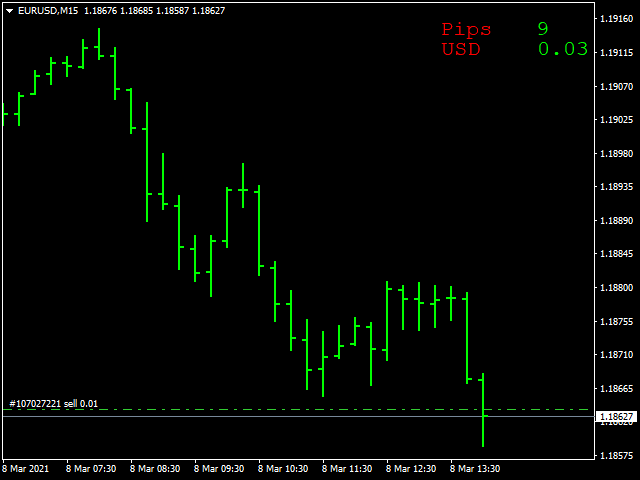
Current Trade profit 2.0
There where made display improvements changes.