• Overview
  • Reviews (2)
  • Comments (20)
  • What's new

Engulfing Candlestick Pattern Scanner

1

This scanner is monitoring the entire market for trade opportunities for all symbols and for all time frames. You don't have to look to all the charts, for all symbols and for all time frames. This scanner will alert you on your computer, or on your mobile, when a trade opportunity has been found. You never have to miss a trade opportunity!

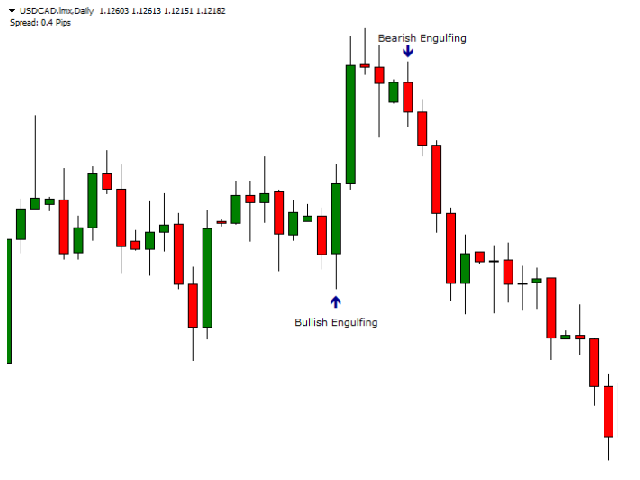
This indicator is designed to scan all pairs and symbols, for all selected time frames, to find an Engulfing Candlestick Pattern.


Features

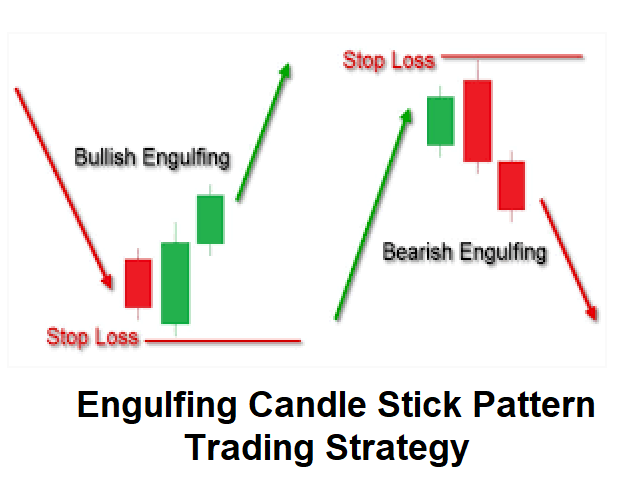
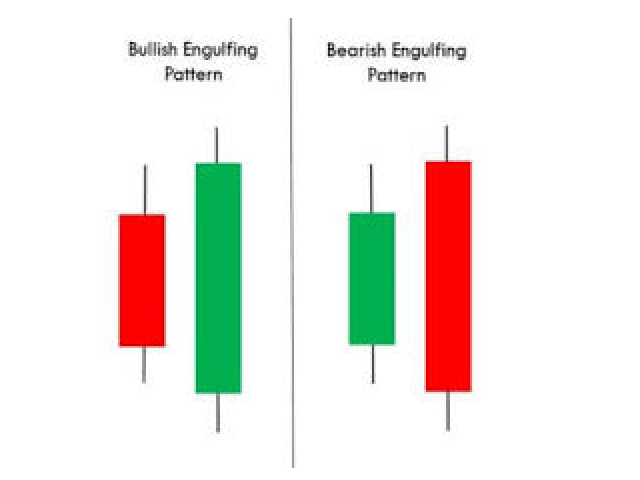
The scanner will send an alert if an Engulfing Candlestick Pattern has been found. Engulfing candle high and low engulfs the previous candle high and low. Engulfing candlestick patterns is a reversal candlestick pattern.

Other features:

  • Scans all symbols visible in your Market Watch window, or all symbols the same time
  • Indicator only have to be installed on one chart to scan the entire market
  • Specify which time frame you want to monitor. Each time frame can be selected in the settings
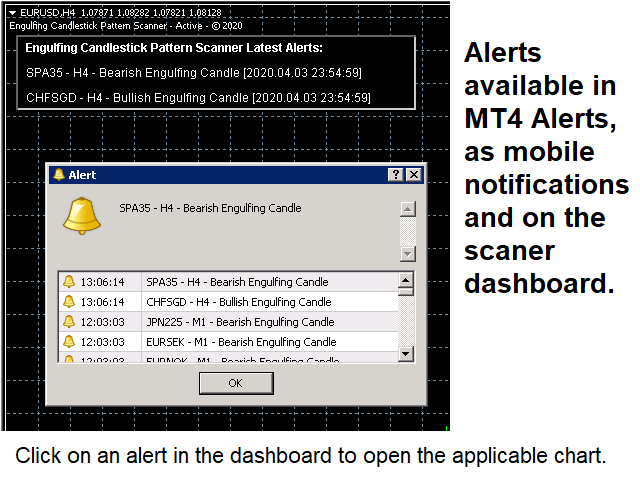
  • Receive Alerts in the MT4 terminal for each trade opportunity found
  • Dashboard will show the latest alerts provided by this Scanner. Click on an alert in the dashboard to open a new chart for the applicable Symbol and time frame. The new chart will highlight the alert with a vertical line
  • Receive Alerts on your mobile phone, so you never miss a trade opportunity!
  • Low CPU usage

Installation

  • Download the Indicator in your MT4 terminal after you have purchased the product.
  • Place the indicator on one chart in your MT4 terminal (it does not matter what chart is used, any symbol and time frame can be used), and from that moment the entire market will be scanned for all pairs and symbols, and for all time frames as you have configured.


    Parameters

    ----------- General settings ----------- 

    • Send signals to Alert Message Box: If set to true, alerts will be issued to your MT4 terminal
    • Send signals to Mobile (Notifications): If set to true, alerts will be issued to your mobile using the MT4 Notifications
    • Scan pairs in Market Watch only: If set to true, only pairs and symbols within the MT4 Market Watch will be scanned. If set to false, all pairs and symbols available for your broker will be scanned and monitored
    • Symbols To Scan: You can enter symbols you want to scan by this scanner in this field. The symbols needs to be the same as they are shown on your Market Watch window. The field is case sensitive. Each symbol needs to be separated by a comma (,)
    • Alert and Scan for each Xx bar: If set to true, pairs and symbols are scanned for each new bar of the applicable time frame
    ----------- Indicator settings --------—
    • Minimum Difference between bars (pips): Specify how many pips difference should be as a minimum between the engulfing candlestick and the previous bar
    • Minimum size of last bar (pips): Minimum size of the Engulfing Candlestick in pips
    • Maximum size of last bar (pips): Maximum size of the Engulfing Candlestick in pips
    • Minimum body size of last bar (pips): Minimum size of the body of the Engulfing Candlestick in pips
    • Engulfing body size twice the size of the body for the previous bar

    ----------- Display settings -----------

    • Show Comments on chart: If set to True, comments will be shown in the top left corner to show that the indicator is loaded. If set to False, no comments will be shown
    • Show Dashboard on chart: If True, a dashboard will be shown on the Chart with the latest alerts provided by this Scanner. When you click on the alert in the dashboard, a new chart will be opened for the applicable Symbol and time frame
    • Clear Dashboard at start of new Day: If True, all alerts will be removed from the dashboard at start of each new trading day
    • Define Text color: Define the text color for all the text on the dashboard
    • Maximum number of Alerts printed on Chart
    • AlertLineColor / Style: Define the color and style of the vertical Line for Bullish and Bearish Alerts
    • Template for new chart


    Recommended products
    Owl smart levels
    Sergey Ermolov
    4.63 (54)
    MT5 version  |  FAQ The Owl Smart Levels Indicator  is a complete trading system within the one indicator that includes such popular market analysis tools as  Bill Williams' advanced fractals , Valable ZigZag which builds  the correct wave structure  of the market, and  Fibonacci levels  which mark the exact levels of entry into the market and places to take profits. Detailed description of the strategy Instructions for working with the indicator Advisor-assistant in trading Owl Helper Private
    The Th3Eng PipFinite indicator is based on a very excellent analysis of the right trend direction with perfect custom algorithms. It show the true direction and the best point to start trading. With StopLoss point and Three Take Profit points. Also it show the right pivot of the price and small points to order to replace the dynamic support and resistance channel, Which surrounds the price. And Finally it draws a very helpful Box on the left side on the chart includes (take profits and Stop loss
    Infinity Trend Pro
    Yaroslav Varankin
    1 (1)
    This is a trend indicator without redrawing Developed instead of the binary options strategy (by the color of the Martingale candlestick) Also works well in forex trading When to open trades (binary options) A signal will appear in the place with a candle signaling the current candle It is recommended to open a deal for one candle of the current timeframe M1 and M5 When a blue dot appears, open a deal up When a red dot appears, open a trade down. How to open trades on Forex. When a signal is rec
    Noize Absorption Index MT4
    Ekaterina Saltykova
    5 (1)
    Noize Absorption Index - is the manual trading system that measures the difference of pressure between bears forces and bulls forces. Green line - is a noize free index that showing curent situation. Zero value of index shows totally choppy/flat market.Values above zero level shows how powerfull bullish wave is and values below zero measures bearish forces.Up arrow appears on bearish market when it's ready to reverse, dn arrow appears on weak bullish market, as a result of reverse expectation. S
    HMA Trend Professional MT4
    Pavel Zamoshnikov
    4.63 (8)
    Improved version of the free HMA Trend indicator (for MetaTrader 4) with statistical analysis. HMA Trend is a trend indicator based on the Hull Moving Average (HMA) with two periods. HMA with a slow period identifies the trend, while HMA with a fast period determines the short-term movements and signals in the trend direction. The main differences from the free version: Ability to predict the probability of a trend reversal using analysis of history data. Plotting statistical charts for analyz
    Fibonacci retracement and extension line drawing tool Fibonacci retracement and extended line drawing tool for MT4 platform is suitable for traders who use  golden section trading Advantages: There is no extra line, no too long line, and it is easy to observe and find trading opportunities Trial version: https://www.mql5.com/zh/market/product/35884 Main functions: 1. Multiple groups of Fibonacci turns can be drawn directly, and the relationship between important turning points
    Master Scalping M1 is an innovative indicator that uses an algorithm to quickly and accurately determine the trend.The indicator calculates the time of opening and closing positions, the indicator's algorithms allow you to find the ideal moments to enter a deal (buy or sell an asset), which increase the success of transactions for most traders. Benefits of the indicator: Easy to assemble, does not overload the chart with unnecessary information. Can be used as a filter for any strategy. Works on
    Heiken Ashi candle chart is an improved version of The Japanese candle chart, which can effectively filter the market "noise" of the Japanese candle chart. It is favored by many traders for its simplicity and intuition. For trend traders, the HA candle chart is a magic tool. Unlike the traditional Japanese candle chart, Heikenashi does not reflect the opening price, high price, low price and closing price of the market. Instead, Heikenashi calculates the value of a single K line in the dominant
    Trendiness Index
    Libertas LLC
    5 (3)
    "The trend is your friend" is one of the best known sayings in investing, because capturing large trendy price movements can be extremely profitable. However, trading with the trend is often easier said than done, because many indicators are based on price reversals not trends. These aren't very effective at identifying trendy periods, or predicting whether trends will continue. We developed the Trendiness Index to help address this problem by indicating the strength and direction of price trend
    Daily Candle Predictor is an indicator that predicts the closing price of a candle. The indicator is primarily intended for use on D1 charts. This indicator is suitable for both traditional forex trading and binary options trading. The indicator can be used as a standalone trading system, or it can act as an addition to your existing trading system. This indicator analyzes the current candle, calculating certain strength factors inside the body of the candle itself, as well as the parameters of
    Cosmic Diviner X Planet
    Olena Kondratenko
    4 (2)
    This unique multi-currency strategy simultaneously determines the strength of trends and market entry points, visualizing this using histograms on the chart. The indicator is optimally adapted for trading on the timeframes М5, М15, М30, Н1. For the convenience of users, the indicator renders the entry point (in the form of an arrow), recommended take profit levels (TP1, TP2 with text labels) and the recommended Stop Loss level. The take profit levels (TP1, TP2) are automatically calculated for
    This indicator monitors the market for a flat state and possible breakout. The flat state is detected as a predefined number of consecutive bars during which price fluctuates inside a small range. If one of the next bars closes outside the range, breakout is signaled. The indicator shows 3 lines: blue - upper bound of flat ranges AND consecutive breakout areas; red - lower bound of flat ranges AND consecutive breakout areas; yellow - center of flat ranges (NOT including breakout areas). When a b
    This is a new strategy for SUPPLY DEMAND areas It is based on a calculation using the tick volume to detect the big price action in market for both bear /bull actions this smart volume action candles are used to determine the supply and demand areas prices in between main supply and demand lines indicate sideway market  up arrows will be shown when prices moves above the main supply and the secondary supply lines Down arrows will be shown when prices moves below the main demand and the secondary
    Quantum Heiken Ashi PRO MT4
    Bogdan Ion Puscasu
    4.43 (7)
    Introducing the   Quantum Heiken Ashi PRO charts with alerts Designed to provide clear insights into market trends, the Heiken Ashi candles are renowned for their ability to filter out noise and eliminate false signals. Say goodbye to confusing price fluctuations and hello to a smoother, more reliable chart representation. Buy  Quantum Heiken Ashi PRO and you could  get Quantum Breakout Indicator or Quantum Trend Sniper Indicator for free. Ask us how with a private message. What makes the Qua
    What are Heiken Ashi Candles? Heiken Ashi, derived from the Japanese term 'Heikin Ashi,' translates to average price bars. It's an indicator depicting price bars on a chart. Formula for Heiken Ashi candles: - Heiken Ashi opening price: (previous candle's opening + closing price) / 2 - Closing price Heiken Ashi: (opening + high + low + closing) / 4 - Heiken Ashi peak: Max of high, opening, or closing price - Heiken Ashi bottom price: Min of low, opening, or closing price How to Read Heik
    ZhiBiCCI MT4
    Qiuyang Zheng
    5 (1)
    [ZhiBiCCI] indicators are suitable for all cycle use, and are also suitable for all market varieties. [ZhiBiCCI] Green solid line is a reversal of bullish divergence. The green dotted line is a classic bullish divergence. [ZhiBiCCI] The solid line to the red is a reverse bearish divergence. The red dotted line is a classical bearish divergence. [ZhiBiCCI] can be set in the parameters (Alert, Send mail, Send notification), set to (true) to send instant signals to the alarm window, email, in
    Title : Market Bias Indicator - Oscillator-Based Trading Tool Introduction : Discover the potential of the "Market Bias Indicator," a revolutionary oscillator-based trading tool designed for precise market analysis. If you're in search of a robust alternative to traditional bias indicators, your quest ends here. Market Bias Indicator offers unparalleled accuracy in identifying market sentiment and is your gateway to confident trading decisions. Recommended Trading Pairs : Market Bias Indicator i
    Super Gator
    Agustinus Biotamalo Lumbantoruan
    This indi shows the following 1. Supertrend 2. Alligator (Not a regular alligator) 3. ZigZag 4. Moving Average 5. Trend Continuation/Mini correction Signal (plotted in X) (See screenshots in green background color 6. Early Signal Detection (See screenshots in green background color) You may treat Alligator as the lagging indicator The leading indicator is the supertrend. The zig zag is based on the leading indicator where it gets plotted when the leading indicator got broken to the opposite.
    Stepping Trend
    Mpendulo Chiliza
    The Stepping Trend Indicator     The Steppi ng Trend indicator uses the  average true range  (ATR indicator) in its calculation. This gives you control to set your own average true range period, I set the Default as 10.   Indicator Details. Green Arrow Up: This means you are at the starting point of a new bullish trend, it’s time to buy.   Red  Arrow  Down : This means you are at the starting point of a new  bearish  trend, it’ s time to sell .   What if you miss the Arrow Signal?   No
    Signal trend indicator. Detects the direction of the trend and is coloured accordingly.  Has built in audible and visual alerts when trends change. Can send notifications to your phone or email. Allows Trend and Counter-Trend trading. Works on all timeframes, all currency pairs, metals, indices and cryptocurrencies. Can be used with binary options. Distinctive features No re-drawing; Simple and clear settings; Four types of alerts; Works on all timeframes and all trading tools; Su
    The indicator displays the data of the Stochastic oscillator from a higher timeframe on the chart. The main and signal lines are displayed in a separate window. The stepped response is not smoothed. The indicator is useful for practicing "manual" forex trading strategies, which use the data from several screens with different timeframes of a single symbol. The indicator uses the settings that are identical to the standard ones, and a drop-down list for selecting the timeframe. Indicator Parame
    Sto Signal AM
    Andriy Matviyevs'kyy
    This indicator displays Stochastic osc signals on the price chart and allows the user to receive notifications of such signals. The Stochastic indicator is a classic and proven indicator of the technical analysis of the markets. Despite its age, it is still relevant today. Depending on the settings, the indicator allows you to work effectively on various TFs and any markets. Signals are given on fully formed bars and are not redrawn. Custom Parameters: Stochastic_Price (0-1) - The applied pric
    Introduction The "Two Moving Average Crossover" indicator for MetaTrader 4 (MT4) is a technical analysis tool that displays two moving averages and notifies when the moving averages cross each other. The indicator calculates and plots two moving averages, one of which is faster and the other is slower. When the faster moving average crosses above the slower moving average, it is considered a bullish signal, indicating a potential trend reversal or the start of a new uptrend. Conversely, when th
    Chart Patterns Detect 15 patterns (Ascending Triangle, Descending Triangle, Rising Wedge, Falling Wedge, Bullish Flag, Bearish Flag, Bullish Rectangle, Bearish Rectangle Symmetrical triangle, Head and Shoulders, Inverted Head and Shoulders, Triple top, Triple Bottom, Double Top, Double Bottom) Use historical data to calculate the probability of each pattern to succeed (possibility to filter notification according to the chance of success) gives graphic indication about the invalidation level and
    Trend Master Chart MT4
    Frederic Jacques Collomb
    Trend Master Chart is the trend indicator you need. It overlays the chart and uses color coding to define different market trends/moves. It uses an algorithm that combines two moving averages and different oscillators. The periods of these three elements are modifiable. It works on any time-frame and any Pair. At a glance you will be able to identify an upward or downward trend and the different entry points into this trend. For example during a marked upward trend (light green color) the dif
    FREE
    Blahtech Market Profile
    Blahtech Limited
    4.61 (18)
    Was: $249  Now: $99   Market Profile defines a number of day types that can help the trader to determine market behaviour. A key feature is the Value Area, representing the range of price action where 70% of trading took place. Understanding the Value Area can give traders valuable insight into market direction and establish the higher odds trade. It is an excellent addition to any system you may be using. Blahtech Limited presents their Market Profile indicator for the MetaTrader community. Ins
    For sure, this indicator has become very popular amongst traders. Through coding this indicator will give you the most accurate levels possible for your trading analysis. We have also added in the ability for you to receive alerts when the price breaks above or below a Support or Resistance lines! HOW TO USE The red rectangles represent your resistance/supply zone. The green rectangles represent your support/demand zone.  BONUS FEATURES We coded this indicator with the ability to switch between
    TWO PAIRS SQUARE HEDGE METER INDICATOR Try this brilliant 2 pairs square indicator It draws a square wave of the relation between your two inputs symbols when square wave indicates -1 then it is very great opportunity to SELL pair1 and BUY Pair2 when square wave indicates +1 then it is very great opportunity to BUY pair1 and SELL Pair2 the inputs are : 2 pairs of symbols         then index value : i use 20 for M30 charts ( you can try other values : 40/50 for M15 , : 30 for M30 , : 10 for H1 ,
    An indicator of pattern #31 ("Long Island") from Encyclopedia of Chart Patterns by Thomas N. Bulkowski. The second gap is in the opposite direction. Parameters: Alerts - show alert when an arrow appears   Push - send a push notification when an arrow appears (requires configuration in the terminal) GapSize - minimum gap size in points ArrowType - a symbol from 1 to 17 ArrowVShift - vertical shift of arrows in points   ShowLevels - show levels ColUp - color of an upward line ColDn - color of
    Akendicator X
    Flavio Graziano
    Akendicator X is a Non-repainting Indicator for trading at 5-15 minutes Timeframe.  Akendicator X extimates with clear arrows, in which direction the next candlestick will move. Pratically, when the length of the last candle reaches and exceeds a particular value (called Candle Power) immediately, after its closing, an arrow appears indicating whether the next candle could be Bullish or Bearish. I created a manual in pdf where you should learn exactly how to use AKENDICATOR X correctly; I will s
    Buyers of this product also purchase
    Gann Made Easy
    Oleg Rodin
    4.95 (43)
    Gann Made Easy is a professional and easy to use Forex trading system which is based on the best principles of trading using the theory of mr. W.D. Gann. The indicator provides accurate BUY and SELL signals including Stop Loss and Take Profit Levels. You can trade even on the go using PUSH notifications. PLEASE CONTACT ME AFTER PURCHASE TO GET MY TRADING TIPS PLUS A GREAT BONUS! Probably you heard already many times about Gann trading methods. Usually Gann's theory is very complex thing not only
    Introducing the Miraculous Forex Indicator: Unleash the Power of Precision Trading Are you tired of searching for the perfect forex indicator that truly delivers exceptional results across all time frames? Look no further! The Miraculous Forex Indicator has arrived to revolutionize your trading experience and propel your profits to new heights. Built upon a foundation of cutting-edge technology and years of meticulous development, the Miraculous Forex Indicator stands as the pinnacle of str
    Currently 20% OFF ! Best Solution for any Newbie or Expert Trader! This dashboard software is working on 28 currency pairs plus one. It is based on 2 of our main indicators (Advanced Currency Strength 28 and Advanced Currency Impulse). It gives a great overview of the entire Forex market plus Gold or 1 indices. It shows Advanced Currency Strength values, currency speed of movement and signals for 28 Forex pairs in all (9) timeframes. Imagine how your trading will improve when you can watch the e
    Atomic Analyst
    Issam Kassas
    5 (1)
    First of all Its worth emphasizing here that this Trading Indicator is   Non-Repainting ,   Non-Redrawing   and   Non-Lagging   Indicator, Which makes it ideal from both manual and robot trading.  The Atomic Analyst  is a PA Price Action Indicator that uses Strength and Momentum of the price to find a better edge in the market. Equipped with Advanced filters which help remove noises and false signals, and Increase Trading Potential. Using Multiple layers of complex Indicators, the Atomic Anal
    TPSproTREND PrO
    Roman Podpora
    5 (15)
    TPSpro TRENDPRO  - is a trend indicator that automatically analyzes the market and provides information about the trend and each of its changes, as well as giving signals for entering trades without redrawing! The indicator uses each candle, analyzing them separately. referring to different impulses - up or down impulse. Exact entry points into transactions for currencies, crypto, metals, stocks, indices!  -  Version MT5               DETAILED DESCRIPTION        /       TRADING SETUPS           
    CURRENTLY 26% OFF Best Solution for any Newbie or Expert Trader! This Indicator is a unique, high quality and affordable trading tool because we have incorporated a number of proprietary features and a new formula. With only ONE chart you can read Currency Strength for 28 Forex pairs! Imagine how your trading will improve because you are able to pinpoint the exact trigger point of a new trend or scalping opportunity? User manual: click here That's the first one, the original! Don't buy a worthle
    TPSpro RFI Levels
    Roman Podpora
    5 (13)
    A key element in trading is zones or levels from which decisions to buy or sell a trading instrument are made. Despite attempts by major players to conceal their presence in the market, they inevitably leave traces. Our task was to learn how to identify these traces and interpret them correctly. Reversal First Impulse levels (RFI)   -  Version MT5                INSTRUCTIONS                 RUS                 ENG                                       R ecommended to use with an indicator   -  
    Scalper Inside PRO
    Alexey Minkov
    4.75 (55)
    An exclusive indicator that utilizes an innovative algorithm to swiftly and accurately determine the market trend. The indicator automatically calculates opening, closing, and profit levels, providing detailed trading statistics. With these features, you can choose the most appropriate trading instrument for the current market conditions. Additionally, you can easily integrate your own arrow indicators into Scalper Inside Pro to quickly evaluate their statistics and profitability. Scalper Inside
    Introducing   Quantum Trend Sniper Indicator , the groundbreaking MQL5 Indicator that's transforming the way you identify and trade trend reversals! Developed by a team of experienced traders with trading experience of over 13 years,   Quantum Trend Sniper Indicator   is designed to propel your trading journey to new heights with its innovative way of identifying trend reversals with extremely high accuracy. ***Buy Quantum Trend Sniper Indicator and you could get Quantum Breakout Indicator fo
    TrendMaestro
    Stefano Frisetti
    5 (2)
    note: this indicator is for METATRADER4, if you want the version for METATRADER5 this is the link: TRENDMAESTRO recognizes a new TREND in the bud, he never makes mistakes. The certainty of identifying a new TREND is priceless. DESCRIPTION TRENDMAESTRO identifies a new TREND in the bud, this indicator examines the volatility, volumes and momentum to identify the moment in which there is an explosion of one or more of these data and therefore the moment in which prices have strong probability of f
    First of all Its worth emphasizing here that this Trading Tool is Non-Repainting Non-Redrawing and Non-Lagging Indicator Which makes it ideal for professional trading . The Smart Price Action Concepts Indicator is a very powerful tool for both new and experienced traders . It packs more than 20 useful indicators into one combining advanced trading ideas like Inner Circle Trader Analysis and Smart Money Concepts Trading Strategies . This indicator focuses on Smart Money Concepts providing in
    Trend Screener
    STE S.S.COMPANY
    4.83 (86)
    Unlock the Power of  Trends trading with Trend Screener Indicator: Your Ultimate Trend Trading Solution powered by fuzzy logic and Multi-currencies System ! Elevate your trend trading with Trend Screener, the revolutionary trend indicator powered by   fuzzy logic.  It is a powerful trend-following indicator that combines over  13 premium tools and features and 3 trading strategies  , making it a versatile choice to   make your Metatrader a Trend Analyzer. LIMITED TIME OFFER : Trend Screener Indi
    FX Power MT4 NG
    Daniel Stein
    5 (8)
    Trading GOLD, and currencies, with the dog walk strategy  - super smart Trading GOLD, and currencies, with the breakout strategy  - super easy Visit our all-new   Stein Investments Welcome Page   to get the latest information, updates and trading strategies. FX Power MT4 NG  is the next generation of our long-time very popular currency strength meter, FX Power.  And what does this next-generation strength meter offer? Everything you have loved about the original FX Power  PLUS GOLD/XAU stre
    Currency Strength Wizard is a very powerful indicator that provides you with all-in-one solution for successful trading. The indicator calculates the power of this or that forex pair using the data of all currencies on multiple time frames. This data is represented in a form of easy to use currency index and currency power lines which you can use to see the power of this or that currency. All you need is attach the indicator to the chart you want to trade and the indicator will show you real str
    Quantum Breakout Indicator PRO
    Bogdan Ion Puscasu
    4.96 (26)
    Introducing   Quantum Breakout PRO , the groundbreaking MQL5 Indicator that's transforming the way you trade Breakout Zones! Developed by a team of experienced traders with trading experience of over 13 years, Quantum Breakout PRO is designed to propel your trading journey to new heights with its innovative and dynamic breakout zone strategy. Quantum Breakout Indicator will give you signal arrows on breakout zones with 5 profit target zones and stop loss suggestion based on the breakout box.
    XQ Indicator MetaTrader 4
    Marzena Maria Szmit
    3 (2)
    Step into the realm of Forex trading with confidence and precision using XQ, a cutting-edge Forex indicator designed to elevate your trading game to unprecedented heights. Whether you're a seasoned trader or just stepping into the world of currency exchange,   XQ Forex Indicator   empowers you with the insights and signals needed to make informed trading decisions. The signal conditions are a combination of three indicators, and XQ Forex Indicator only display  medium and long-term trends . The
    Discover the Secret to Successful Forex Trading with Our Custom MT4 Indicator! Have you ever wondered how to achieve success in the Forex market, consistently earning profits while minimizing risk? Here is the answer you've been searching for! Allow us to introduce our proprietary MT4 indicator that will revolutionize your approach to trading. Unique Versatility Our indicator is specially designed for users who prefer Renko and Rangebar candle formations. We understand that these chart types are
    PRO Renko System
    Oleg Rodin
    5 (24)
    PRO Renko System is a highly accurate trading system specially designed for trading RENKO charts. The ARROWS and Trend Indicators DO NOT REPAINT! The system effectively neutralizes so called market noise giving you access to accurate reversal signals. The indicator is very easy to use and has only one parameter responsible for signal generation. You can easily adapt the tool to any trading instrument of your choice and the size of the renko bar. I am always ready to provide extra support to help
    Advanced Supply Demand
    Bernhard Schweigert
    4.92 (310)
    CURRENTLY 26% OFF !! Best Solution for any Newbie or Expert Trader! This indicator is a unique, high quality and affordable trading tool because we have incorporated a number of proprietary features and a new formula. With this update, you will be able to show double timeframe zones. You will not only be able to show a higher TF but to show both, the chart TF, PLUS the higher TF: SHOWING NESTED ZONES. All Supply Demand traders will love it. :) Important Information Revealed Maximize the potenti
    Scalper Vault
    Oleg Rodin
    5 (27)
    Scalper Vault is a professional scalping system which provides you with everything you need for successful scalping. This indicator is a complete trading system which can be used by forex and binary options traders. The recommended time frame is M5. The system provides you with accurate arrow signals in the direction of the trend. It also provides you with top and bottom signals and Gann market levels. The indicator provides all types of alerts including PUSH notifications. Please contact me aft
    Introducing ON Trade Waves Patterns Harmonic Elliot Wolfe, an advanced indicator designed to detect various market patterns using both manual and automated methods. Here's how it works: Harmonic Patterns: This indicator can identify harmonic patterns that appear on your chart. These patterns are essential for traders practicing harmonic trading theory, as popularized by Scott Carney's book "Harmonic Trading vol 1&2." Whether you draw them manually or rely on automated detection, ON Trade Waves
    Advanced Currency IMPULSE with ALERT
    Bernhard Schweigert
    4.91 (493)
    CURRENTLY 31% OFF !! Best Solution for any Newbie or Expert Trader! This indicator is a unique, high quality and affordable trading tool because we have incorporated a number of proprietary features and a secret formula. With only ONE chart it gives Alerts for all 28 currency pairs. Imagine how your trading will improve because you are able to pinpoint the exact trigger point of a new trend or scalping opportunity! Built on new underlying algorithms it makes it even easier to identify and confir
    First of all Its worth emphasizing here that this Trading System is Non-Repainting, Non-Redrawing and Non-Lagging Indicator, Which makes it ideal for professional trading. The "Smart Support and Resistance Trading System" is an advanced indicator tailored for  new  and  experienced  traders. It empowers traders with precision and confidence in the forex market. This comprehensive system combines 7+ strategies, 10 indicators, and various trading approaches, including day trading strategy, swing
    TrendDecoder Premium
    Christophe, Pa Trouillas
    5 (2)
    Identify ranges  | Get earliest signals of Trends  | Get clear exits before reversal  | Spot the Fibo levels the price will test Non-repainting, non-delayed indicator - ideal for manual and automated trading - for all assets and all time units $69   for launch - then back to >>   $149 After purchase,   please contact me on this channel   for recommended and personalised settings MT5   version:  Click here Get our full method with  BladeSCALPER  and   PowerZONES What is it about? TrendDECOD
    Introducing the Zeus Indicator: Your Ultimate Profit-Breakthrough Trading Tool. This indicator simplifies trading, eliminating the need for in-depth analysis with breakout strategies. It automatically draws zones based on your preset timeframes, suggests Stop Loss (SL), Take Profit (TP), and Trailing Stop levels. The Zeus Indicator will promptly notify you and display signal arrows as the price approaches buy or sell entry points. It also offers recommendations for four different take profi
    AW Trend Predictor
    AW Trading Software Limited
    4.74 (39)
    The combination of trend and breakdown levels in one system. An advanced indicator algorithm filters market noise, determines the trend, entry points, as well as possible exit levels. Indicator signals are recorded in a statistical module, which allows you to select the most suitable tools, showing the effectiveness of the signal history. The indicator calculates Take Profit and Stop Loss marks. Manual and instruction -> Here / MT5 version -> Here How to trade with the indicator:  Trading with T
    TakePropips Donchian Trend Pro
    Eric John Pajarillaga Aldana
    4.82 (17)
    TakePropips Donchian Trend Pro  (MT4) is a powerful and effective tool that automatically detects the direction of the trend using the Donchian Channel and provides you with an entry and exit trading signals! This multi-function indicator includes a trend scanner, trading signals, statistical panel, screener, trading sessions, and alerts history dashboard. It is designed to provide you with trading signals and save you hours analyzing the charts! You can download the user manual and installation
    The ADR Reversal Indicator shows you at a glance where price is currently trading in relation to it's normal average daily range. You will get instant alerts via pop-up, email or push when price exceeds it's average range and levels above it of your choosing so you can jump into pullbacks and reversals quickly. The indicator draws horizontal lines on the chart at the average daily range extremes and also extensions above those levels which have mathematical probabilities attached to them of pric
    Support Resistance screnner
    STE S.S.COMPANY
    4.86 (36)
    Support And Resistance Screener  Breakthrough unique Solution With All Important levels analyzer and Markets Structures Feature Built Inside One Tool! Our indicator has been developed by traders for traders and with one Indicator you will find all Imporant market levels with one click. LIMITED TIME OFFER : Support and Resistance Screener Indicator is available for only 50 $ and lifetime. ( Original price 125$ )  (offer extended) The available tools ( Features ) in our Indicator are :  1. HH-LL
    IX Power MT4
    Daniel Stein
    5 (5)
    IX Power finally brings the unbeatable precision of FX Power to non-Forex symbols. It accurately determines the intensity of short, medium and long-term trends in your favourite indices, stocks, commodities, ETFs, and even cryptocurrencies. You can analyse everything your terminal has to offer. Try it out and experience how your timing improves significantly when trading. Read about our latest strategic development -  Easy scalping with IX Power Visit our all-new   Stein Investments Welcome
    More from author
    Click and Go Trade Manager, the ultimate solution for seamless trading execution. With a simple click on the chart, you can effortlessly define your stop loss, entry price, and target levels. No more hassle of inputting values manually - it's made incredibly intuitive and easy. Embedded risk management is a key feature of our Trade Manager. We understand the importance of protecting your investments, which is why the Click and Go Trade Manager incorporates risk management. When placing orders, y
    Click and Go Trade Manager
    Victor Christiaanse
    5 (11)
    Click and Go Trade Manager, the ultimate solution for seamless trading execution. With a simple click on the chart, you can effortlessly define your stop loss, entry price, and target levels. No more hassle of inputting values manually - it's made incredibly intuitive and easy. Embedded risk management is a key feature of our Trade Manager. We understand the importance of protecting your investments, which is why the Click and Go Trade Manager incorporates risk management. When placing orders,
    Exit Manager
    Victor Christiaanse
    5 (2)
    This Exit Manager  will  manage your orders to ensure you close the orders at the right moment. After you placed an order, the Exit Manager will close the trade based on YOUR conditions. It will also be able to trail your stoploss to reduce risk. The features of this tool enables you to Set & Forget the trade. Place the trade, and the Exit Manager will continuously keep an eye on the trade and close it when the conditions are met. The orders will be monitored and closed based on different condit
    Ichimoku Scanner
    Victor Christiaanse
    5 (1)
    This scanner is monitoring the entire market for Ichimoku trade opportunities for all symbols and for all time frames. You don't have to look to all the charts, for all symbols and for all time frames. This scanner will alert you on your computer, or on your mobile, when a trade opportunity has been found.  You never have to miss a trade opportunity!   This indicator is designed to scan all pairs and symbols, for all selected time frames, to find a Tenkan and Kijun Cross or a breakout of the Ich
    Three Moving Average Scanner
    Victor Christiaanse
    5 (9)
    This scanner is monitoring the entire market for trade opportunities for all symbols and for all time frames. This scanner will alert you on your computer, or on your mobile, when a trade opportunity has been found. Three moving average strategy   The three moving average strategy is a very popular and proven strategy. The slowest moving average is used to determine the direction of the trend. If the price is above the slowest moving average, we are in a Bullish market and if the price is belo
    This scanner is monitoring the entire market for trade opportunities for all symbols and for all   time frames. You don't have to look to all the charts, for all symbols and for all time frames. This scanner will alert you on your computer, or on your mobile, when a trade opportunity has been found.  You never have to miss a trade opportunity!   This indicator is designed to scan all pairs and symbols, for all time frames, to find a cross of the MACD main and signal line.   MACD Definition The
    Keyboard Trading
    Victor Christiaanse
    5 (2)
    Keyboard Trading  Open and Close orders with your keyboard. This tool allows you to open and close orders with your keyboard. As opening and closing orders with your keyboard is faster than with your mouse, this tool is very useful for Scalpers. How does it work? If you press the key "b", it will open a buy order with lot size, SL and TP as specified in the settings. If you press the key "s", it will open a sell order with lot size, SL and TP as specified in the settings. If you press the key "c
    FREE
    Trendline Trading
    Victor Christiaanse
    3 (1)
    If you use Resistance and Support Trendlines in your trading, this tool will be very useful for you!  The Trendline Trading EA is a smart and easy tool to helps you in your trading using trendlines on your chart. Just create a trendline for the Resistance and Support, and the EA will create pending orders when the price touch the trendline. The following orders will be created when the price touch the trendline: Pending order in case the price breaks the trendline Pending order in case the price
    This indicator is designed to scan all pairs and symbols, for all selected time frames, to find a cross of moving averages. The 4 Moving Average Strategy The scanner has 4 moving averages: - 2 moving averages to define the trend - 2 moving averages are used to find the right moment to send an alert If the fast trend MA is above the slow trend MA, than it is considered as a bullish market and it will only provide bullish alerts. If the fast trend MA is lower then the slow trend MA, it is consi
    Filter:
    tsuchla1
    129
    tsuchla1 2022.07.19 21:50 
     

    Tried and doesn't work. Indicator tells me there are engulfing candles when there isn't and doesn't tell me when there are.

    Victor Christiaanse
    6011
    Reply from developer Victor Christiaanse 2022.07.19 21:58
    Please reach out to me on private message with examples. I haven't heard any complain from any customer so far, and I am using it myself without any problems. If it isnt working for you, then there is something not right in your setup. The scanner does work, I don't sell products that don't do at advertised.
    lauro1956
    4240
    lauro1956 2020.04.05 22:22 
     

    Good night.

    First tell him I really like the gauge.

    Reply to review
    Version 1.1 2020.04.15
    New functionality added:
    - Validation for Minimum Body Size for the Engulfing candle
    - Add option to validate that the Body Size of the Engulfing candle is at least twice the size as the previous bar