Mini Charts MT5
- Indicators
- Sergey Efimenko
- Version: 1.4
- Updated: 19 January 2024
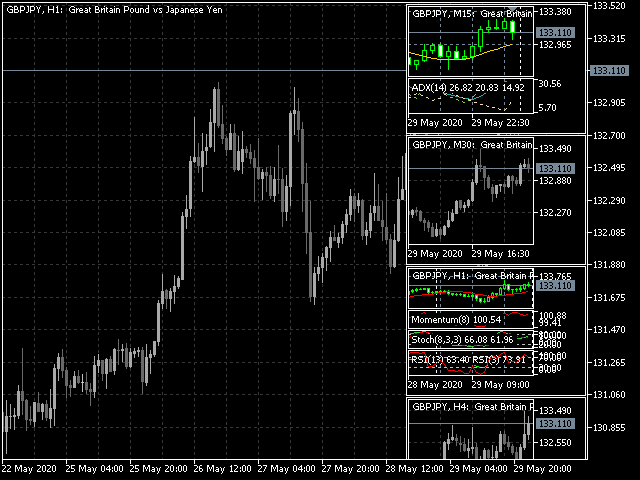
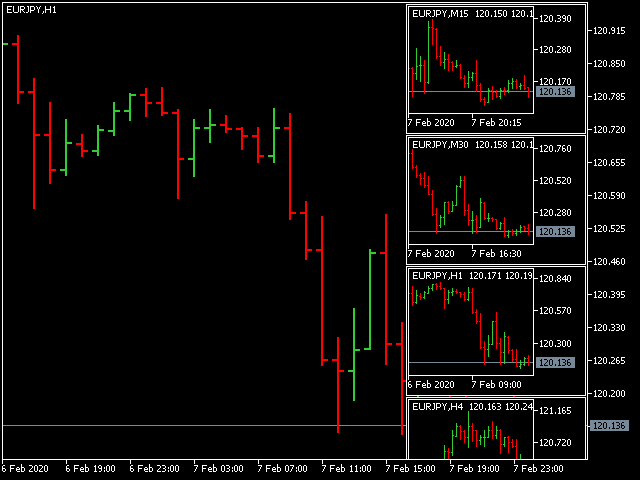
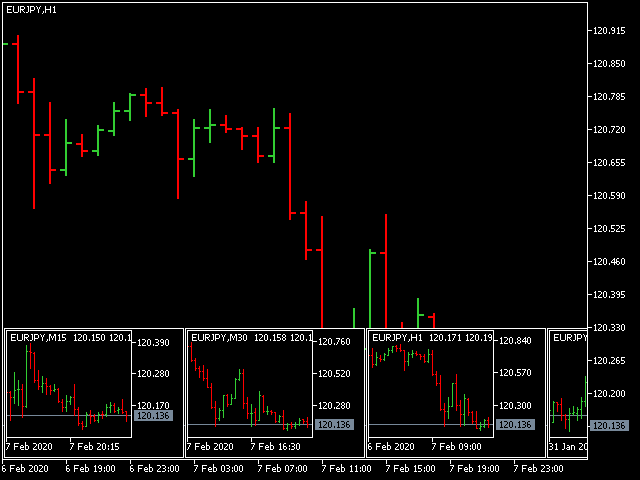
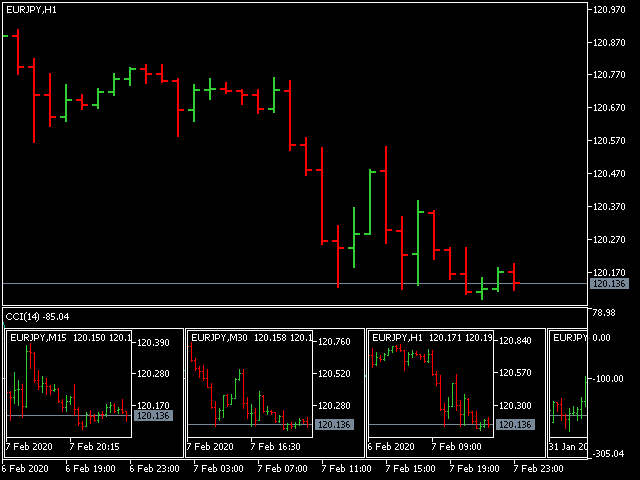
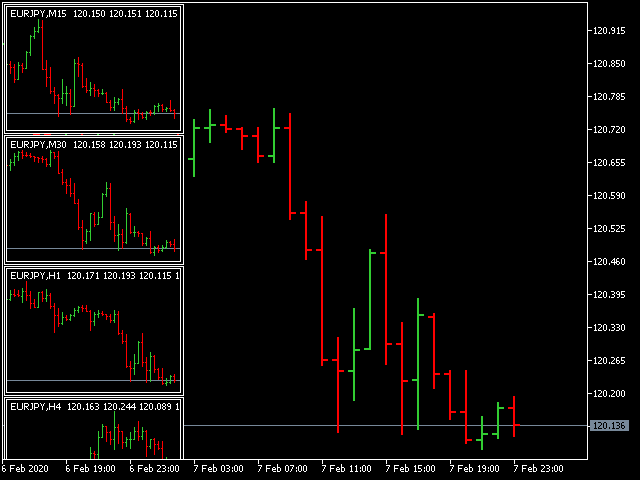
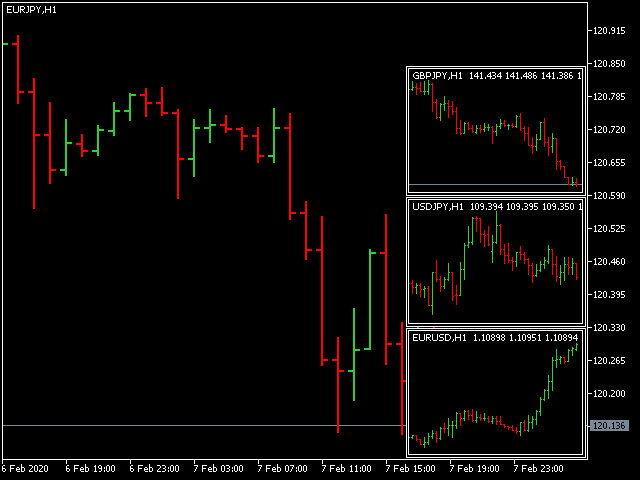
The indicator displays minimized charts of any symbol from any timeframe. The maximum number of displayed charts is 28. The charts can be located both in the main and bottom window. Two display modes: candles and bars. Amount of displayed data (bars and candles) and chart sizes are adjustable.
To work with a mini chat, you must first put the desired indicator(s) on a regular chart, then save it as a template and apply a template for the mini chart via the appropriate parameter, for example, for the first chart, the parameter is called "Template name 1".
- Charts base corner - base corner
- Charts subwindow number - number of the subwindow
- Charts X/Y shift - the starting X/Y offset
- Charts width/height - windows width/height
- Space X/Y between charts - X/Y distance between charts
- Charts scale - scale
- Show date/price scale - show the time/price scale
- Charts in background mode - background mode
- Columns count - the number of columns


Amazing!!!