Thanks
- Overview
- Reviews (2)
- Comments (1)
Heiken Ashi Candles indicator
Forex Indicator: Heiken Ashi Candles for MT4. No Repaint.
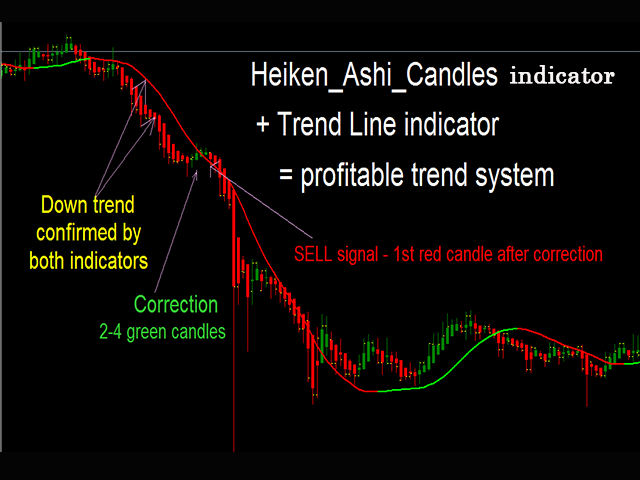
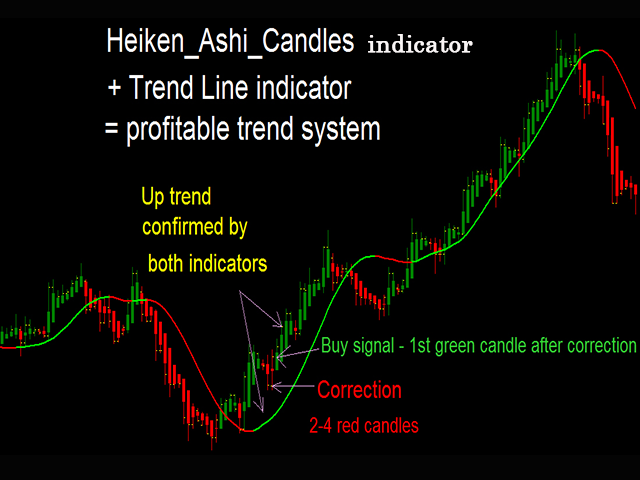
Heiken_Ashi_Candles has great combination with Trend Line indicator - another my product - test it now.
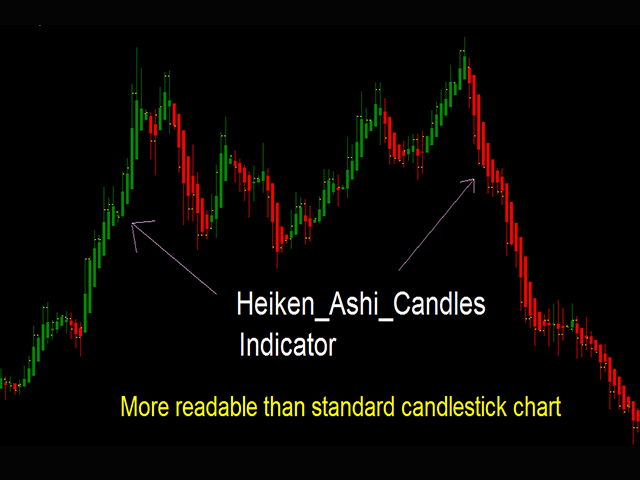
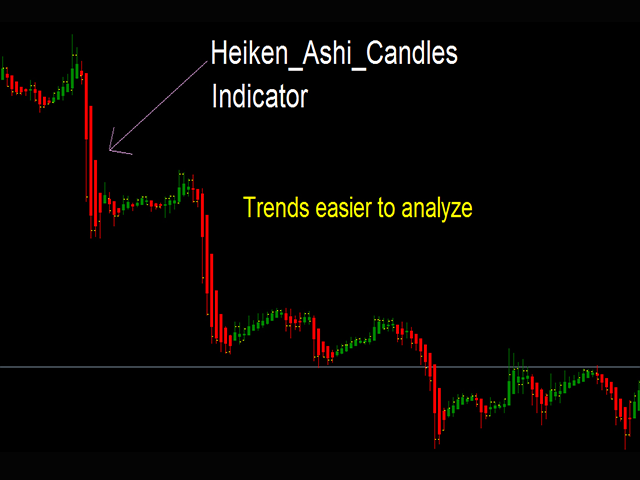
- Indicator Heiken_Ashi_Candles is very useful auxiliary indicator to make trend more visible.
- It's useful for making candlestick charts more readable and trends easier to analyze.
- Most profits are generated when markets are trending, so predicting trends correctly is necessary.
- The Heikin-Ashi chart is constructed like a regular candlestick chart except the formula for calculating each bar is different
- Heikin-Ashi has a smoother look, as it is essentially taking an average of the movement.
- Green candles with no lower "shadows" indicate a strong uptrend.
- Red candles with no higher shadows identify a strong downtrend.
- Candles with a small body surrounded by upper and lower shadows indicate a trend change or correction.
Reviews 2

Recommended products

Universal Heiken Ashi
FREE
Nikolay Churbanov
Universal Heiken Ashi is an indicator that calculates Heiken Ashi candles with different smoothing methods.
Indicator settings Profile - predefined profile: FHA - Fast Heiken Ashi. HA - Standard Heiken Ashi. SHA - Slow Heiken Ashi. Custom - Custom settings. MAType - first smoothing Moving Average type. MAPeriod - period of first Moving Average. UseSecondMovingAverage - using of second Moving Average for smoothing. MAType2 - second Moving Average. MAPeriod2 - period of second Moving Average.

Heiken Ashi Smoothed Alert
FREE
Jan Flodin
This indicator can send alerts when a Heiken Ashi Smoothed color change occurs. Features Can send all types of alerts. Option to delay the alert one bar in order to confirm the color (trend) change. Parameters Wait for candle close: 'true' or 'false'. Setting it to 'true' will delay the alert to the opening of the bar following the bar where the color change occurred. MA method: Default is Smoothed (SMMA). MA period: Default is 4. MA 2 method : Default is Linear Weighted (LWMA). MA 2 period: Def

Heiken Ashi Trade System2
FREE
Chaiya Srisawat
The robot is a simple and flexible trading system. It uses Heiken-Ashi candlesticks as a design basis. The robot consists of two parts: 1) sending orders, 2) exiting orders. The details are as follows. Sending orders: The robot uses Heiken-Ashi candlesticks to enter buy/sell orders. If you specify a fixed stop loss level, each order is sent with a fixed stop loss level. Exiting orders: The robot has three exiting choices as follows: Meet its target: a user sets the target level when marketing pr

Guppy GMMA Cross Arrows Indicator
FREE
Abir Pathak
This indicator is based on Guppy's GMMA Strategy. And shows arrows when GMMA lines cross up or down. To have this indicator and get alerts for Multiple Timeframes and multiple Pairs you can check out the demo of this GMMA Trend Scanner indicator: https://www.mql5.com/en/market/product/38747
About GMMA In Brief:
GMMA attempts to identify trends by combining two groups of moving averages with differing time periods: The long-term EMAs (30, 35, 40, 45, 50, and 60) the behaviors of investors tha

Renko Bars 3in1 DEMO
FREE
Yuriy Shatsckiy
The Renko_Bars_3in1_DEMO is designed for plotting 3 types of Offline Renko charts. Standard Renko Bar (the reversal bar is twice the size of the bar). Renko Range Bar (the size of all bars is the same). Renko Bars with the ability to adjust the size of the reversal bar. Note . Renko_Bars_3in1_DEMO is a demo version of Renko_Bars_3in1 indicator. Works only on Demo accounts. A chart with the M1 period is necessary to build an offline chart. When the indicator is attached to a chart, the offline ch

Trend Magic Indicator free
FREE
Heiko Kendziorra
The Trend Magic Indicator shows the direction of a trend and indicates when it changes. Blue dots in the chart indicate an uptrend, red dots indicate a downtrend. The indicator is the trigger for the Trend Magic Expert .
Input Parameters Counter : number of bars used for calculation PowerSet : shows how near to the bars the trigger dots are placed DotSize : size of the shown dots The colors of the dots can be changed.
Difference from the paid version This is a free version, it works in every

AMD Exclusive Two Separate Window Free
FREE
Szymon Palczynski
With this AMD Exclusive Two Separate Window Free indicator, you will be able to spot, predict, trade and profit from strong trends of markets
This is not a simple indicator, it is a ready to use trade system.
AMD Exclusive Two Separate Window Free works only on USDCAD currency pair. The full version of the product has no limitations.
Full version: https://www.mql5.com/en/market/product/33589
What we have? Automatic optimization Overbalance (manual, semi-automatic and automatic) Fibonacci P

MASi Three Screens
FREE
Aleksey Terentev
MASi Three Screens is based on the trading strategy by Dr. Alexander Elder. This indicator is a collection of algorithms. Algorithms are based on the analysis of charts of several timeframes. You can apply any of the provided algorithms.
List of versions of algorithms:
ThreeScreens v1.0 - A simple implementation, with analysis of the MACD line; ThreeScreens v1.1 - A simple implementation, with analysis of the MACD histogram; ThreeScreens v1.2 - Combines the first two algorithms

Skynet Heiken Ashi
FREE
Roman Yablonskiy
This indicator displays the short-term trend direction and flat areas in the same way as the classic Heiken Ashi indicator, but it is not plotted using candles or a moving average, but rather the Skynet Moving Average indicator.
Advantages no delay, or a slight delay when using the 'smooth' parameter. customizable parameters for any price data and timeframes. visualization of the flat and the short-term trend. unlike the classic Heiken Ashi indicator, the frequency of candles changing from bul

Power Trend Free
FREE
Yurij Kozhevnikov
Power Trend Free - the indicator shows the trend strength in the selected period.
Input Parameters The indicator has three input parameters: Period - a positive number greater than one, it shows the number of candlesticks used for calculations. If you enter one or zero, there will be no error, but the indicator will not be drawn. Applied Price - the standard "Apply to:" set meaning data used for the indicator calculation: Close - Close prices; Open - Open prices; High - High prices; Low - Low

Best Heiken Ashi VQZZ System
FREE
Abir Pathak
All Indicator extras and template: https://abiroid.com/extras/best-heiken-ashi-vqzz-system-extras
The Best Heiken Ashi System is a simple trading system for trading based only two indicators for generate signals: Heiken ashi smoothed and Vqzz indicator multi-timeframe. The system was created for scalping and day trading but can also be configured for higher time frames. As mentioned, the trading system is simple, you get into position when the two indicators agree. Get Scanner dashboard her

MAXIM Range Indicator
FREE
marlon facey
MAXIM Range Indicator by MAXIM Trading Strategies is a custom indicator that forms part of the MAXIM Market Mover indicator. This range indicator is used by MAXIM Market Mover and as such is NOT a stand-alone indicator. This indicator is free of charge and must be saved/downloaded in the Indicators folder of the MT4 terminal for use by MAXIM Market Mover indicator. The indicator, if run on its own, will not display any trading signals even though it is executing an algorithm on behalf of MAXIM M

SWitch Bands Color
FREE
Sergey Vedmanov
The indicator implements an idea whereby effective trading periods are determined using a non-standard approach to the Bollinger Bands indicator. This version only features band colors based on trading zones. There are plans to add signals indicating critical moments that can be most favorable for trading.

SFT Full MACD
FREE
Artem Kuzmin
A classic indicator with advanced features for more accurate display of the market situation. All settings of all moving averages are available, such as the moving average type and the priced used in its calculation. It is also possible to change the appearance of the indicator - line or histogram. Additional parameters provide the ability of fine tuning.
Distinctive features Does not redraw. Additional parameters for fine tuning. Displayed as a line or as a histogram. Works on all timeframes

ZltdMaxATR
FREE
Dmitry Zinoviev
Improved version of the АТР indicator.
Parameters ATRPeriod - АТР period, to be used in the calculation of the АТР maximum MAXPeriod - the number of АТР values used in the calculation of the АТР maximum DrawLine - display as a line, false - display as a histogram. Less susceptible to the current decreases of the volatility, which allows to evaluate the range more correctly during its operation. At the same time, it instantly reacts to the increase of the volatility, which allows to use safe in

MTF Heiken Ashi MA
FREE
Brian Lillard
MTF Heiken Ashi MA is a multiple timeframe Heiken Ashi & Moving Average indicator. Fully customizable for advanced & unique Heiken Ashi & Moving Average calculations.
Key Features This indicator has three historical bar price inputs of Close, High and Low. Multiple timeframe making it a great tool for trend and confirmations. No repaint is possible making it a great tool for scalping strategies. Tails are not shown in this evaluation of the traditional calculation.
Inputs MA Period(# of Peri

Renko One ReversBar Demo
FREE
Yuriy Shatsckiy
The Renko_One_ReversBar_Demo is a Demo version of the Renko_One_ReversBar indicator. The main feature is that only one Reversal Bar is drawn. As in the indicator Renko_Bars_3in1 , you can independently adjust the size of the reversal bar. Works only on Demo accounts. Important. To build an offline chart, you need a chart with a period of M1. When you launch the indicator on the chart, the offline chart opens automatically. When closing the terminal, also close the offline chart, because the nex

Time of Renko Bar
FREE
Jad Eid
This "Time of Renko Bar" indicator can be utilized by traders using Renko bars. The indicator will record the time taken for each box to be formed (in seconds) and display those values in a separate indicator window. Some traders use the time of a Renko bar to assess momentum. This means that if a box is taking more time to form, it could mean that the trend is weakening.

MTF Stochastic and RSI
FREE
Georgiy Gazaryan
A simple but effective helper that will allow you to track both global and local market trends. The indicator combines the work of two oscillators: Stochastic and RSI. Both indicators can be set to any timeframe.
Advantages of Use Multitimeframe - you can adjust both indicators to the desired timeframes. To obtain the entry points, you can use the Elder's triple screen system. Highly customizable - you can configure not only the parameters of the indicators, but also their appearance (color an

SFT Trend Chart
FREE
Artem Kuzmin
Opening positions in the direction of the trend is one of the most common trading tactics.
This indicator determines the direction of the local movement and colors the candles on the chart in the appropriate color.
Allows you to enter the transaction at the very beginning of the movement
Thanks to the flexible settings you can use on any currency pairs, metals and cryptocurrency
Can be used when working with binary options
Distinctive features Does not redraw. Additional parameters for

Stable Trend MA
FREE
Yurij Izyumov
The indicator is based on a single Moving Average of a user-defined period. By analyzing the price movement of the price relative to this MA, and also by tracking all updates of the price Highs and Lows over the same period as the MA period, the indicator draws its own picture of the trend, avoiding the ever-breaking MA lines. Therefore, if the trend goes up, the line will also point upwards and will not change its direction even on small retracements, allowing to capture almost the entire trend

Candlestick Oscillator
FREE
Stephen Reynolds
Candlestick Oscillator is a truly unique Oscillator that uses the concepts of within candlestick trading called the Record Session High. This is a method of analysing candlesticks to gauge when a trend might be wearing out and therefore ready for reversal or pause. We call it a record session high when we get 8 or more previous candles that have higher closes. We call it a record session low when we get 8 or more previous candles that have lower closes.
We don't rely on the typical Oscillatio

SWitch ABF
FREE
Sergey Vedmanov
The indicator saves your time allowing you to apply three indicators to the chart at once. Each indicator has its own settings. Bollinger Bands. Alligator. Fractals.

HMA Trend Professional demo MT4
FREE
Pavel Zamoshnikov
Demo version of the HMA Trend Professional indicator. The main feature of the "HMA Trend Professional" indicator is the ability to predict the trend reversal with high probability. The trend reversal forecast is based on the statistical analysis of history data. The indicator plots statistical diagrams which can be used by traders to see the current phase of the market (impulse or correction, the beginning, middle or end of the movement) and evaluate the probability of a reversal.
See the main

DEMOHistoDiff
FREE
Damian Mateusz Dziadosz
The next indicator is an histogram that compares the difference between highest high of x bars and moving average of same bars compared with the difference between lowest low of same number of bars and moving average also of the same number of bars (that means that if the difference between highest high and moving average is higher than difference between lowest low and moving average the indicator will draw values higher than 0). It has the next inputs: maperiods: Number of bars to calculate th

Hourly Fibo
FREE
Khurram Mustafa
This is a product for Fibonacci fans.
Fibonacci is a tool mostly used to define support/resistance levels and decide on market entries and exits. The responsibility of this indicator is to manage Fibonacci Retracement of the last week. Product is especially developed for H1 and D1 chart. This indicator maintains Fibonacci retracement of last week High to Low where trader will find exact support/resistance levels. In this indicator, some extra levels are added. If you found any discrepancy, ple

Tipu Heikin Ashi Panel
FREE
Kaleem Haider
Tipu Heikin-Ashi Panel is the modified version of the original Heiken Ashi indicator published by MetaQuotes here . A professional version of this indicator is available here .
Features An easy to use Panel that shows the Heiken Ashi trend of selected timeframe. Customizable Buy/Sell alerts, push alerts, email alerts, or visual on-screen alerts. Customizable Panel. The panel can be moved to any place on the chart or minimized to allow more space. Heikin means "the average", and Ashi means "foo

XLines MT4 Free
FREE
Farid Shyhaliev
Free and limited version ( only one alert ) of the popular X-Lines indicator. X-Lines 2.0 Pro I want to present for your attention a new and completely updated and expanded version of X-Lines indicator. Version 2.0 Pro has many new features and can make your analysis more productive.
Please read full instructions here . Purchasing full version here .
1) Multi-timeframe settings and user-friendly control panel. You can dynamically select and save indicator settings not only for each c

HMA Dynamic Color
FREE
Wojciech Kuczer
HMA – Hull Moving Average is an indicator created by Allan Hull . HMA calculates the average price and draws results as a line on a chart. The biggest advantage of HMA is minimal lag comparing to SMA ( Smooth Moving Average ) or WMA ( Weighted Moving Average ) Moving averages are always popular among traders. Investors trust them because they can be very accurate trend indicators.
HMA strategy do’s and don’ts.
HMA used properly can be very helpful as a part of the trading strategy. I’m goi

Fibo Zone Lite
FREE
Evgeny Galikhin
The indicator displays strong support and resistance areas near the levels of certain type calculated using ZigZag vertices with greater amplitude. The strength of levels is defined by the accumulation of Fibo levels calculated using ZigZag vertices with lower amplitude. These areas can be considered as potential reversal zones and used to perform trades and fix profit. Potential reversal zones efficiently sort out the signals received from the oscillators. Also, the functionality for the detect
Buyers of this product also purchase

Entry Points Pro
125 USD Yury Orlov
This is a trend indicator for MT4 providing accurate signals to enter a trade without redrawing or delays.
It can be applied to any financial assets: forex, cryptocurrencies, metals, stocks, indices . The best results are on the timeframe M15+
Our Telegram group | MT5 version of the indicator
IMPORTANT! Contact me after your purchase to get the detailed guide and bonus. Video (6:22) - one signal that made a profit equal to triple the price of the indicator. Video (4:4

Advanced Supply Demand
148 USD Bernhard Schweigert
CURRENTLY 33% OFF !! Best Solution for any Newbie or Expert Trader! This indicator is a unique, high quality and affordable trading tool because we have incorporated a number of proprietary features and a new formula. With this update, you will be able to show double timeframe zones . You will not only be able to show a higher TF but to show both, the chart TF, PLUS the higher TF: SHOWING NESTED ZONES . All Supply Demand traders will love it. :) Important Information Revealed
Maximize th

Advanced Currency Strength28 Indicator
148 USD Bernhard Schweigert
CURRENTLY 26% OFF Best Solution for any Newbie or Expert Trader! This Indicator is a unique, high quality and affordable trading tool because we have incorporated a number of proprietary features and a new formula. With only ONE chart you can read Currency Strength for 28 Forex pairs! Imagine how your trading will improve because you are able to pinpoint the exact trigger point of a new trend or scalping opportunity? User manual: click here That's the first one, the original! Don't buy a worthle

FX Power
75 USD Daniel Stein
️️️️️ You want to become a constantly profitable 5-star forex trader? ️️️️️ 1. Read the basic description of our simple trading system & and it's major strategy update in 2020 2. Send a screenshot of your purchase to get your personal invitation to our exclusive trading chat
FX Power is the first currency strength meter with a complete history across all time frames.
It analyzes the momentum and strength of all major currencies to determine high probability trades. Key Fe

Best Currency Strength Indicator
149 USD Tumelo Rakotsoane
Advanced Currency Strength Indicator
The Advanced Divergence Currency Strength Indicator. Not only it breaks down all 28 forex currency pairs and calculates the strength of individual currencies across all timeframes , but, You'll be analyzing the WHOLE forex market in 1 window (In just 1 minute) . This indicator is very powerful because it reveals the true movements of the market. It is highly recommended to analyze charts knowing the performance of individual currencies or the countries ec

PipFinite Breakout EDGE
98 USD Karlo Wilson Vendiola
The Missing Edge You Need To Catch Breakouts Like A Pro. Follow a step-by-step system that detects the most powerful breakouts!
Discover market patterns that generate massive rewards based on a proven and tested strategy.
Unlock Your Serious Edge
Get it here www.mql5.com/en/blogs/post/723208
Have access to the game changing indicator that will take your trading to the next level!
How To Trade
Execute your trades in 3 Easy Steps!
Step 1: Trade Setup Enter a signal if Success Rate is

PipFinite Trend PRO
98 USD Karlo Wilson Vendiola
Breakthrough Solution For Trend Trading And Filtering With All Important Features Built Inside One Tool! Trend Pro's smart algorithm detects the trend, filters out market noise and gives entry signals with exit levels. The new features with enhanced rules for statistical calculation improved the overall performance of this indicator.
Important Information Revealed Maximize the potential of Trend Pro, please visit www.mql5.com/en/blogs/post/713938 Test the demo version and explore its feature

Bermaui Deviation Percent
50 USD Muhammad Elbermawi
Or ( BD% ) which is a volatility index that measures volatility in percent rather than points. The idea of BD% is to make an index depending on the Classic Standard Deviation (CSD) that moves between 0 and 100 percent.
You can use BD% to compare volatility for the same security in different time periods or different time-frames. In addition, you can use BD% to compare volatility between different securities in different markets in terms of percent rather than points.
The idea behind th

Advanced Currency IMPULSE with ALERT
78 USD Bernhard Schweigert
CURRENTLY 39% OFF !! Best Solution for any Newbie or Expert Trader! This indicator is a unique, high quality and affordable trading tool because we have incorporated a number of proprietary features and a secret formula. With only ONE chart it gives Alerts for all 28 currency pairs . Imagine how your trading will improve because you are able to pinpoint the exact trigger point of a new trend or scalping opportunity! Built on new underlying algorithms it makes it even easier to identify an

FX Volume
75 USD Daniel Stein
You want to become a constantly profitable 5-star forex trader? 1. Read the basic description of our simple trading system & and it's major strategy update in 2020 2. Send a screenshot of your purchase to get your personal invitation to our exclusive trading chat
Following the smart money is finally possible! FX Volume is the FIRST and ONLY volume indicator that provides a REAL insight into the market sentiment from a broker's point of view. It provides awesome insights into how ins

Lighthouse
75 USD Daniel Stein
You want to become a constantly profitable 5-star forex trader? 1. Read the basic description of our simple trading system & and it's major strategy update in 2020 2. Send a screenshot of your purchase to get your personal invitation to our exclusive trading chat
Lighthouse is an amazing precise and reliable support and resistance indicator.
It displays the most important trading levels and draws them according to their relevance.
If a level is clearly broken, it changes its rol

TPOChart2
60 USD Ahmad Yani
Features Supports the creation of Monthly, Weekly, Daily, 4 Hours, 1 Hours and 30 Minutes Market Profile. Daily Profile can have custom start time. Merge and Split of Market Profile Market Profile References Point can be exported to CSV format for any further analysis.
Indicator Parameters Indicator Update Interval - Choose indicator calculation period from 250 milliseconds to 2.5 seconds Indicator Setting ID - An ID for this particular indicator setting. Profile Number - The Number of Market

Netsrac ADR Dashboard
59 USD Carsten Pflug
The intention of the dashboard is to provide a quick overview of the daily, weekly and monthly range of configured assets. In "single asset mode" the dashboard shows you possible reversal points directly in the chart, thus making statistics directly tradable. If a configured threshold is exceeded, the dashboard can send a screen alert, a notification (to the mobile MT4) or an email. There are various ways of using this information. One approach is that an asset that has completed nearly 100% of

True Direction Oscillator
60 USD Muhammad Elbermawi
Or (TDO) which is an index that measures the price rate of change using the principle of " Pure Momentum ".
When a security price advances from 10 to 15 then the price rate of change is 150% but when it declines back from 15 to 10 then price rate of change is 33.3% only. That is why technical analysis indicators like "Price Rate of Change" (ROC) or "Momentum" gives higher readings for ascending price movements than that given to descending ones. TDO fixes this problem to help traders at

PipTick VSA MT4
97 USD Michal Jurnik
PipTick VSA is based on the original Volume Spread Analysis method. It was designed for quick and easy recognition of VSA patterns. Even though this indicator looks very simple, it is the most sophisticated tool that we have ever made. PipTick VSA indicator is a really powerful analytical tool that generates very reliable trading signals. Because it is very user friendly and understandable, it is suitable for every type of trader, regardless of their experience.
What Is VSA? VSA (Volume Spread

Heiken Ashi Scanner
50 USD Philip Pankaj
Heikin-Ashi charts , developed by Munehisa Homma in the 1700s. Munehisa Honma was a rice merchant from Sakata, Japan who traded in the Dojima Rice market in Osaka during the Tokugawa Shogunate. He is considered to be the father of the candlestick chart. Th e man who invented the use of candlestick charts for finding and profiting from chart patterns.He was a billionaire trader on those days if we compared his net-worth with todays dollar . Heikin Ashi Scanner is an Multi-Currency and Multi

Infinity TrendLine PRO
99 USD Evgenii Aksenov
PROMO: Buy indicator today and get Expert Advisor , which trades indicator signals automatically, FOR FREE (including updates in the future)
To get EA as a gift c ontact me after purchased: profitcamp@mail.ru We will send you profitable set files for: Bitcoin, GOLD, EURUSD, GBPUSD for free!!! TrendLine PRO indicator is based on the analysis of the strength of bulls and bears. TrendLine PRO never repaint and does not change the levels!!! It shows the highlighted trend line (blue

Centaurus Trend Engine
50 USD Philip Muga
Centaurus Trend Engine is an indicator that uses custom indicators to give the current momentum moves of the market with a multi-timeframe approach to trading. Features Value Area -It is the (red/green) rectangular box on your chart based on the dynamic structure period set;Green to indicate you focus on LONG moves & Red for SHORT moves Analysis - Displays The Market Analysis Strength - Displays The Market Strength Trend - Displays The Market Trend Entry State - Displays the BEST entry time for

CME CallPut Option Ratio MT4
50 USD Vasiliy Sokolov
Call/Put Ratio is one of the most well-known indicators of the market sentiment. The indicator has been developed by Martin Zweig. It is based on real volumes of the CBOE option market. As we know, a Call option gives its owner the right to buy the underlying asset at a predetermined price. A Put option gives the right to sell it. Thus, increasing volumes for Call options indicate the increasing demand. The growth of Put option volumes shows that supply starts exceeding demand. If we divide the

VR Small Chart
59 USD Vladimir Pastushak
The indicator displays a separate mini chart in a working window similar to МТ5 mini charts. You can expand/collapse the chart, change the chart symbol, period, as well as time and price scales. The app works in the strategy tester and you can switch the period of a mini chart.
Settings Select symbols - All Symbols: all symbols provided by a broker, Only market watch: only the symbols present in the Market Watch Prefix - two letters for distinguishing between a few indicator copies (if more th

Actual Levels
99 USD Ilya Fomin
The indicator shows significant support and resistance levels. When the price approaches these levels, it in some way responds either to the levels themselves, or to the areas that are near these levels. These levels can be viewed as potential reversal zone. Accordingly, the levels can be used for performing trading operations or closing previously opened positions.
For example You can buy if the price rolls back from the support level upwards, or sell if the price rolls back from the resistan

Best And Worst Dashboard
100 USD Chantal Sala
Best and worst Dashboard was born from the idea to have a panel that includes all the symbols in a chart. It is very importance to understand which symbols are both positive and negative. In the past, we realized the single indicator Best and Worst ( https://www.mql5.com/en/market/product/11784 ), now thanks to the upgrading of the Metatrader the dashboard displays all the instruments simultaneously. A great revolution. This Dashboard is able to calculate performance at any time frame and clicki

TIL Timeframe Overlay
97 USD Viktor Macariola
The TIL Timeframe Overlay indicator is the perfect tool for multiple timeframe analysis . It does the simple yet powerful task of overlaying a candlestick chart of a different timeframe over another allowing you to see the BIGGER picture and see the underlying TREND amid the noise and volatile price action. Please see the screenshots below for examples. Features: It works in ALL timeframe. It works in ANY instrument/symbol. Displays ENTIRE candlesticks (body and wick) of other timeframes includi

Blahtech Supply Demand
124 USD Blahtech Limited
Supply Demand uses previous price action to identify potential imbalances between buyers and sellers. The key is to identify the better odds zones, not just the untouched ones. Blahtech Supply Demand indicator delivers functionality previously unavailable on any trading platform. This 4-in-1 indicator not only highlights the higher probability zones using a multi-criteria strength engine, but also combines it with multi-timeframe trend analysis, previously confirmed swings and engulfing detector

FX Trend
75 USD Daniel Stein
️️️️️ You want to become a constantly profitable 5-star forex trader? ️️️️️ 1. Read the basic description of our simple trading system & and it's major strategy update in 2020 2. Send a screenshot of your purchase to get your personal invitation to our exclusive trading chat
FX Trend displays the trend direction, duration, intensity and the resulting trend rating for all time frames in real time.
You'll see at a glance at which direction the trends are running, how long

TPA True Price Action MT4 Indicator
168 USD InvestSoft
TPA True Price Action indicator reveals the true price action of the market makers through 100% non-repainting signals (except early signals mode) strictly at the close of a candle!
TPA shows entries and re-entries, every time the bulls are definitely stronger than the bears and vice versa. Not to confuse with red/green candles. The shift of power gets confirmed at the earliest stage and is ONE exit strategy of several. The first part of the TPA manual "The Basics" is now available (free to g

Bermaui Bands
50 USD Muhammad Elbermawi
Bermaui Bands (BB) is a technical analysis tool that helps filter between ranging and trending price movements. The idea behind this indicator can be explained in the next steps: Calculate Standard Deviation as an oscillator that moves between 0 and 100. I will name it Bermaui Deviation percent (BD %). If "BD %" is near zero then volatility is at its extreme. In addition, if "BD %" is near 100 then volatility is very low. High volatility means a great probability for a trending market, whi

FXtraderariel Indicator
100 USD Ariel Capja
This is the FXTraderariel-Indicator . It scans the market for opportunities and creates a buy or sell signal. Depending on the settings and trading style, it can be used for scalping or long-term trading . The indicator can be used on every time frame , but we advise to use it on H1, H4 and D1 . Especially if you are a novice trader. Pro Traders can also you use it for scalping in smaller timeframes (M1, M5 and M15). This indicator is not a complete trading system. It doesn't give you exit point

TickUnit Scalper Currency Strength28 PRO
148 USD Bernhard Schweigert
CURRENTLY 26% OFF !! This indicator is a super combination of both our main indicators ( Advanced Currency Strength 28 and Advanced Currency IMPULSE with ALERT ). It shows Currency Strength values for TICK-UNITS and alert signals for 28 Forex pairs. 11 different Tick-Units can be used. Those are 1, 2, 3, 4, 5, 6, 10, 12, 15, 20, and 30 Seconds. The Tick-Unit bar in the sub-window will be shown and shifted to the left when there is at least 1 tick within the second’s timer. With only ONE

Bermaui Pin Bars
50 USD Muhammad Elbermawi
Bermaui Pin Bars
Or (BPB) is an indicator that find Pin Bars price action pattern on the chart. Pin Bars is a shortcut for "Pinocchio Bars" which is a classic bar pattern alternative to Japanese candlesticks with tall upper or lower shadows and very small bodies like Hammer, Inverted-Hammer, Hanging Man, Shooting Star, Dragon Fly Doji or Grave Stone Doji. Bermaui Pin Bars indicator find this pattern depending on a formula that can be explained in the next steps:
At first BPB calculate the
More from author

Algo Scalping EA
119.98 USD DMITRII GRIDASOV
Algo Scalping EA - is an advanced fully automated scalping reversal trading system. Trading pairs : - AUDCAD, EURAUD, EURCAD, EURCHF, EURGBP, EURUSD, GBPAUD, GBPCAD, GBPCHF, GBPUSD, USDCAD, USDCHF If you install EA on different pairs (mentioned above) change magic number in settings because it should be unique on each pair It is based on statistical advantage of price action patterns. System is NOT using any dangerous methods like grids or martingale. Each order has own SL for account prot

Spread Display Indicator
FREE
DMITRII GRIDASOV
Forex Indicator Spread Display for MT4 , Trading Support . Spread Display indicator shows current spread of forex pair where it is attached. It is possible to locate Spread display value in any corner of the chart: 0 - for top-left corner, 1 - top-right, 2 - bottom-left, 3 - bottom-right It is possible to set up color and font size as well. Platform : Metatrader4
Timeframe : Any
Markets : Forex

Bollinger Bands WIDTH
30 USD DMITRII GRIDASOV
Forex Indicator Bollinger Bands WIDTH for MT4, No Repaint. BB Width indicator is applicable for using together with standard Bollinger Bands indicator. This software is must have for every Bollinger Bands indicator fan, because their combination is very efficient to trade Breakouts BB Width indicator shows the distance between Bollinger Bands.
HOW TO USE BB WIDTH (See the example on the picture): 1) Find the lowest value of BB Width of the last 6 months and add 25% to this value to get LEV

Moving Average SPEED
30 USD DMITRII GRIDASOV
Forex Indicator MA Speed for MT4, No Repaint. MA SPEED - is trend indicator. I offer you to upgrade your trading methods with new indicator for MT4: MA SPEED (MA - moving average). The calculation of this indicator is based on equations from physics. It will show you the speed of moving average line. There are plenty of opportunities to upgrade even standard strategies with MA SPEED. It is possible to use for SMA, EMA and LWMA. Indicator set up is very easy. MA SPEED indicator shows how fast M

Moving Average Acceleration
30 USD DMITRII GRIDASOV
Forex Indicator MA Acceleration for MT4, No Repaint. MA Acceleration - is scalping indicator, designed as auxiliary indicator for MA SPEED (this is my another product) I offer you to upgrade your trading methods with new indicator for MT4: MA Acceleration (MA - moving average). The calculation of this indicator is based on equations from physics. It will show you the acceleration of moving average line. There are plenty of opportunities to upgrade even standard strategies with MA Acceleration.

CCI Histogram System
30 USD DMITRII GRIDASOV
Forex Indicator CCI Histogram for MT4 , No Repaint CCI Histogram is based on standard CCI indicator with some modifications. CCI Histogram can be in 2 colors: red for bearish trend and blue for bullish one. 7 consecutive histogram columns of the same color means beginning of new trend CCI Histogram indicator designed with the main purpose - to minimize losses and maximize profit. It has just 1 parameter -period, responsible for indicator sensitivity. Period = 45 is the most optimal for H1 timef

Range Pts Day Week Month
30 USD DMITRII GRIDASOV
Forex Indicator 'RANGE Pts Day Week Month' for MT4 Indicator "Range pts Day Week Month" is very useful auxiliary indicator It shows you daily, weekly and monthly most probable levels, which can be reached by price. Daily range is useful for intraday traders Weekly & Monthly ranges are for Swing and Long term traders Indicator "Range pts Day Week Month" is excellent to plan your Take Profit targets or arrange Stop Losses. Platform : Metatrader4
Timeframe : Any
Markets

OSB Oscillator
30 USD DMITRII GRIDASOV
Forex Indicator Over_Sold Over_Bought Oscillator for MT4 , No Repaint for MetaTrader 4 platform . OSB Oscillator - is advanced custom indicator, efficient Price Action auxiliary tool! I offer you to upgrade your trading methods with this great indicator for MT4: OSB Oscillator.
Advanced new calculation method is used. New generation of Oscillators - see pictures to check how to use it. OSB Oscillator is auxiliary tool to find exact entry points for Price Action, Divergence and Oversold/OverB

Trend Line Indicator
30 USD DMITRII GRIDASOV
Forex Indicator TREND LINE MOVING AVERAGE for MT4, No Repaint, for MetaTrader 4 platform. Trend Line MA - is the next generation of Moving Averages! I offer you to upgrade your trading methods with this new indicator for MT4: Trend Line MA. (MA - moving average).
Advanced new calculation method is used. Indicator shows trends without delays. There are plenty of opportunities to upgrade even standard strategies with this indicator. It is much faster and clear than standard SMA, EMA and LWMA

HTF Moving Average
30 USD DMITRII GRIDASOV
Forex Indicator HTF MOVING AVERAGE for MT4 , No Repaint, for MetaTrader 4 platform. Upgrade your trading methods with the professional HTF MA Indicator for MT4. HTF means - H igher Time Frame This indicator is excellent for Trend Traders with Price Action entries. HTF MA Indicator allows you to attach Moving Average from Higher time frame to your current chart. Indicator shows the trend from higher time frame --> this is always profitable method. HTF MA Indicator gives opportunity to get

Day Open Level indicator
30 USD DMITRII GRIDASOV
Forex Indicator DAY OPEN LEVEL for MT4, MetaTrader 4 Platform Indicator "Day Open Level" is very useful auxiliary indicator OPEN day level is so important because very often price returns to that area during the day. Indicator shows you daily open line for each day It is useful for intraday traders to set up targets or use as support/resistance area. Day Open Level indicator can be used for Reversal intraday trading

Pivot Levels DWM
30 USD DMITRII GRIDASOV
Forex Indicator PIVOT LEVELS Day Week Month for MT4 , MetaTrader 4 Platform Indicator " Pivot Levels D_W_M " is very powerful auxiliary indicator for Price Action trading This particular indicator is using Fibonacci numbers in calculation. Pivot Levels are calculated as an average of significant prices from the performance of a market in the prior trading period Pivot Levels itself represent a levels of highest resistance or support, depending on the overall market condition Indicator " Pivot L

Pivot Point SR
30 USD DMITRII GRIDASOV
Forex Indicator PIVOT POINT Support / Resistance for MT4 , MetaTrader 4 Platform Indicator " Pivot Point SR " is very powerful auxiliary indicator for Price Action trading Pivot Levels are calculated as an average of significant prices from the performance of a market in the prior trading period Pivot Levels itself represent a levels of highest resistance or support, depending on the overall market condition Indicator " Pivot Point SR" shows you the most probable reversal levels, which can be

Breakout Channel indicator
30 USD DMITRII GRIDASOV
Forex Indicator BREAKOUT CHANNEL for MT4, No Repaint Trading System Upgrade your trading methods with the BREAKOUT CHANNEL Indicator for MT4. This indicator is complete profitable trading system based on High/Low breakouts!!! It has just 1 parameter - HYSTORY_DEPTH, it reflects the number of candles which are taken into consideration by indicator Parameter HYSTORY_DEPTH recommended values: timeframe D1 - 20 (one month), H4 - 30 (one week), H1 - 24 (one day) BREAKOUT CHANNEL consist of 3 line

Scalping Sniper
30 USD DMITRII GRIDASOV
Forex Indicator SCALPING SNIPER for MT4 , No Repaint Trading System Scalping Sniper - is advanced system (indicator) showing accurate price momentum! Upgrade your trading methods with the professional Scalping Sniper Indicator for MT4. This system provide very accurate but rare sniping signals, with win rate up to 90% System suppose to use many pairs to search for signals to compensate low number of signals per one pair. Scalping Sniper consist of: Top & Bottom Volatility lines (Blue colo

UA Oscillator
30 USD DMITRII GRIDASOV
ULTRA ACCURATE Oscillator UA Oscillator - is an advanced custom indicator with around 80% accuracy when it is used in combination with trend indicator such as EMA for example. Advanced new calculation method is used. New generation of Oscillators - see pictures to check examples of how to use it in combination with EMA10. Oversold values: below 0.03 Overbought values: over 0.97 There are plenty of opportunities to upgrade even standard strategies with this indicator. UA Oscillator is much fas

Stochastic Flat Detector
30 USD DMITRII GRIDASOV
STOCHASTIC FLAT Detector - is efficient auxiliary tool in trading! I offer you to upgrade your trading methods with this great indicator for MT4: STOCHASTIC FLAT Detector .
Indicator shows price Flat areas on the chart STOCHASTIC FLAT Detector - see pictures to check how to use it. Indicator can be used for Price Action entries confirmation, Divergence or OverSold/OverBought signals You can use it for trend following systems to detect flat and avoid trading there. You can use it
Filter:
easy identify trend change .