Unfortunately, "MultiCharts MT4 Demo" is unavailable
You can check out other products of Ruslan Khasanov:

MultiCharts is a multi-currency indicator for visual analysis of several trading symbols.
in a separate window plots the selected symbols; shows the levels of any established orders; shows profit/loss, number and type of open positions; builds technical indicators Moving Average, SDL, Trend filter and Heiken Ashi charts; shows the spread, OHLC-prices of the current bar; shows the relative price change for the current day*;
* - for periods before Daily and Daily inclusive, the price change is c

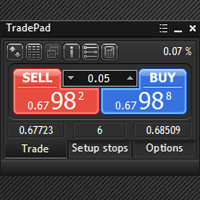
The simple solution for quickly trading operations and controlling positions on multiple trading symbols. The panel interface is simple and intuitive. For comfortable work, the trader is offered a set of tools: the hotkey manager to help you manage all trade operations and chart timeframes; a tool for marking trading levels when placing pending or market orders to assess risks and potential profits when setting Stop Loss/Take Profit levels; built-in MultiCharts indicator for monitoring multiple

This is a multi-currency monitoring panel that shows charts of selected symbols in a separate window. It allows traders to visually analyze price movements on various symbols and periods, as well as quickly switch between them. A demo version is available on the TradePad product description page: https://www.mql5.com/en/blogs/post/751207 Included in another utility for fast trading - TradePad Parameters Indicator UID - unique ID. Each launched copy should have its own ID; to open a chart in t

Quick Info - information utility for collecting and providing a trader with various useful information needed in trading on financial markets every day. All the necessary information is collected and grouped in a separate window. On the first tab, you will find trade statistics for the selected time period. To collect trade statistics, you just need to select a time period from the list or specify the start and end dates of the period for which you want to show trade statistics. You can also v

Indicator for graphical analysis. Marks the main Japanese candlestick patterns on the chart. At the moment, the following set of patterns is available to the trader: - Bearish/Bullish Abandoned Baby; - Bearish Advance Block; - Bearish Deliberation; - Bearish/Bullish Belt Hold; - Bearish/Bullish Engulfing; - Bearish Shooting Star; - Bearish Evening Star; - Bearish Evening Doji Star; - Bearish/Bullish Doji Star; - Bearish/Bullish Tri-Star; - Bearish Hanging Man; - Bearish/Bullish Ha