• Overview
  • Reviews
  • Comments (2)
  • What's new

New Age Indicator

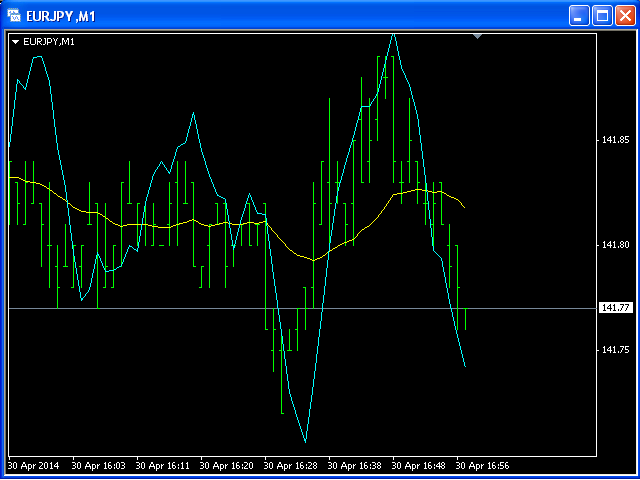
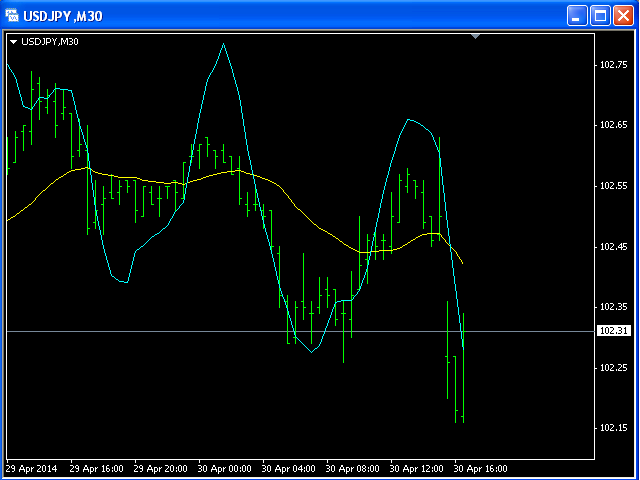
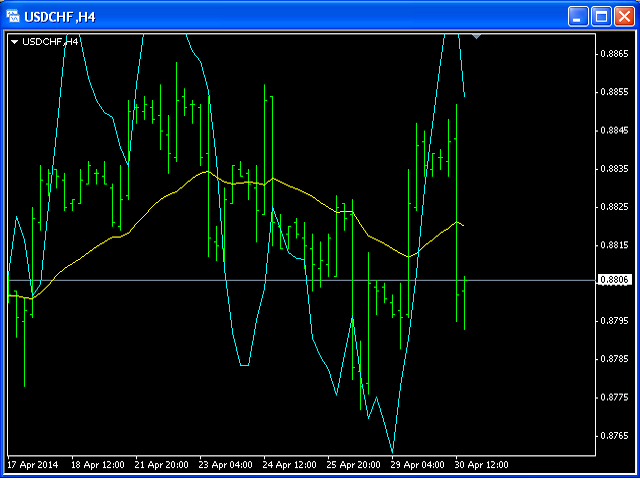
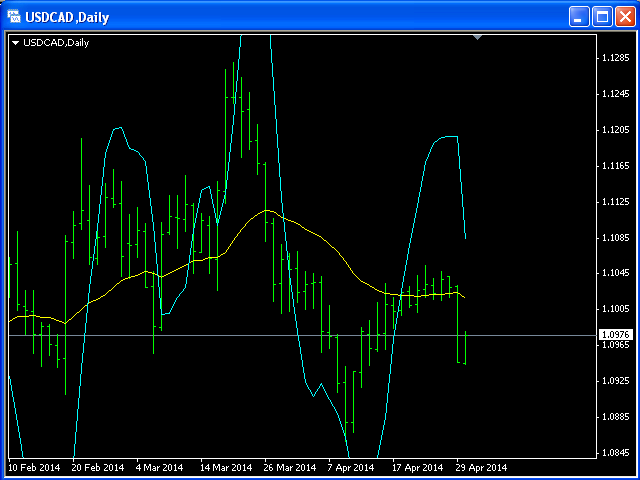
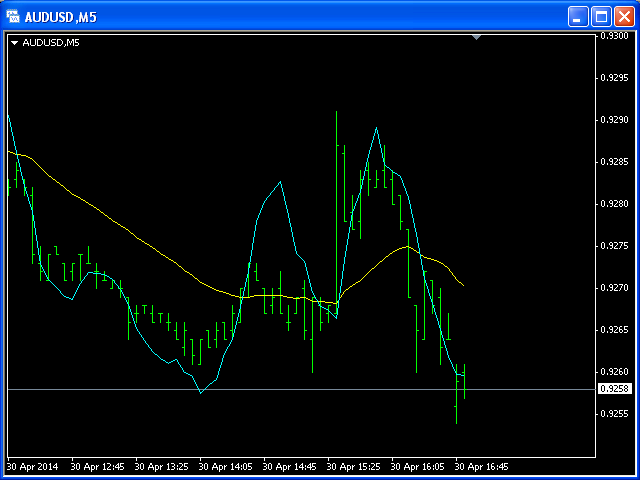
Self Explanatory Indicator: buy when the Aqua line crossing the Yellow line upward and Sell when the Aqua line crossing the Yellow line downwards. 

Input parameters:

  • Period1 = 13.
  • Method1 = 2. MODE_SMA=0, MODE_EMA=1, MODE_SMMA=2, MODE_LWMA=3.
  • Period2 = 5.
  • Method2 = 0. MODE_SMA=0, MODE_EMA=1, MODE_SMMA=2, MODE_LWMA=3.
Recommended products
System Control
Vitalii Zakharuk
The indicator works on the principle of drawing buy and sell arrows, based on the signals of the built-in algorithm. The indicator definitely needs a flat filter. This indicator will take trading to a new level. Works on all timeframes and currency pairs. It is advisable to use the indicator in conjunction with other tools for more reliable signals and making a more balanced decision.
SFO Trend Racer
Tevin Marshall
5 (1)
SFO Trend Racer system is a trend indicator created by the CEO and Founder of " Simple Forex Options ", Tevin Marshall . It serves 6 different functions all in one. It shows the trader the entry signals as well as exit signals, whether it is a take profit or a stop loss. It also uses trend filters and signal confirmations so that the trader is able to make the most logically fit decision. Trend Racer uses various filters and specific settings from a plethora of indicators. The beauty in this ind
This indicator Matrix X indicator.Indicator displays Stochastic oscillator,Williams Percent Range,DeMarker,Relative Strength Index,Matrix trend movement. Indicator helps to buy and sell.Matrix trend = (Stochastic+WPR+DeMarker+RSI)/4. Features KPeriod - displays Stochastic K period. DPeriod - displays Stochastic D period. Slowing- displays Stochastic Slowing. Stochastic_Method - displays Stochastic Method. Stochastic_price - displays Stochastic Price. WPR_per - displays WPR period. Dem_per - dis
Owl smart levels
Sergey Ermolov
4.63 (54)
MT5 version  |  FAQ The Owl Smart Levels Indicator  is a complete trading system within the one indicator that includes such popular market analysis tools as  Bill Williams' advanced fractals , Valable ZigZag which builds  the correct wave structure  of the market, and  Fibonacci levels  which mark the exact levels of entry into the market and places to take profits. Detailed description of the strategy Instructions for working with the indicator Advisor-assistant in trading Owl Helper Private
ABC Trend Levels
Oleksandr Novosiadlyi
Description ABC Trend Levels is an indicator that identifies market trends and important trend support and resistance levels. Recommendations You can use this indicator to determine the trend and, accordingly, to determine the direction of opening a position or closing an opposite position. Parameters ===== _INDICATOR_SETTINGS_ ===== - indicator settings Maximum History Bars - maximum number of history bars for calculating the indicator. Average True Range Period - ATR indicator perio
Binary Options Assistant (BOA) COLD Signals Indicator provides signals based on Amalia Trader Binary Options Strategy. Indicators: Keltner & Stochastic Stop missing trades, stop jumping from chart to chart looking for trade set-ups and get all the signals on 1 chart! U se any of the BOA Signals Indicator with the  Binary Options Assistant (BOA) Multi Currency Dashboard .  All BOA Signal Indicator settings are adjustable to give you more strategy combinations. The signals can be seen visually
The Intraday Taker Main indicator displays specific points of potential market entries on the chart. It is based on the hypothesis of the non-linearity of price movements, according to which the price moves in waves. The indicator displays the specified points based on certain models of the price movement and technical data. It has three types of signals. Only arrows are considered trade signals, others are indicative signals. The indicator does not redraw. Indicator Parameters Taker – paramet
Infinity Trend Pro
Yaroslav Varankin
1 (1)
This is a trend indicator without redrawing Developed instead of the binary options strategy (by the color of the Martingale candlestick) Also works well in forex trading When to open trades (binary options) A signal will appear in the place with a candle signaling the current candle It is recommended to open a deal for one candle of the current timeframe M1 and M5 When a blue dot appears, open a deal up When a red dot appears, open a trade down. How to open trades on Forex. When a signal is rec
A top-quality from the famous XSuper Trend indicator. It is completely loyal to the original algorithm, and implements many useful features Which includes Trend Indicators as Filters like MACD,CCI and Alligator. The Chefs Super Trend Plus Indicator is a great way to identify the current market trend. The indicator shows a clear distinction between uptrends and downtrends. The indicators has optional filters for sound signal. Suitable for the following trending pairs: EUR/USD, GBP/USD, USD/JPY,
HMA Trend Professional MT4
Pavel Zamoshnikov
4.63 (8)
Improved version of the free HMA Trend indicator (for MetaTrader 4) with statistical analysis. HMA Trend is a trend indicator based on the Hull Moving Average (HMA) with two periods. HMA with a slow period identifies the trend, while HMA with a fast period determines the short-term movements and signals in the trend direction. The main differences from the free version: Ability to predict the probability of a trend reversal using analysis of history data. Plotting statistical charts for analyz
Master Scalping M1 is an innovative indicator that uses an algorithm to quickly and accurately determine the trend.The indicator calculates the time of opening and closing positions, the indicator's algorithms allow you to find the ideal moments to enter a deal (buy or sell an asset), which increase the success of transactions for most traders. Benefits of the indicator: Easy to assemble, does not overload the chart with unnecessary information. Can be used as a filter for any strategy. Works on
Trend Transition is a hybrid indicator, as it is based on signals from several well-known products: RSI and MA. MA is a trend indicator of the average true range, which determines the range of minimum and maximum price fluctuations, as well as closing prices. RSI is an indicator of the family of oscillators. The indicator helps to calculate the oversold and overbought levels of a trading instrument. When a trend changes, the Trend Transition indicator uses a color alarm: blue - when changing
The zero line is characterized the Flat trend. V-shaped impulse indicates the entrance to the opposite direction. U-shaped impulse = entry orders in the same direction. If AlertsEnabled = true, the indicator will show the Alert (message window) with a text like this: "Price going Down on ", Symbol(), " - ", Period(), " min", " price = ", Bid; If eMailEnabled = true the indicator will send you an eMail with the same text an Alert message with subject: "Trinity-Impolse" (of course you have to
Uniq Trend
Vitalii Zakharuk
Trading with the Uniq Trend indicator is as simple as possible, if a blue arrow pointing up appears on the chart, a buy trade is opened. In the same case, if you see a red arrow pointing in the downward direction, open a sell order. That is, everything is as simple as possible, positions are closed in the opposite way, that is, as soon as a signal is received to open an order in the direction opposite to your position. For example, you opened a long position (for sale), close it when a red ar
Thư viện này bao gồm: * Mã nguồn struct của 5 cấu trúc cơ bản của MQL4: + SYMBOL INFO + TICK INFO + ACCOUNT INFO * Các hàm cơ bản của một robot + OrderSend + OrderModify + OrderClose * String Error Runtime Return * Hàm kiểm tra bản quyền của robot, indicator, script * Hàm init dùng để khởi động một robot chuẩn * Hàm định dạng chart để không bị các lỗi nghẽn bộ nhớ của chart khi chạy trên VPS * Hàm ghi dữ liệu ra file CSV, TXT * Hỗ trợ (mã nguồn, *.mqh): dat.ngtat@gmail.com
ASC Signal AM
Andriy Matviyevs'kyy
A popular signal indicator marking buy/sell points. In this version, it is supplemented with optimal SL points. Recommended for use in conjunction with a trend indicator to filter signals. The indicator has only one adjustable parameter that determines its sensitivity, which greatly simplifies setting the indicator to the current market and the user's trading style. Indicator signals are given only after the full formation of the bar. The indicator can be used to trade any market. Its basic para
Description Trend Influencer is an indicator that determines the potential dynamics of the influence of trend wave movements on the market. The indicator is based on the value of moving averages corrected by the standard deviation. The indicator is displayed as a main dash-dotted moving average and a signal solid moving average. The signal moving average is colored blue or red depending on what type of trend is currently observed in the market. The indicator also draws inhibition levels - blue
The indicator displays the usual Moving Average with input parameters: maPeriod_1; maMethod_1; maAppPrice_1. Then it calculates and displays MA on MA1 with input parameters: maPeriod_2; maMethod_2. Then it calculates and displays MA on MA2 with input parameters: maPeriod_3; maMethod_3. If AlertsEnabled = true the Indicator will show the Alert (message window) with a text like this: "Price going Down on ", Symbol(), " - ", Period(), " min", " price = ", Bid; If eMailEnabled = true the Indicator w
Three Crossing
Sirinya Pakkaman
Three Crossing Robot trading with 2 indicators Description Open Order Buy order condition 1)     Two lines of the EMA cross for TimeFrame12   2)     For EMA control order is EMA1 must be on the EMA line   3)     RSI_Buy > according to the specified value Sell order condition 1)     Two lines of the EMA cross for TimeFrame12   2)     For EMA control order is EMA1 must be under the EMA line   3)     RSI_Sell < according to the specified value For the operation of t
this code originally published on other platform by LuxAlgo from other programming language.  It has acceptable Trend Prediction abilities which can be used for many trading purposes. here is some description from code generator: This indicator builds upon the previously posted Nadaraya-Watson smoothers. Here we have created an envelope indicator based on Kernel Smoothing with integrated alerts from crosses between the price and envelope extremities. Unlike the Nadaraya-Watson estimator, this in
True SnD
Indra Lukmana
5 (1)
This Supply & Demand indicator uses a unique price action detection to calculate and measures the supply & demand area. The indicator will ensure the area are fresh and have a significant low risk zone. Our Supply Demand indicator delivers functionality previously unavailable on any trading platform. Trading idea You may set pending orders along the supply & demand area. You may enter a trade directly upon price hit the specific area (after a rejection confirmed). Input parameters Signal - S
DPPD (Dynamic Price Percent Deviation) is a simple yet effective indicator following the rule "buy low, sell high". Indicator can send e mail, alert, and MQL ID push notifications. There is also a possibility to set an individual personal notification at any deviation level. Individual notification can have an added individual comment. Why is DPPD dynamic? Because deviation is not measured from a static point. Deviation is measured as a price deviation from a given average in percent. Reccommend
EasyTrend AM
Andriy Matviyevs'kyy
EasyTrend AM is an indicator that allows you to open a position at the very beginning of a significant price movement. The second most important quality of the indicator is the ability to follow the trend as long as possible in order to obtain all potential profits while minimizing potential losses. This indicator does not repaint or not recalculate. A version of this indicator with advanced settings and signal notifications is EasyTrend 3 AM . Signal of the indicator: red arrow appearing abov
Noize Absorption Index MT4
Ekaterina Saltykova
5 (1)
Noize Absorption Index - is the manual trading system that measures the difference of pressure between bears forces and bulls forces. Green line - is a noize free index that showing curent situation. Zero value of index shows totally choppy/flat market.Values above zero level shows how powerfull bullish wave is and values below zero measures bearish forces.Up arrow appears on bearish market when it's ready to reverse, dn arrow appears on weak bullish market, as a result of reverse expectation. S
Wave Wolf MT4
Andrei Salanevich
The Wave Wold MT4 Forex indicator is designed to search for Wolf waves and display them in the current window of the trading terminal. An excellent indicator for traders who use Wolf waves in trading. Its application in trading strategies will significantly increase their efficiency and profitability. INFORMATION ABOUT THE INDICATOR Unlike other Wolf wave indicators, the Wave Wold MT4 forex indicator has a number of features that significantly increase its effectiveness: The first is the
IX Power MT4
Daniel Stein
5 (5)
IX Power finally brings the unbeatable precision of FX Power to non-Forex symbols. It accurately determines the intensity of short, medium and long-term trends in your favourite indices, stocks, commodities, ETFs, and even cryptocurrencies. You can analyse everything your terminal has to offer. Try it out and experience how your timing improves significantly when trading. Read about our latest strategic development -  Easy scalping with IX Power Visit our all-new   Stein Investments Welcome
Fib Zone
Ezinne Judith Orji
A Chart Analytics Program and helps in asset analysis using the Fibonacci Complex.  The primary Fibonacci numbers used in trading are 61.8% and 38.2%. 8% is derived from dividing any number in the Fibonacci sequence by its previous one. F n / F n-1 2% is derived by squaring 61.8 and alternatively by dividing any number in the sequence by the number two places to its right. F n  /F n+2 The second tier of Fibonacci numbers used in trading is 23.6%, 76.4%, and 78.6%. 6% is derived from dividing a
AT LAST! A stochastic indicator for MT4 that shows multiple time frames on one chart ! See the actual position of the main and signal lines in 4 separate time frames instantly to help you make educated trading decisions.A true MTF stochastic indicator for traders that need to see visually what the indicator is telling them on multiple time frames, no arrows that just point up or down or numbers displayed. No more flicking between time frames to see where other stochastics are positioned! Stay on
Super Gator
Agustinus Biotamalo Lumbantoruan
This indi shows the following 1. Supertrend 2. Alligator (Not a regular alligator) 3. ZigZag 4. Moving Average 5. Trend Continuation/Mini correction Signal (plotted in X) (See screenshots in green background color 6. Early Signal Detection (See screenshots in green background color) You may treat Alligator as the lagging indicator The leading indicator is the supertrend. The zig zag is based on the leading indicator where it gets plotted when the leading indicator got broken to the opposite.
Part of ATR
Staffan Ofwerman
This indicator is just a simple ATR indicator. It calculates the Average True Range and let you tell it to show the percentage of the ATR. You will then see the % of the ATR on the screen. I like to use it to calculate different things for my trading. If I use the really great AW Recovery System ( https://www.mql5.com/en/market/product/28868 ) there is a great strategy made by the developer, where you watch the daily ATR and set the steps calculated on part of the ATR. So if you put the Part of
Buyers of this product also purchase
Gann Made Easy
Oleg Rodin
4.95 (44)
Gann Made Easy is a professional and easy to use Forex trading system which is based on the best principles of trading using the theory of mr. W.D. Gann. The indicator provides accurate BUY and SELL signals including Stop Loss and Take Profit Levels. You can trade even on the go using PUSH notifications. PLEASE CONTACT ME AFTER PURCHASE TO GET MY TRADING TIPS PLUS A GREAT BONUS! Probably you heard already many times about Gann trading methods. Usually Gann's theory is very complex thing not only
Introducing the Miraculous Forex Indicator: Unleash the Power of Precision Trading Are you tired of searching for the perfect forex indicator that truly delivers exceptional results across all time frames? Look no further! The Miraculous Forex Indicator has arrived to revolutionize your trading experience and propel your profits to new heights. Built upon a foundation of cutting-edge technology and years of meticulous development, the Miraculous Forex Indicator stands as the pinnacle of str
Currently 20% OFF ! Best Solution for any Newbie or Expert Trader! This dashboard software is working on 28 currency pairs plus one. It is based on 2 of our main indicators (Advanced Currency Strength 28 and Advanced Currency Impulse). It gives a great overview of the entire Forex market plus Gold or 1 indices. It shows Advanced Currency Strength values, currency speed of movement and signals for 28 Forex pairs in all (9) timeframes. Imagine how your trading will improve when you can watch the e
Atomic Analyst
Issam Kassas
5 (1)
First of all Its worth emphasizing here that this Trading Indicator is   Non-Repainting ,   Non-Redrawing   and   Non-Lagging   Indicator, Which makes it ideal from both manual and robot trading.  The Atomic Analyst  is a PA Price Action Indicator that uses Strength and Momentum of the price to find a better edge in the market. Equipped with Advanced filters which help remove noises and false signals, and Increase Trading Potential. Using Multiple layers of complex Indicators, the Atomic Anal
TPSproTREND PrO
Roman Podpora
5 (15)
TPSpro TRENDPRO  - is a trend indicator that automatically analyzes the market and provides information about the trend and each of its changes, as well as giving signals for entering trades without redrawing! The indicator uses each candle, analyzing them separately. referring to different impulses - up or down impulse. Exact entry points into transactions for currencies, crypto, metals, stocks, indices!  -  Version MT5               DETAILED DESCRIPTION        /       TRADING SETUPS           
TPSpro RFI Levels
Roman Podpora
5 (13)
A key element in trading is zones or levels from which decisions to buy or sell a trading instrument are made. Despite attempts by major players to conceal their presence in the market, they inevitably leave traces. Our task was to learn how to identify these traces and interpret them correctly. Reversal First Impulse levels (RFI)   -  Version MT5                INSTRUCTIONS                 RUS                 ENG                                       R ecommended to use with an indicator   -  
Introducing   Quantum Trend Sniper Indicator , the groundbreaking MQL5 Indicator that's transforming the way you identify and trade trend reversals! Developed by a team of experienced traders with trading experience of over 13 years,   Quantum Trend Sniper Indicator   is designed to propel your trading journey to new heights with its innovative way of identifying trend reversals with extremely high accuracy. ***Buy Quantum Trend Sniper Indicator and you could get Quantum Breakout Indicator fo
CURRENTLY 26% OFF Best Solution for any Newbie or Expert Trader! This Indicator is a unique, high quality and affordable trading tool because we have incorporated a number of proprietary features and a new formula. With only ONE chart you can read Currency Strength for 28 Forex pairs! Imagine how your trading will improve because you are able to pinpoint the exact trigger point of a new trend or scalping opportunity? User manual: click here That's the first one, the original! Don't buy a worthle
TrendMaestro
Stefano Frisetti
5 (2)
note: this indicator is for METATRADER4, if you want the version for METATRADER5 this is the link: TRENDMAESTRO recognizes a new TREND in the bud, he never makes mistakes. The certainty of identifying a new TREND is priceless. DESCRIPTION TRENDMAESTRO identifies a new TREND in the bud, this indicator examines the volatility, volumes and momentum to identify the moment in which there is an explosion of one or more of these data and therefore the moment in which prices have strong probability of f
Scalper Inside PRO
Alexey Minkov
4.75 (55)
An exclusive indicator that utilizes an innovative algorithm to swiftly and accurately determine the market trend. The indicator automatically calculates opening, closing, and profit levels, providing detailed trading statistics. With these features, you can choose the most appropriate trading instrument for the current market conditions. Additionally, you can easily integrate your own arrow indicators into Scalper Inside Pro to quickly evaluate their statistics and profitability. Scalper Inside
First of all Its worth emphasizing here that this Trading Tool is Non-Repainting Non-Redrawing and Non-Lagging Indicator Which makes it ideal for professional trading . The Smart Price Action Concepts Indicator is a very powerful tool for both new and experienced traders . It packs more than 20 useful indicators into one combining advanced trading ideas like Inner Circle Trader Analysis and Smart Money Concepts Trading Strategies . This indicator focuses on Smart Money Concepts providing in
Trend Screener
STE S.S.COMPANY
4.83 (86)
Unlock the Power of  Trends trading with Trend Screener Indicator: Your Ultimate Trend Trading Solution powered by fuzzy logic and Multi-currencies System ! Elevate your trend trading with Trend Screener, the revolutionary trend indicator powered by   fuzzy logic.  It is a powerful trend-following indicator that combines over  13 premium tools and features and 3 trading strategies  , making it a versatile choice to   make your Metatrader a Trend Analyzer. LIMITED TIME OFFER : Trend Screener Indi
XQ Indicator MetaTrader 4
Marzena Maria Szmit
3 (2)
Step into the realm of Forex trading with confidence and precision using XQ, a cutting-edge Forex indicator designed to elevate your trading game to unprecedented heights. Whether you're a seasoned trader or just stepping into the world of currency exchange,   XQ Forex Indicator   empowers you with the insights and signals needed to make informed trading decisions. The signal conditions are a combination of three indicators, and XQ Forex Indicator only display  medium and long-term trends . The
Quantum Breakout Indicator PRO
Bogdan Ion Puscasu
4.96 (26)
Introducing   Quantum Breakout PRO , the groundbreaking MQL5 Indicator that's transforming the way you trade Breakout Zones! Developed by a team of experienced traders with trading experience of over 13 years, Quantum Breakout PRO is designed to propel your trading journey to new heights with its innovative and dynamic breakout zone strategy. Quantum Breakout Indicator will give you signal arrows on breakout zones with 5 profit target zones and stop loss suggestion based on the breakout box.
PRO Renko System
Oleg Rodin
5 (24)
PRO Renko System is a highly accurate trading system specially designed for trading RENKO charts. The ARROWS and Trend Indicators DO NOT REPAINT! The system effectively neutralizes so called market noise giving you access to accurate reversal signals. The indicator is very easy to use and has only one parameter responsible for signal generation. You can easily adapt the tool to any trading instrument of your choice and the size of the renko bar. I am always ready to provide extra support to help
FX Power MT4 NG
Daniel Stein
5 (8)
Trading GOLD, and currencies, with the dog walk strategy  - super smart Trading GOLD, and currencies, with the breakout strategy  - super easy Visit our all-new   Stein Investments Welcome Page   to get the latest information, updates and trading strategies. FX Power MT4 NG  is the next generation of our long-time very popular currency strength meter, FX Power.  And what does this next-generation strength meter offer? Everything you have loved about the original FX Power  PLUS GOLD/XAU stre
Introducing ON Trade Waves Patterns Harmonic Elliot Wolfe, an advanced indicator designed to detect various market patterns using both manual and automated methods. Here's how it works: Harmonic Patterns: This indicator can identify harmonic patterns that appear on your chart. These patterns are essential for traders practicing harmonic trading theory, as popularized by Scott Carney's book "Harmonic Trading vol 1&2." Whether you draw them manually or rely on automated detection, ON Trade Waves
Advanced Supply Demand
Bernhard Schweigert
4.92 (310)
CURRENTLY 26% OFF !! Best Solution for any Newbie or Expert Trader! This indicator is a unique, high quality and affordable trading tool because we have incorporated a number of proprietary features and a new formula. With this update, you will be able to show double timeframe zones. You will not only be able to show a higher TF but to show both, the chart TF, PLUS the higher TF: SHOWING NESTED ZONES. All Supply Demand traders will love it. :) Important Information Revealed Maximize the potenti
Discover the Secret to Successful Forex Trading with Our Custom MT4 Indicator! Have you ever wondered how to achieve success in the Forex market, consistently earning profits while minimizing risk? Here is the answer you've been searching for! Allow us to introduce our proprietary MT4 indicator that will revolutionize your approach to trading. Unique Versatility Our indicator is specially designed for users who prefer Renko and Rangebar candle formations. We understand that these chart types are
Currency Strength Wizard is a very powerful indicator that provides you with all-in-one solution for successful trading. The indicator calculates the power of this or that forex pair using the data of all currencies on multiple time frames. This data is represented in a form of easy to use currency index and currency power lines which you can use to see the power of this or that currency. All you need is attach the indicator to the chart you want to trade and the indicator will show you real str
Scalper Vault
Oleg Rodin
5 (27)
Scalper Vault is a professional scalping system which provides you with everything you need for successful scalping. This indicator is a complete trading system which can be used by forex and binary options traders. The recommended time frame is M5. The system provides you with accurate arrow signals in the direction of the trend. It also provides you with top and bottom signals and Gann market levels. The indicator provides all types of alerts including PUSH notifications. Please contact me aft
Entry Points Pro
Yury Orlov
4.7 (224)
Top indicator for MT4 providing accurate signals to enter a trade without repainting! Watch  the video  (6:22) with an example of processing only one signal that paid off the indicator! It can be applied to any financial assets:  forex, cryptocurrencies, metals, stocks, indices.  MT5 version is here   It will provide pretty accurate trading signals and tell you when it's best to open a trade and close it. Most traders improve their trading results during the first trading week with the help of t
First of all Its worth emphasizing here that this Trading System is Non-Repainting, Non-Redrawing and Non-Lagging Indicator, Which makes it ideal for professional trading. The "Smart Support and Resistance Trading System" is an advanced indicator tailored for  new  and  experienced  traders. It empowers traders with precision and confidence in the forex market. This comprehensive system combines 7+ strategies, 10 indicators, and various trading approaches, including day trading strategy, swing
TrendDecoder Premium
Christophe, Pa Trouillas
5 (2)
Identify ranges  | Get earliest signals of Trends  | Get clear exits before reversal  | Spot the Fibo levels the price will test Non-repainting, non-delayed indicator - ideal for manual and automated trading - for all assets and all time units $69   for launch - then back to >>   $149 After purchase,   please contact me on this channel   for recommended and personalised settings MT5   version:  Click here Get our full method with  BladeSCALPER  and   PowerZONES What is it about? TrendDECOD
TakePropips Donchian Trend Pro
Eric John Pajarillaga Aldana
4.82 (17)
TakePropips Donchian Trend Pro  (MT4) is a powerful and effective tool that automatically detects the direction of the trend using the Donchian Channel and provides you with an entry and exit trading signals! This multi-function indicator includes a trend scanner, trading signals, statistical panel, screener, trading sessions, and alerts history dashboard. It is designed to provide you with trading signals and save you hours analyzing the charts! You can download the user manual and installation
Introducing the Zeus Indicator: Your Ultimate Profit-Breakthrough Trading Tool. This indicator simplifies trading, eliminating the need for in-depth analysis with breakout strategies. It automatically draws zones based on your preset timeframes, suggests Stop Loss (SL), Take Profit (TP), and Trailing Stop levels. The Zeus Indicator will promptly notify you and display signal arrows as the price approaches buy or sell entry points. It also offers recommendations for four different take profi
Trend Forecasting
Mohamed Hassan
5 (11)
This indicator is unstoppable when combined with our other indicator called Katana . After purchase, send us a message and you could get Katana  for FREE as a BONUS!  You can also ask to join our private group where we discuss together with other members!  MT5 version: click here There are limited copies available at $45 (3 copies left). Next price is $99. Don't miss this great deal!  The Trend Forecasting indicator is a very unique & easy tool that is able to make prediction a
FX Volume
Daniel Stein
4.6 (35)
Visit our all-new   Stein Investments Welcome Page   to get the latest information, updates and trading strategies. FX Volume is the FIRST and ONLY volume indicator that provides a REAL insight into the market sentiment from a broker's point of view. It provides awesome insights into how institutional market participants, like brokers, are positioned in the Forex market, much faster than COT reports. Seeing this information directly on your chart is the real game-changer and breakthrough solut
Shepherd Harmonic Pattern
Abdullah Alrai
4.68 (59)
This indicator will detect harmonic patterns that are drawn on the chart by manual and automatic methods. You can see user manual from this link: Notes Indicator has control panel and it will save every (chart & timeframe) settings. You can minimize it to have more space on chart and you can press close button to hide all indicator data on chart if you prefer to work with other analysis tools  When you use this indicator and change the settings, add indicators like Moving Average or Bollinger
Cycle Sniper
Elmira Memish
4.41 (34)
NEW YEAR SALE PRICE FOR LIMITED TIME!!! Please contact us after your purchase and we will send you the complimentary indicators to complete the system Cycle Sniper is not a holy grail but when you use it in a system which is explained in the videos, you will feel the difference. If you are not willing to focus on the charts designed with Cycle Sniper and other free tools we provide, we recommend not buying this indicator. We recommend watching the videos about the indiactor and system before pu
More from author
This indicator is based on a classic Commodity Channel Index (CCI) indicator. Multi TimeFrame indicator MTF-CCI shows CCI data from the 4 timeframes by your choice. By default this indicator has external parameters: TF1 = 1; TimeFrame2b = true; TF2 = 5; TimeFrame3b = true; TF3 = 15; TimeFrame4b = true; TF4 = 60; InpPeriod = 13; InpPRICE = 5; You can change TF1-TF4 in the next limits: TF1 from M1 (1) to H4 (240) TF2 from M5 (5) to D1 (1440) TF3 from M15 (15) to W1 (10080) TF4 from M30 (30) to MN1
This Multi TimeFrame indicator is based on the "Fractals" classical indicator. 2 Inputs: TimeFrame1; TimeFrame2; You can put any available TimeFrame values (from M1 (Period_M1) to MN1 (Period_MN1)) equal or greater ( >= ) than the Period of the current Time Frame. The last Fractals will shown as color lines (Dots Line) of Support and Resistance for the Price moving.
This is a Multi-Time indicator which allows to display RSI and Stochastic indicators from upper timeframes on a single chart. As an example: a single chart EURUSD M5 and RSI (blue line) and Stochastic (yellow line) from H1. Red Histogram is representing Lower trend and Green Histogram is representing Upper trend.
When you put this Multi TimeFrame Parabolic SAR indicator on the chart it will automatically use Parabolic SAR from next available 3 timeframes. Green arrow will show the beginning of Up trend and Red arrow will show the beginning of Down trend. If AlertsEnabled = true, the indicator will show the Alert (message window) with a text like this: "Price going Down on ", Symbol(), " - ", Period(), " min", " price = ", Bid; If eMailEnabled = true the Indicator will send you an eMail with the same text
The zero line is characterized the Flat trend. V-shaped impulse indicates the entrance to the opposite direction. U-shaped impulse = entry orders in the same direction. If AlertsEnabled = true, the indicator will show the Alert (message window) with a text like this: "Price going Down on ", Symbol(), " - ", Period(), " min", " price = ", Bid; If eMailEnabled = true the indicator will send you an eMail with the same text an Alert message with subject: "Trinity-Impolse" (of course you have to
The indicator displays the usual Moving Average with input parameters: maPeriod_1; maMethod_1; maAppPrice_1. Then it calculates and displays MA on MA1 with input parameters: maPeriod_2; maMethod_2. Then it calculates and displays MA on MA2 with input parameters: maPeriod_3; maMethod_3. If AlertsEnabled = true the Indicator will show the Alert (message window) with a text like this: "Price going Down on ", Symbol(), " - ", Period(), " min", " price = ", Bid; If eMailEnabled = true the Indicator w
Multi TimeFrame Indicator "MTF CCI Trigger" based on the Commodity Channel Index from the upper TF (input parameter "TimeFrame") yellow line. Aqua line is representing ATR envelopes from the current TF. Green and Red arrows is triggered by CCI and represented UP and DOWN trends accordingly.
The BBImpulse indicator is based on the standard Moving Average indicator. You have MA input parameters: maPeriod - Moving Average period; maMODE - Moving Average mode (0 = MODE_SMA; 1 = MODE_EMA; 2 = MODE_SMMA; 3 = MODE_LWMA); maPRICE - Applied price (0=PRICE_CLOSE; 1=PRICE_OPEN; 2=PRICE_HIGH; 3=PRICE_LOW; 4=PRICE_MEDIAN; 5=PRICE_TYPICAL; 6=PRICE_WEIGHTED). Green Histogram is representing an UP-trend, Red Histogram is representing a Down-trend.
Multi TimeFrame indicator MTF ADX with Histogram shows ADX indicator data from the TF by your choice. You may choose a TimeFrame equal or greater than current TF. Yellow line is representing a price trend from the upper TF. Green line is representing +DI from the upper TF. Red line is representing -DI from the upper TF. Green histogram is displaying an Up-trend. Red histogram is displaying a Down-trend.
This Indicator creates 2 white lines based on Exponential Moving Averag e of High and Low prices. You can regulate how many bars will be involved in the calculation with input parameter HL_Period. Red and Blue arrows are displaying the moment to go Short and Long trades accordingly.
The most common way to interpreting the price Moving Average is to compare its dynamics to the price action. When the instrument price rises above its Moving Average, a buy signal appears, if the price falls below its moving average, what we have is a sell signal. To avoid a spontaneous entries one may use this update from Moving Average Indicator = Stepper-MA.
Envelopes technical Indicator is formed with two Moving Averages one of which is shifted upward and another one is shifted downward. Envelopes define the upper and the lower margins of the price range. Signal to sell appears when the price reaches the upper margin of the band; signal to buy appears when the price reaches the lower margin. To avoid a spontaneous entries one may use this update from Envelopes Indicator = Envelopes-Stepper.
The interpretation of the Bollinger Bands is based on the fact that the prices tend to remain in between the top and the bottom line of the bands. Abrupt changes in prices tend to happen after the band has contracted due to decrease of volatility; If prices break through the upper band, a continuation of the current trend is to be expected; If the pikes and hollows outside the band are followed by pikes and hollows inside the band, a reverse of trend may occur; The price movement that has sta
Fibonacci sequence is defined by integer sequence: 0, 1, 1, 2, 3, 5, 8, 13, 34, 55, 89, 144, ... By definition, it starts from 0 and 1, the next number is calculated as a sum of two previous numbers. Instead of the standard moving average, the indicator uses the caluclation of average price in form: Bar0 + Bar1 + Bar2 + Bar3 + Bar5 + Bar8 + Bar13 +... Input parameters:  FiboNumPeriod (15) - Fibonacci period; nAppliedPrice (0) - applied price (PRICE_CLOSE=0; PRICE_OPEN=1; PRICE_HIGH=2; PRICE_LOW
This indicator present a main Moving Average line with input parameters maPeriod_1, maMethod_1 and maAppPrice_1. The second line will be a calculation of the Moving Average data of a first line with input parameters maPeriod_2, maMethod_2. The third line will be a calculation of the Moving Average data of a second line with input parameters maPeriod_3, maMethod_3. To avoid a spontaneous entries one may use this indicator-stepper.
This indicator (as almost all others) is based on classical Moving Averages. It shows the Average Bar under the current bar colored in aqua or over the current bar colored in orange. Input Parameters: ma_Period and ma_Method. The Average Bar maybe helpful to predict where the price will move in the nearest future. Of course, this "near future" depends of the current time frame.
Buy when the market is falling and sell when the market is rising. When the market is moving down you start observing and looking for buy signals. When the market is moving up you start looking for sell signals. This indicator points to the moments to Buy (Blue arrow) and to Sell (Orange arrow). Two input parameters: barsNumber and step for optimization (depending on symbol and Time Frame).
This indicator shows: A green light in case the price goes up; A red light in case the price goes down; A yellow light in case there are a sideways trend. A sideways trend is the horizontal price movement that occurs when the forces of supply and demand are nearly equal. This typically occurs during a period of consolidation before the price continues a prior trend or reverses into a new trend
This indicator is created for M1 timeframe. It shows how many ticks has occurred during current minute and ( after the slash) the sum of points Up (aqua color) and Down (orange color). In times of a high trading activity a grow up number of ticks Up and Down will signal of a big move of the price in the near future. In times of a high trading activity a grow up number of sum of points Up and Down will signal of a big move of the price in the near future too.
Two yellow lines. This is similar to classical Envelopes but with automatic deviation. The Envelopes indicator is   a tool that attempts to identify the upper and lower bands of a trading range. Aqua line. This is a classical Commodity Channel Index added to the Envelopes on the chart, not in a separate window. The Commodity Channel Index ( CCI ) is a technical   indicator   that measures the difference between the current price and the historical average price.
Probability deals with the likelihood of an event happening.   Forex   probability indicates a possibility at a specific time. This is because the forex market is highly volatile, and predicting future events affecting it is impossible. This indicator will show a positive number above the current High or negative number under the current Low as a probability of the trend. Higher time frames usually show a higher probability, even more then 100%.
Envelopes is an excellent indicator when the market is trending. Open Long position when the ClosePrice crossed the upper Aqua band. Close Long position when the Price crossed the upper Yellow band moving down. Open Short position when the ClosePrice crossed the lower Aqua band. Close Short position when the Price crossed the lower Yellow band moving up.
Moving Average Bars is a self-explanatory indicator with one input parameter: nPeriod. When the previous Price Close is above the previous indicator Bar, the probability to go Long is very high.   When the previous Price Close is under the previous indicator Bar, the probability to go Short is very high.
This indicator is based on the same idea as https://www.mql5.com/en/market/product/2406 , but instead of Average Bars it uses series or Fibonacci sequence. When the previous Price Close is above the previous indicator Bar, the probability to go Long is very high. When the previous Price Close is under the previous indicator Bar, the probability to go Short is very high.
This indicator is based on two ideas: Correlations between 5 main currency pairs: EURUSD, GBPUSD, USDCHF, USDJPY, USDCAD; US Dollar Index = the value of the United States dollar relative to a basket of foreign currencies. The use of the indicator is the same as classical  Commodity Channel Index  (CCI) indicator. CCI is calculated with the following formula:  (Typical Price - Simple Moving Average) / (0.015 x Mean Deviation) (Typical Price - Simple Moving Average) / (0.015 x Mean Deviation)
A  tick  is a measure of the minimum upward or downward movement in the  price  of a security. A  tick  can also refer to the change in the  price  of a security from one trade to the next trade.  This indicator will show amounts of ticks when the price goes up and down. This indicator is designed for M1 time frame and shows: Sum of points when the price goes up (Green Histogram). Sum of points when the price goes down (Red Histogram). 
This indicator is a combination of 2 classical indicators MA and RVI. The Relative Vigor Index (RVI) is a momentum indicator used in technical analysis that measures the strength of a trend by comparing a security's closing price to its trading range while smoothing the results using a simple moving average   The input parameter  counted_bars  determines how many bars the indicator's lines will be visible. The input parameter MaRviPeriod  is used for MA and RVI calculation.
This indicator is a combination of 2 classical indicators: MA and Force Index. The input parameter  counted_bars  determines on how many bars the indicator lines will be visible. The input parameter  MaForcePeriod  is used for MA and Force calculation. You may go Long if the current price crossed Up the Ribbon (HISTOGRAM)  and you may go Short if the current price crossed Down the Ribbon (HISTOGRAM)
This indicator is a combination of 2 classical indicators: MA and CCI. Two moving averages form Upper and Lower bands. The input parameter  counted_bars  determines on how many bars the indicator's lines will be visible. The input parameter  barsNum  is used for MA and CCI calculation.
This indicator is using 2 classical indicators: Commodity Channel Index from the higher TF (which you may change using input parameter TimeFrame ) and Average True Range from the current TF. The Green ribbon indicates the upper trend and the Red ribbon indicates the down trend. Buy when the Yellow line crosses the Upper bound (Aqua line). Sell when the Yellow line crossover the Lower bound (Aqua line).
Filter:
No reviews
Reply to review
Version 5.5 2020.05.23
A new version, compiled by the latest MetaEditor build.