Bollinger Breakout Trader MT5
- Indicators
- Stephen Reynolds
- Version: 1.0
- Activations: 20
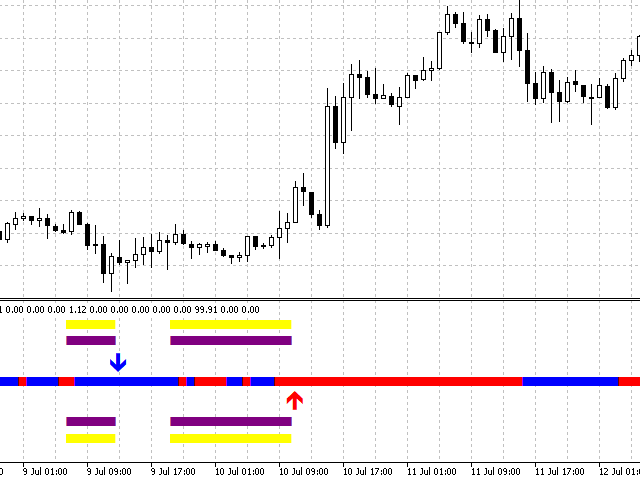
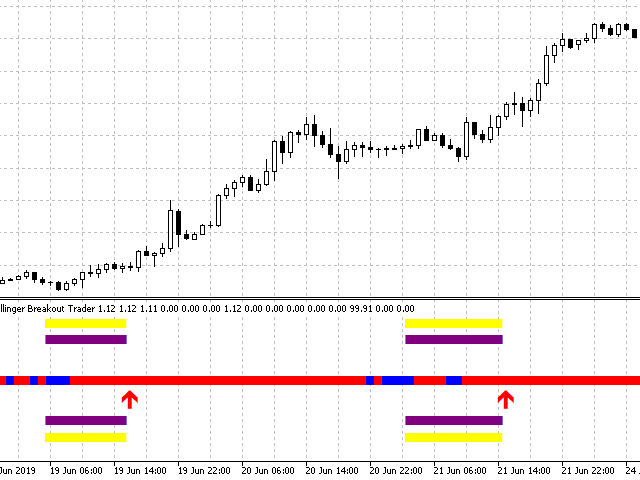
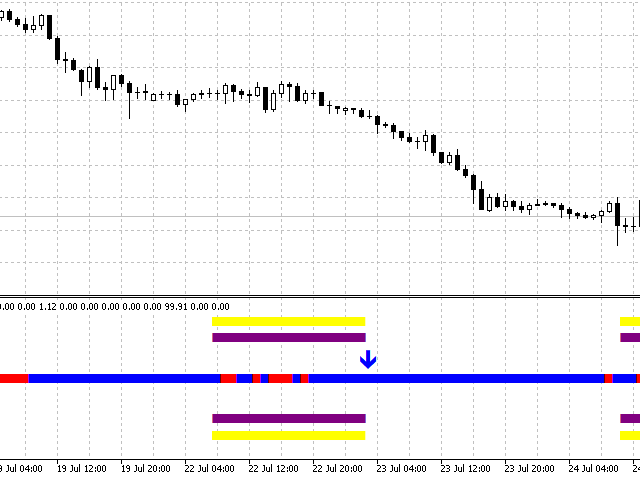
Bollinger Breakout Trader tells the trader when the market is about to breakout from a non-volatile period.
Non volatility usually means its building up steam for more good moves in future. A signal is formed when this switch from non-volatile to volatile occurs.
These periods are measured by both Bollinger Bands and Keltner Channels. Bollinger Bands measure the standard deviation of price from the Moving Average which results in an expanding and contracting channel. Keltner Channels are based on the Moving Average and the Average True Range of the Moving Average. This results in a more steady range. When the Bollinger Bands dip inside these Keltner Channels the market is deemed non-volatile. And when Bollinger Bands move outside these bands usually there is volatile periods with good moves.
To decide on which direction to trade we use Momentum to tell us which direction is strongest and most likely to continue.
Features :
- A practical way of recognizing when a new trend is about to occur.
- Choose when you want your record session high to start and when you want it to reset the count.
- Choose your favorite signal color.
- Send alerts to either your PC, eMail or mobile device.
- Works on any timeframe.
Settings :
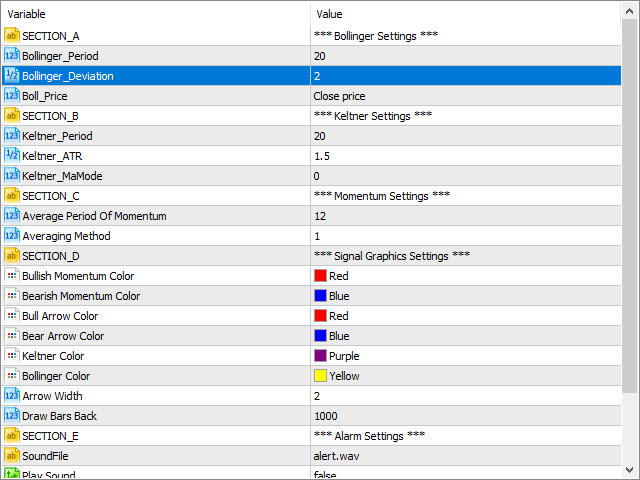
Bollinger Settings
- Bollinger_Period - Sets the period of the Bollinger Bands moving average.
- Bollinger_Deviation - Sets the standard deviation calculation.
- Bollinger_MaPeriod - Sets the type of average we base our calculation on : 0 = Simple Averaging, , 1 = Exponential Averaging, 2 = Smoothed Averaging, 3 = Linear Weighted Averaging
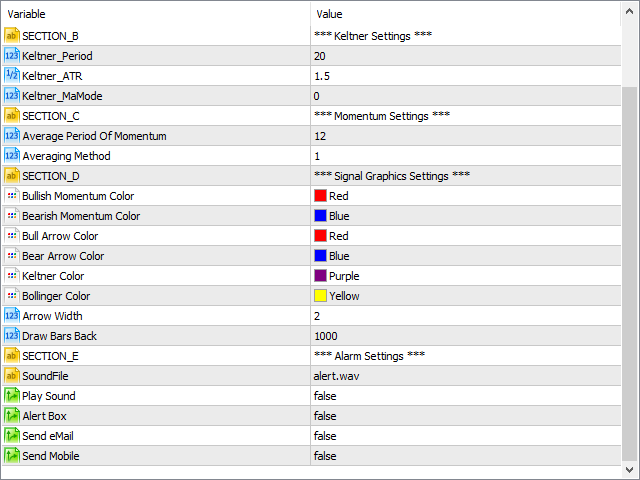
Keltner Settings
- Keltner_Period - The period we set our Keltner channel on.
- Keltner_ATR - The Average True Range we set our Keltner channel on.
- Keltner_MaMode - Sets the type of average we base our calculation on : 0 = Simple Averaging, , 1 = Exponential Averaging, 2 = Smoothed Averaging, 3 = Linear Weighted Averaging
Momentum Settings
- Average Period Of Momentum - Sets the period we base our Momentum on.
- Averaging Method - Sets the type of average we base our calculation on : 0 = Simple Averaging, , 1 = Exponential Averaging, 2 = Smoothed Averaging, 3 = Linear Weighted Averaging
Signal Color Settings
- Bullish Momentum Color - Select your required color for the bullish Momentum Signal color.
- Bearish Momentum Color - Select your required color for the bearish Momentum Signal color.
- Buy Arrow Color - Sets the buy arrow color.
- Sell Arrow Color - Sets the sell arrow color.
- Keltner Color - Sets the Keltner channel color.
- Bollinger Color - Sets the Bollinger Band color.