Advanced Fibo Average Levels MT5
- Indicators
- Sergey Efimenko
- Version: 1.4
- Updated: 3 March 2024
- Activations: 10
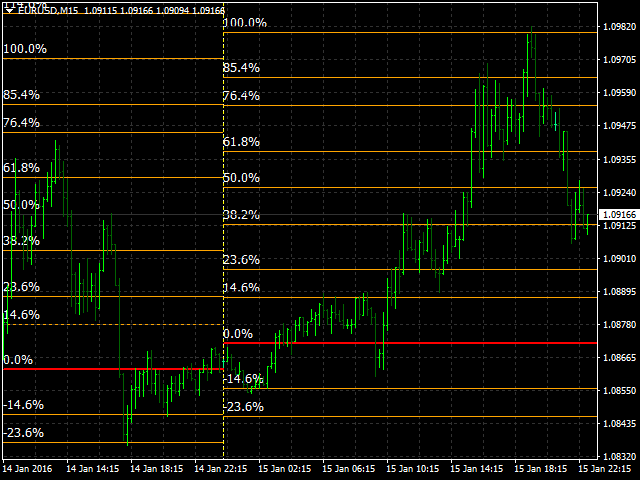
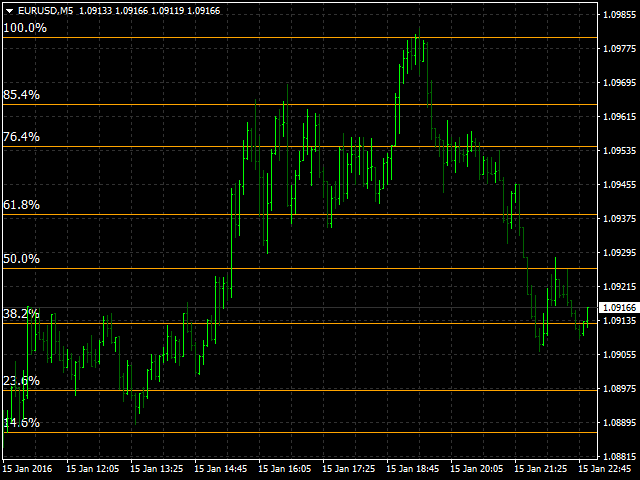
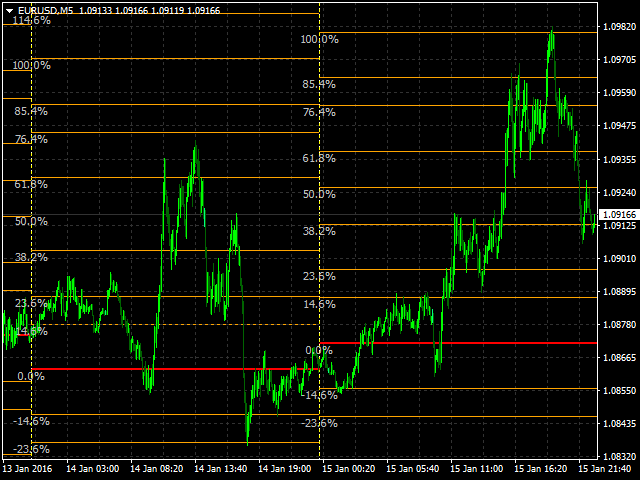
The indicator automatically calculates and plots Fibonacci support and resistance levels - one of the most effective tools for market analysis.
The calculation uses the averaged price data for the selected period and timeframe. The minimum and maximum for this period are taken as the beginning and end of the movement.
Fibonacci levels allow you to see potential reference points, around which the price movement can slow down or reverse, that is, they are used to predict further movement, as well as to place stop and limit orders.
Parameters:
- PartsShow - the number of displayed historical levels from the current bar
- CalcPeriod - price averaging period
- SmoothingMethod - price averaging method (26 options)
- TF - timeframe used for calculating
- LevelColor - color of level lines
- ZeroLevelColor - zero level color
- ShowVerticalLine - enable/disable display of a vertical line between levels
- VLineStyle - the style of the vertical line
- VLineColor - the color of the vertical line
- ShowInfo - enable the display of information about the value of the level percentage in the form of labels, otherwise, in the form of object descriptions
- InfoFontSize - information font size
- InfoColor - the color of the information string
- FiboLevels - percentage values of displayed levels


Good Author and useful tools, 5 stars!