Dynamic POC MT5
- Indicators
- Evgeny Shevtsov
- Version: 2.4
- Updated: 27 January 2024
- Activations: 10
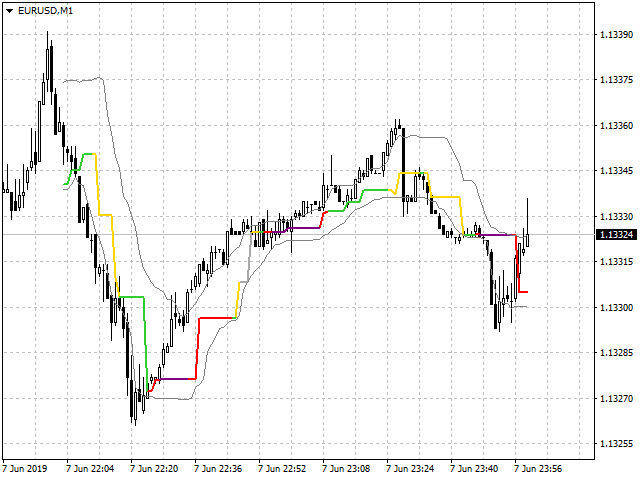
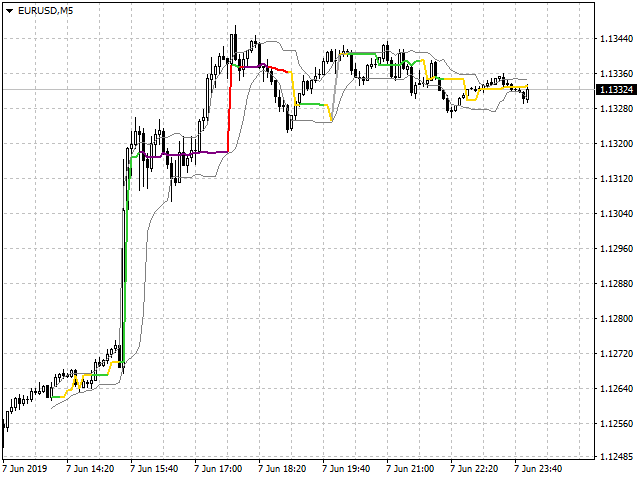
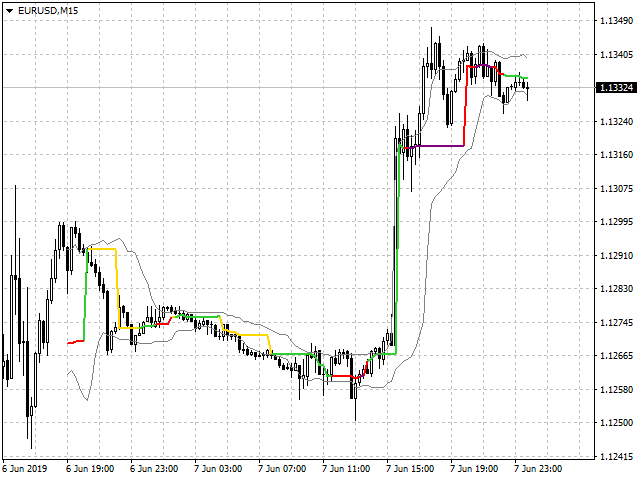
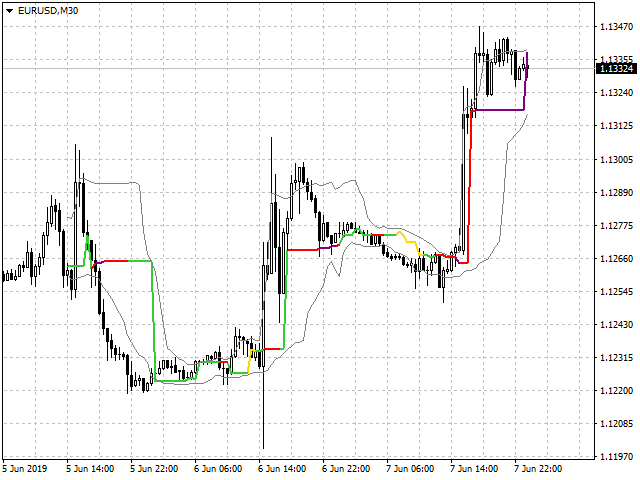
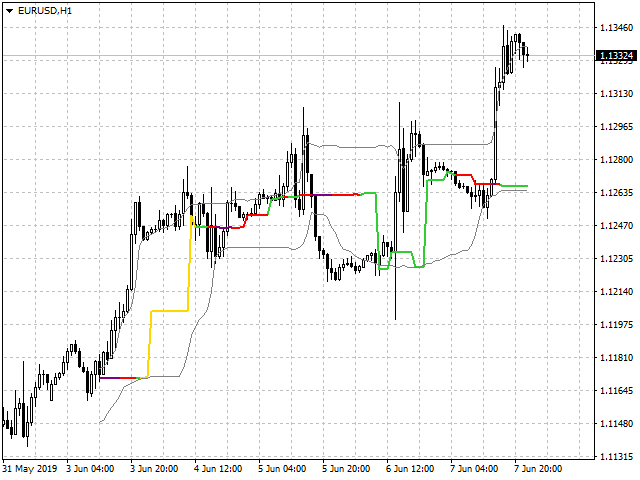
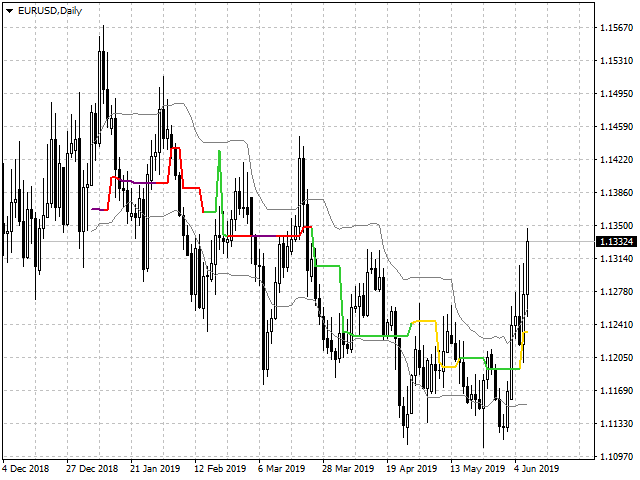
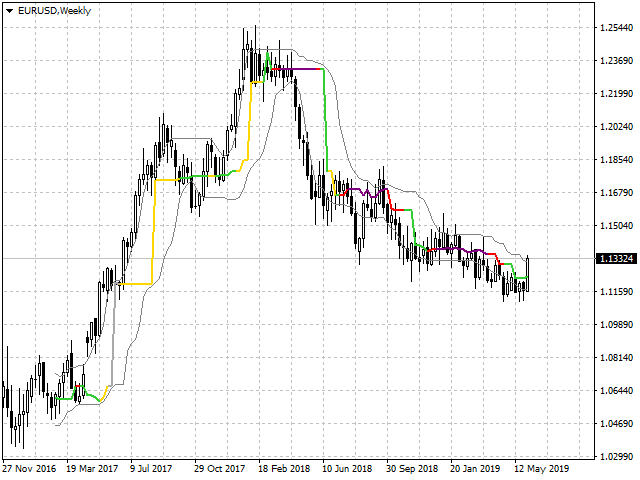
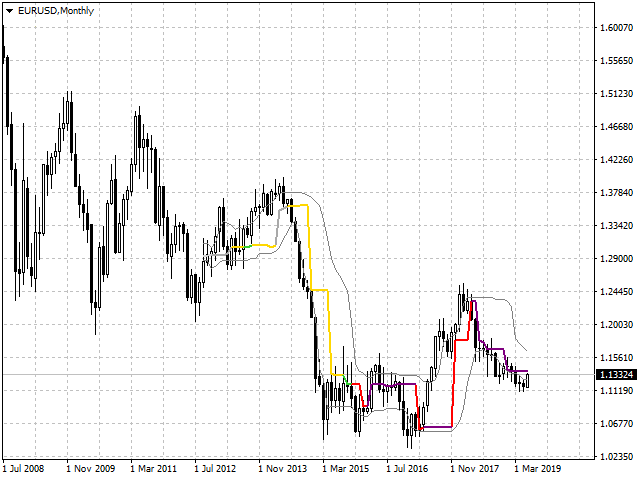
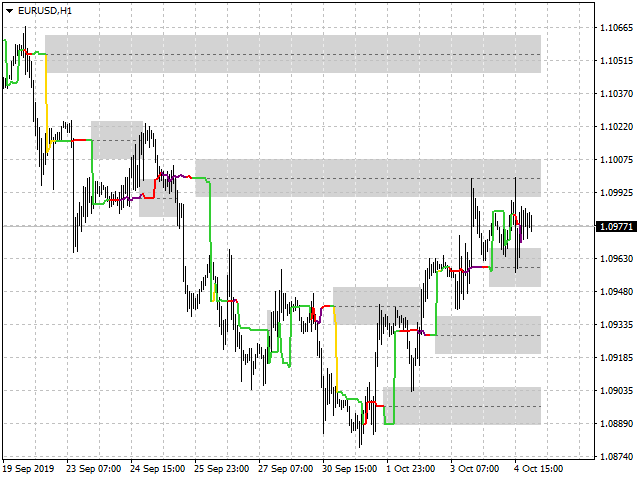
The indicator calculates volume profiles dynamically and displays the result as VAL, VAH and POC curves.
Indicator features
The indicator uses the historical data of the lower (relative to the current) timeframes for calculations:
- M1 - for timeframes up to H1,
- M5 - for timeframe H1,
- M15 - for timeframe H4,
- H1 - for timeframe D1,
- H4 - for timeframe W1,
- D1 - for timeframe MN.
The color of the DPOC curve sections is determined by comparing the volume of the POC levels of all profiles that make up this curve.
Full recalculation of the entire curve is carried out when the chart is scaled, when the chart is scrolled, when the timeframe is switched, and when a new candle appears. However, the value of the curve on the last candle is recalculated regularly, at intervals of once per second.
Input variables
- PocPeriod - the length of the base profile, is set in candles, if the value is zero then the length is assigned automatically depending on the current timeframe:
- M1 - 15 candles (15 minutes),
- M5 - 12 candles (1 hour),
- M15 - 16 candles (4 hours),
- M30 - 16 candles (8 hours),
- H1 - 24 candles (1 day),
- H4 - 30 candles (1 week),
- D1 - 22 candles (1 month),
- W1 - 13 candles (1 quarter),
- MN - 12 candles (1 year).
- ValueArea - profile value area in percents.
- ValueAreaType - value area calculation method:
- OfPocND - normal distribution relative to the POC level.
- OfTotalVolume - distribution based on the amount of volume traded in the profile.
- VolumesType - type of volumes used in the calculations:
- Tick - tick volumes.
- Real - real volumes, if broadcasted by the broker.
- Without - ignore volumes, calculation according to the TPO principle, but based on lower timeframe.
- BarsLimit - limiting the number of candles in the area of which the DPOC curve will be built.
- VALColor - color for the VAL curve.
- VAHColor - color for the VAH curve.
- LowestPocColor, LowPocColor, MiddlePocColor, MediumPocColor, HighPocColor, HighestPocColor - group of variables determining the color plots of the DPOC curve, depending on the volume value.


Best value for money spend on an indicator. thank you very much for creating this wonderfull script.