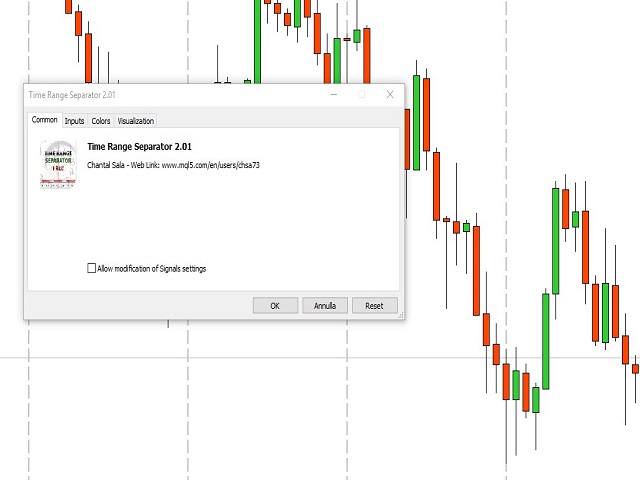
Time Range Separator MT5
- Indicators
- Chantal Sala
- Version: 2.1
Time Range Separator is a useful tool to display a separator period on your platform.
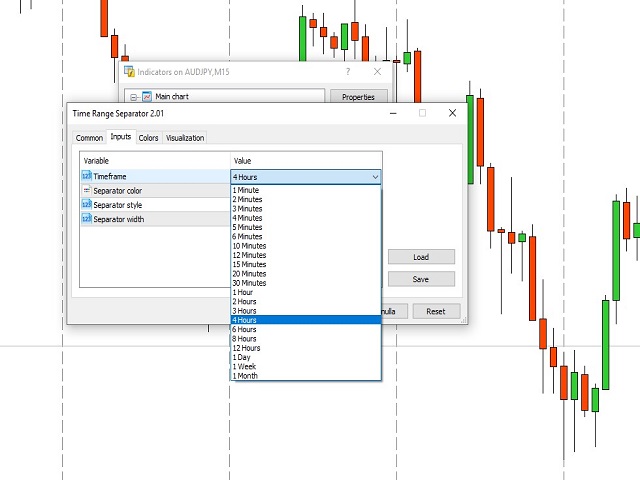
You could go in the properties of the indicator, select the desired range and that's ALL.
We believe it is a useful and necessary that we wish to share with you for free all our followers.
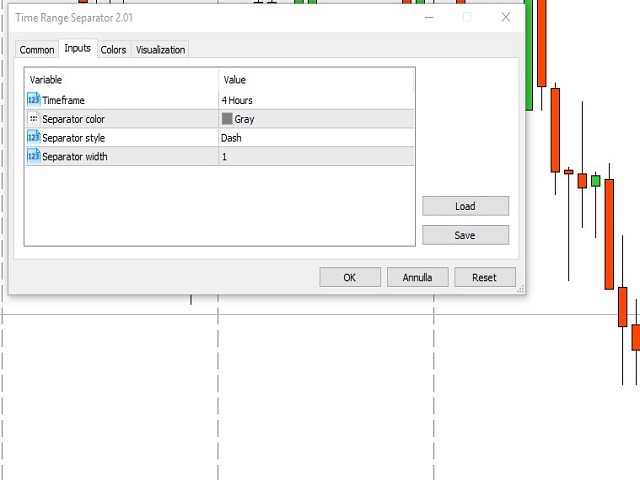
Input Values:
- TimeFrame = Period Separator
- Separator_Color = Vertical Color Line
- Separator_Style = Vertical Color Style
- Separator_Width = Vertical Line Width
Good trading to all and see you soon.
Same indicator for MT4 here: https://www.mql5.com/en/market/product/12780


Great app. In Forex, have not met yet the app with both, trade and risk manager.