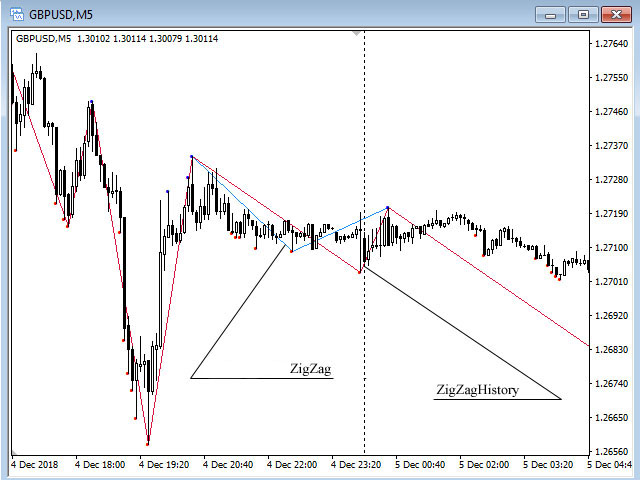
• Overview
  • Reviews
  • Comments (1)
  • What's new

ZigZagHistory

The indicator was developed with one purpose - adequate processing on stories and the maximum approach to the original

(it was required for development of more difficult indicator and use in the expert).

I think, everything who tried to get history from the original indicator understood that in it there is information only on extrema and nothing more.
It is not sure that similar does not exist, but mine is found on other than original to an algorithm:
- for one pass (programmers will understand);
- on 1 buffer (original uses 3 buffers), at me 2 additional buffers display complete history of a portrayal (it is possible to turn off display);
- only on the last bar, but can redraw the last 2 extrema if at a depth of BackStep the current extremum is punched;
- at installation of the BackStep parameter = 0 redraw will not be;

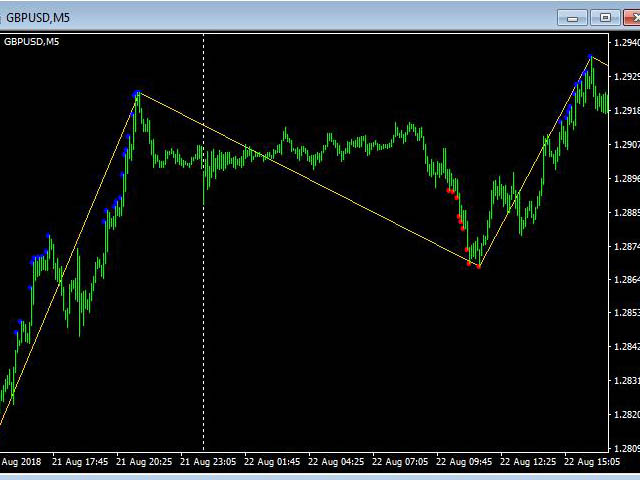
- does not pass extrema (an example on the 2nd screenshot).

Attention! The Price noise parameter - has significant effect on formation of extrema.

Parameters:

Depth - is depth of search of a local extremum in bars;

Price noise - is standard value of price noise for the current timeframe and the tool;

Backstep - is depth of correction of global extrema in bars;

ShowHistory - switch on/off display of history.

On minute calc - is switching ON/OFF of calculation on minute bar (it is switched off - calculation on each tic).

Recommended products
PZ Trend Trading
PZ TRADING SLU
4.75 (4)
Trend Trading is an indicator designed to profit as much as possible from trends taking place in the market, by timing pullbacks and breakouts. It finds trading opportunities by analyzing what the price is doing during established trends. [ Installation Guide | Update Guide | Troubleshooting | FAQ | All Products ] Trade financial markets with confidence and efficiency Profit from established trends without getting whipsawed Recognize profitable pullbacks, breakouts and early reversals The ind
Blahtech Market Profile
Blahtech Limited
4.61 (18)
Was: $249  Now: $99   Market Profile defines a number of day types that can help the trader to determine market behaviour. A key feature is the Value Area, representing the range of price action where 70% of trading took place. Understanding the Value Area can give traders valuable insight into market direction and establish the higher odds trade. It is an excellent addition to any system you may be using. Blahtech Limited presents their Market Profile indicator for the MetaTrader community. Ins
Forex Gump
Andrey Kozak
2.83 (6)
Forex Gump is a fully finished semi-automatic trading system. In the form of arrows, signals are displayed on the screen for opening and closing deals. All you need is to follow the instructions of the indicator. When the indicator shows a blue arrow, you need to open a buy order. When the indicator shows a red arrow, you need to open a sell order. Close orders when the indicator draws a yellow cross. In order to get the most effective result, we recommend using the timeframes H1, H4, D1. There
Daily Candle Predictor is an indicator that predicts the closing price of a candle. The indicator is primarily intended for use on D1 charts. This indicator is suitable for both traditional forex trading and binary options trading. The indicator can be used as a standalone trading system, or it can act as an addition to your existing trading system. This indicator analyzes the current candle, calculating certain strength factors inside the body of the candle itself, as well as the parameters of
Master Scalping M1 is an innovative indicator that uses an algorithm to quickly and accurately determine the trend.The indicator calculates the time of opening and closing positions, the indicator's algorithms allow you to find the ideal moments to enter a deal (buy or sell an asset), which increase the success of transactions for most traders. Benefits of the indicator: Easy to assemble, does not overload the chart with unnecessary information. Can be used as a filter for any strategy. Works on
Fibonacci retracement and extension line drawing tool Fibonacci retracement and extended line drawing tool for MT4 platform is suitable for traders who use  golden section trading Advantages: There is no extra line, no too long line, and it is easy to observe and find trading opportunities Trial version: https://www.mql5.com/zh/market/product/35884 Main functions: 1. Multiple groups of Fibonacci turns can be drawn directly, and the relationship between important turning points
Cosmic Diviner X Planet
Olena Kondratenko
4 (2)
This unique multi-currency strategy simultaneously determines the strength of trends and market entry points, visualizing this using histograms on the chart. The indicator is optimally adapted for trading on the timeframes М5, М15, М30, Н1. For the convenience of users, the indicator renders the entry point (in the form of an arrow), recommended take profit levels (TP1, TP2 with text labels) and the recommended Stop Loss level. The take profit levels (TP1, TP2) are automatically calculated for
Infinity Trend Pro
Yaroslav Varankin
1 (1)
This is a trend indicator without redrawing Developed instead of the binary options strategy (by the color of the Martingale candlestick) Also works well in forex trading When to open trades (binary options) A signal will appear in the place with a candle signaling the current candle It is recommended to open a deal for one candle of the current timeframe M1 and M5 When a blue dot appears, open a deal up When a red dot appears, open a trade down. How to open trades on Forex. When a signal is rec
TWO PAIRS SQUARE HEDGE METER INDICATOR Try this brilliant 2 pairs square indicator It draws a square wave of the relation between your two inputs symbols when square wave indicates -1 then it is very great opportunity to SELL pair1 and BUY Pair2 when square wave indicates +1 then it is very great opportunity to BUY pair1 and SELL Pair2 the inputs are : 2 pairs of symbols         then index value : i use 20 for M30 charts ( you can try other values : 40/50 for M15 , : 30 for M30 , : 10 for H1 ,
Noize Absorption Index MT4
Ekaterina Saltykova
5 (1)
Noize Absorption Index - is the manual trading system that measures the difference of pressure between bears forces and bulls forces. Green line - is a noize free index that showing curent situation. Zero value of index shows totally choppy/flat market.Values above zero level shows how powerfull bullish wave is and values below zero measures bearish forces.Up arrow appears on bearish market when it's ready to reverse, dn arrow appears on weak bullish market, as a result of reverse expectation. S
Bintang Binary R2
Anthonius Soruh
5 (2)
Bintang Binary Indicator work all pairs Time Frame : M5 Expaired : 1 Candle No Repaint, No Delay and Alerts Use manual and auto trading  Easy to use Trial Version, Rent Version and Full Version avaliable Trial Version >>> download here  https://www.mql5.com/en/market/product/54602 Trial Version not have Alerts Rent version 1 month, 3 month, 6 month, 9 month, and 1 years Auto trading is better use MT2 Trading Platform (Contact me for discount 10 % MT2 trading licence) Work good for forex trading
Strong Retracement Points Pro demo edition! SRP (Strong Retracement/Reversal Points) is a powerful and unique support and resistance indicator. It displays the closest important levels which we expect the price retracement/reversal! If all level are broken from one side, it recalculates and draws new support and resistance levels, so the levels might be valid for several days depending on the market! If you are still hesitating to start using this wonderful tool, you can check this link to see h
Trend Bilio - an arrow indicator without redrawing shows potential market entry points in the form of arrows of the corresponding color: upward red arrows suggest opening a buy, green down arrows - selling. The entrance is supposed to be at the next bar after the pointer. The arrow indicator Trend Bilio visually "unloads" the price chart and saves time for analysis: no signal - no deal, if an opposite signal appears, then the current deal should be closed. It is Trend Bilio that is considered
To get access to MT5 version please click here . - This is the exact conversion from TradingView: "Stochastic Momentum Index" By "UCSgears". - This is a popular version of stochastic oscillator on tradingview. - This is a light-load processing and non-repaint indicator. - Buffers are available for the lines on chart. - You can message in private chat for further changes you need. Thanks for downloading
How to use Pair Trading Station Pair Trading Station is recommended for H1 time frame and you can use it for any currency pairs. To generate buy and sell signal, follow few steps below to apply Pair Trading Station to your MetaTrader terminal. When you load Pair Trading Station on your chart, Pair Trading station will assess available historical data in your MetaTrader platforms for each currency pair. On your chart, the amount of historical data available will be displayed for each currency pai
ZhiBiCCI MT4
Qiuyang Zheng
5 (1)
[ZhiBiCCI] indicators are suitable for all cycle use, and are also suitable for all market varieties. [ZhiBiCCI] Green solid line is a reversal of bullish divergence. The green dotted line is a classic bullish divergence. [ZhiBiCCI] The solid line to the red is a reverse bearish divergence. The red dotted line is a classical bearish divergence. [ZhiBiCCI] can be set in the parameters (Alert, Send mail, Send notification), set to (true) to send instant signals to the alarm window, email, in
Scalping Snake Pro is a unique scalping indicator that shows the trader the price reversal moments and does not redraw. This indicator, unlike many others on the Internet, does not redraw its values. It draws signals on the very first bar, which allows you not to be late with opening deals. This indicator sends notifications to the trader by phone and email when a signal appears. You get all this functionality for only $147. How to trade with this indicator? Open the H1 timeframe. Currency pa
Shark Deal Book
Philip Pankaj Suthagar
4 (3)
Term  "shark"  in the business world denotes a high volume investor who just made a good investment in a highly Potential business deal.So, sharks are the ones who make the market move. In our case, if an American shark bought a Japanese company, he/she has to convert American dollars into Japanese yen to make the deal. So, the demand for the Japanese yen will increase sharply. Thus USD/JPY will go short rapidly if the deal was from the shark. Another example, In the case of forex, if fed increa
The Th3Eng PipFinite indicator is based on a very excellent analysis of the right trend direction with perfect custom algorithms. It show the true direction and the best point to start trading. With StopLoss point and Three Take Profit points. Also it show the right pivot of the price and small points to order to replace the dynamic support and resistance channel, Which surrounds the price. And Finally it draws a very helpful Box on the left side on the chart includes (take profits and Stop loss
ZhiBiMACD MT4
Qiuyang Zheng
4.5 (2)
This is a unique MACD indicator that is more accurate and easy to use than traditional MACD. It is suitable for any chart cycle and is suitable for any market variety. The red column is the (Buy) band signal, and the blue column is the (Sell) band signal. The yellow and green lines are trend lines, and the two lines never cross. Buy: In the blue column, look at the green line up through the middle 0 axis. Sell: In the red column, look at the yellow line down the middle 0 axis. The MACD
VR Cub
Vladimir Pastushak
VR Cub is an indicator for getting high-quality entry points. The indicator was developed to facilitate mathematical calculations and simplify the search for entry points into a position. The trading strategy for which the indicator was written has been proving its effectiveness for many years. The simplicity of the trading strategy is its great advantage, which allows even novice traders to successfully trade with it. VR Cub calculates position opening points and Take Profit and Stop Loss targe
RaysFX Supertrend Bar RaysFX Supertrend Bar è un indicatore personalizzato per MetaTrader 4. Utilizza l'indice di canale delle materie prime (CCI) per generare segnali di trading. L'indicatore mostra dei puntini in una finestra separata sotto il grafico principale per indicare i segnali di trading. Caratteristiche principali: Calcola il CCI per diversi periodi temporali. Visualizza puntini per indicare i segnali di trading. Permette all'utente di modificare i periodi temporali e la distanza tra
Night ghost
Dmitriy Kashevich
Night Ghost - Arrow indicator for binary options. This is a reliable assistant to you in the future! - No redrawing on the chart -Works great on EUR/USD currency pairs! -Indicator accuracy up to 90% (Especially at night) -No long setup required (Perfectly set up for Binary Options) - Not late signals - The appearance of a signal on the current candle -Perfect for M1 period (No More!) - Eye-friendly candle color (Red and Blue) -Installed Alert Working with it: - Blue arrow
Owl smart levels
Sergey Ermolov
4.63 (54)
MT5 version  |  FAQ The Owl Smart Levels Indicator  is a complete trading system within the one indicator that includes such popular market analysis tools as  Bill Williams' advanced fractals , Valable ZigZag which builds  the correct wave structure  of the market, and  Fibonacci levels  which mark the exact levels of entry into the market and places to take profits. Detailed description of the strategy Instructions for working with the indicator Advisor-assistant in trading Owl Helper Private
Sto Signal AM
Andriy Matviyevs'kyy
This indicator displays Stochastic osc signals on the price chart and allows the user to receive notifications of such signals. The Stochastic indicator is a classic and proven indicator of the technical analysis of the markets. Despite its age, it is still relevant today. Depending on the settings, the indicator allows you to work effectively on various TFs and any markets. Signals are given on fully formed bars and are not redrawn. Custom Parameters: Stochastic_Price (0-1) - The applied pric
MA Alignment Scanner
Benedict Jamora
5 (1)
This indicator scans and displays currency pairs that have recently aligned moving averages on a given timeframe. You can configure which pairs the indicator will scan. It also includes all types of alert options. Bullish MA Alignment =  MA1>MA2>MA3>MA4>MA5 Bearish MA Alignment =  MA1<MA2<MA3<MA4<MA5 Features Attach to one chart and scans all the currency pairs configured and visible in the Market Watch Window It can monitor all the available timeframes from M1 to MN1 and sends alerts on ever
Heiken Ashi candle chart is an improved version of The Japanese candle chart, which can effectively filter the market "noise" of the Japanese candle chart. It is favored by many traders for its simplicity and intuition. For trend traders, the HA candle chart is a magic tool. Unlike the traditional Japanese candle chart, Heikenashi does not reflect the opening price, high price, low price and closing price of the market. Instead, Heikenashi calculates the value of a single K line in the dominant
Indicator for binary options arrow is easy to use and does not require configuration works on all currency pairs, cryptocurrencies buy signal blue up arrow sell signal red down arrow tips do not trade during news and 15-30 minutes before their release, as the market is too volatile and there is a lot of noise it is worth entering trades one or two candles from the current period (recommended for 1 candle) timeframe up to m 15 recommended money management fixed lot or fixed percentage of the depo
The indicator displays the data of the Stochastic oscillator from a higher timeframe on the chart. The main and signal lines are displayed in a separate window. The stepped response is not smoothed. The indicator is useful for practicing "manual" forex trading strategies, which use the data from several screens with different timeframes of a single symbol. The indicator uses the settings that are identical to the standard ones, and a drop-down list for selecting the timeframe. Indicator Parame
The indicator builds current quotes, which can be compared with historical ones and on this basis make a price movement forecast. The indicator has a text field for quick navigation to the desired date. Options: Symbol - selection of the symbol that the indicator will display; SymbolPeriod - selection of the period from which the indicator will take data; IndicatorColor - indicator color; Inverse - true reverses quotes, false - original view; Next are the settings of the te
Buyers of this product also purchase
Introducing the Miraculous Forex Indicator: Unleash the Power of Precision Trading Are you tired of searching for the perfect forex indicator that truly delivers exceptional results across all time frames? Look no further! The Miraculous Forex Indicator has arrived to revolutionize your trading experience and propel your profits to new heights. Built upon a foundation of cutting-edge technology and years of meticulous development, the Miraculous Forex Indicator stands as the pinnacle of str
Currently 20% OFF ! Best Solution for any Newbie or Expert Trader! This dashboard software is working on 28 currency pairs plus one. It is based on 2 of our main indicators (Advanced Currency Strength 28 and Advanced Currency Impulse). It gives a great overview of the entire Forex market plus Gold or 1 indices. It shows Advanced Currency Strength values, currency speed of movement and signals for 28 Forex pairs in all (9) timeframes. Imagine how your trading will improve when you can watch the e
TPSpro RFI Levels
Roman Podpora
5 (13)
A key element in trading is zones or levels from which decisions to buy or sell a trading instrument are made. Despite attempts by major players to conceal their presence in the market, they inevitably leave traces. Our task was to learn how to identify these traces and interpret them correctly. Reversal First Impulse levels (RFI)   -  Version MT5                INSTRUCTIONS                 RUS                 ENG                                       R ecommended to use with an indicator   -  
Atomic Analyst
Issam Kassas
5 (1)
First of all Its worth emphasizing here that this Trading Indicator is   Non-Repainting ,   Non-Redrawing   and   Non-Lagging   Indicator, Which makes it ideal from both manual and robot trading.  The Atomic Analyst  is a PA Price Action Indicator that uses Strength and Momentum of the price to find a better edge in the market. Equipped with Advanced filters which help remove noises and false signals, and Increase Trading Potential. Using Multiple layers of complex Indicators, the Atomic Anal
TrendMaestro
Stefano Frisetti
5 (2)
note: this indicator is for METATRADER4, if you want the version for METATRADER5 this is the link: TRENDMAESTRO recognizes a new TREND in the bud, he never makes mistakes. The certainty of identifying a new TREND is priceless. DESCRIPTION TRENDMAESTRO identifies a new TREND in the bud, this indicator examines the volatility, volumes and momentum to identify the moment in which there is an explosion of one or more of these data and therefore the moment in which prices have strong probability of f
XQ Indicator MetaTrader 4
Marzena Maria Szmit
3 (2)
Step into the realm of Forex trading with confidence and precision using XQ, a cutting-edge Forex indicator designed to elevate your trading game to unprecedented heights. Whether you're a seasoned trader or just stepping into the world of currency exchange,   XQ Forex Indicator   empowers you with the insights and signals needed to make informed trading decisions. The signal conditions are a combination of three indicators, and XQ Forex Indicator only display  medium and long-term trends . The
Introducing ON Trade Waves Patterns Harmonic Elliot Wolfe, an advanced indicator designed to detect various market patterns using both manual and automated methods. Here's how it works: Harmonic Patterns: This indicator can identify harmonic patterns that appear on your chart. These patterns are essential for traders practicing harmonic trading theory, as popularized by Scott Carney's book "Harmonic Trading vol 1&2." Whether you draw them manually or rely on automated detection, ON Trade Waves
TakePropips Donchian Trend Pro
Eric John Pajarillaga Aldana
4.82 (17)
TakePropips Donchian Trend Pro  (MT4) is a powerful and effective tool that automatically detects the direction of the trend using the Donchian Channel and provides you with an entry and exit trading signals! This multi-function indicator includes a trend scanner, trading signals, statistical panel, screener, trading sessions, and alerts history dashboard. It is designed to provide you with trading signals and save you hours analyzing the charts! You can download the user manual and installation
FX Volume
Daniel Stein
4.6 (35)
Visit our all-new   Stein Investments Welcome Page   to get the latest information, updates and trading strategies. FX Volume is the FIRST and ONLY volume indicator that provides a REAL insight into the market sentiment from a broker's point of view. It provides awesome insights into how institutional market participants, like brokers, are positioned in the Forex market, much faster than COT reports. Seeing this information directly on your chart is the real game-changer and breakthrough solut
Cycle Sniper
Elmira Memish
4.41 (34)
NEW YEAR SALE PRICE FOR LIMITED TIME!!! Please contact us after your purchase and we will send you the complimentary indicators to complete the system Cycle Sniper is not a holy grail but when you use it in a system which is explained in the videos, you will feel the difference. If you are not willing to focus on the charts designed with Cycle Sniper and other free tools we provide, we recommend not buying this indicator. We recommend watching the videos about the indiactor and system before pu
Gann Signal
Kirill Borovskii
Gann Signal is a very simple indicator at first glance, but hidden inside is many years of experience in studying W.D.Ganna methods. The indicator gives accurate BUY/SELL signals, without redrawing. The indicator is very easy to use. All you need to do is attach it to your chart and follow its recommendations. The indicator constantly analyzes the market for entry opportunities. When such an opportunity appears, the indicator gives a signal in the form of an arrow. I repeat, all signals are NOT
Ultimate Sniper Dashboard
Hispraise Chinedum Abraham
4.84 (25)
Currently on 10% Discount! Prices may increase in the future! Read description below! Once you purchase, send a message to my inbox for manual and starter kit. Best Entry System for Ultimate Sniper Dashboard: ULTIMATE DYNAMIC LEVELS. (Please Check my products) The Ultimate Sniper Dashboard ONLY works on live markets due to MT4 multicurrency testing limits. Introducing the Ultimate-Sniper Dashboard! Our very best which contains both HA-Sniper, MA-Sniper. and many special modes. The Ultimate S
Gann Swing Structure
Kirill Borovskii
5 (1)
This indicator is based on the mathematics of the great trader W.D. Ganna. With its help, you can easily find strong levels by analyzing swings to find the optimal entry point. The indicator works on all instruments and all timeframes. The indicator is fully manual and has control buttons. All you need to do is press the NEW button, a segment will appear, which you can place on any movement, swing or even 1 candle that you want to analyze. By placing the segment, press the OK button. A grid (th
ON Trade Optuma Astro
Abdullah Alrai
5 (4)
This is an astronomy indicator for the MT4 platform like optuma program that performs a variety of functions. It uses complex algorithms to perform its own calculations, which are so accurate. The indicator has a panel that provides astronomical information such as planets' geo/heliocentric cords, distance of sun/earth, magnitude, elongation, constellation, ecliptic cords, equatorial cords, and horizontal cords depending on  the vertical line that generated by the indicator depend on the time va
Weis Wave with Alert
Trade The Volume Waves Single Member P.C.
4.79 (19)
Rental/Lifetime Package Options and Privileges' * For optimum results the yearly or lifetime package is suggested due to live training and Discord  channel trading with the  creator! Rent Monthly Six Months   Yearly/Lifetime Weis Wave with Speed with Alert+Speed Index x x x Manual  x x x Quick Set up Video x x x Blog x x x Lifetime Updates x x x Setup and Training Material x x Free Rectangle Break Alert Tool      x Discord Access Channel "The SI traders" x 2-hour live methodology traini
Supply and Demand Dashboard PRO
Bernhard Schweigert
4.82 (22)
Currently 20% OFF ! This dashboard is a very powerful piece of software working on multiple symbols and up to 9 timeframes. It is based on our main indicator (Best reviews:   Advanced Supply Demand ). The dashboard gives a great overview. It shows: Filtered Supply and Demand values including zone strength rating, Pips distances to/and within zones, It highlights nested zones, It gives 4 kind of alerts for the chosen symbols in all (9) time-frames. It is highly configurable for your personal
The indicator is designed to work on any trading platform. The program is based on proprietary algorithms and W.D.Ganna's mathematics, allowing you to calculate target levels of price movement based on three points with the highest degree of certainty. It is a great tool for stock trading. The indicator has three buttons: NEW - call up a triangle for calculation. DEL - delete the selected triangle. DELS - completely remove all constructions. The probability of achieving the goals is more than 80
TPA True Price Action indicator reveals the true price action of the market makers through 100% non-repainting signals (except early signals mode) strictly at the close of a candle! TPA shows entries and re-entries, every time the bulls are definitely stronger than the bears and vice versa. Not to confuse with red/green candles. The shift of power gets confirmed at the earliest stage and is ONE exit strategy of several. There are available now two free parts of the TPA User Guide for our custo
Please send me Direct message on MQL5 CHAT after purchasing the Indicator for Training and Installation Support There are some additional files that is important to use with the Indicator . So be sure to contact me after purchasing the Indicator So that I can add you for training and support . If you find any difficulty with installation then send me Direct message here So that I can connect with you via Anydesk or Teamview for the product installation. " Smart Order Block Indicator " to find
The BB Reversal Arrows technical trading system has been developed to predict reverse points for making retail decisions. The current market situation is analyzed by the indicator and structured for several criteria: the expectation of reversal moments, potential turning points, purchase and sale signals. The indicator does not contain excess information, has a visual understandable interface, allowing traders to make reasonable decisions. All arrows appear to close the candle, without redr
The breakout algorithm is a technique based on price, price features, to shape a breakout strategy. The strategy in this indicator will not be redrawn (none-repaint indicator), it is suitable for short or long term traders In the screenshot is the EURUSD pair, these currency pairs, commodities or stocks, it have similar strength *Non-Repainting (not redrawn) *For Metatrader4 Only *Great For Scalping *Great For Swing Trading *Arrow Entry, Green is Long, Red is Short *Works On Any Timeframe *Work
Indicator : RealValueIndicator Description : RealValueIndicator is a powerful tool designed specifically for trading on the EURUSD pair. This indicator analyzes all EUR and USD pairs, calculates their real currency strength values, and displays them as a single realistic value to give you a head start on price. This indicator will tell you moves before they happen if you use it right. RealValueIndicator allows you to get a quick and accurate overview of the EURUSD currency pair tops and bottoms,
IA Trendx3 PRO
Marco Aurelio Santos Costa
What if God Created a Trade System? No miracles... Just see how mathematics can be effective in the market. We managed to combine technical analysis / price action into indicators, creating the best setup for trading, be it in Forex, Indices, or stocks. It took us 2 years to create something that really works, and now it's time for you to discover it. TrendX3 is a revolution in trend analysis. Based on advanced algorithms and real-time data, it provides valuable insights so that you can make inf
Volatility Trend System - a trading system that gives signals for entries. The volatility system gives linear and point signals in the direction of the trend, as well as signals to exit it, without redrawing and delays. The trend indicator monitors the direction of the medium-term trend, shows the direction and its change. The signal indicator is based on changes in volatility and shows market entries. The indicator is equipped with several types of alerts. Can be applied to various trading
Introduction Excessive Momentum Indicator is the momentum indicator to measure the excessive momentum directly from raw price series. Hence, this is an extended price action and pattern trading. Excessive Momentum Indicator was originally developed by Young Ho Seo. This indicator demonstrates the concept of Equilibrium Fractal Wave and Practical Application at the same time. Excessive Momentum detects the market anomaly. Excessive momentum will give us a lot of clue about potential reversal and
System Trend Pro
Aleksandr Makarov
System Trend Pro - This is the best trend trading indicator!!! The indicator no repaint!!!   The indicator has   MTF   mode, which adds confidence to trading on the trend (   no repaint   ). How to trade? Everything is very simple, we wait for the first signal (big arrow), then wait for the second signal (small arrow) and enter the market in the direction of the arrow. (See screens 1 and 2.) Exit on the opposite signal or take 20-30 pips, close half of it, and keep the rest until the oppo
Full Forex Market View Dashboard
Opengates Success International
5 (2)
FULL FOREX MARKET VIEW Dashboard Indicator This is a custom indicator created to give Traders a full view of what is going on in the market. It uses a real time data to access the market and display every bit of information needed to make successful trading. INSTALLATION : Before attaching this Indicator to your window chart, go to your MT4's Market Watch panel and HIDE all the Currency pairs you don't need or trade and leave the rest there. The reason is that FFMV Dashboard will DISPLAY ALL the
A. What is A2SR ?   * It's a leading technical indicator (no repaint, no lagging). -- Guidance : -- at   https://www.mql5.com/en/blogs/post/734748/page4#comment_16532516 -- and  https://www.mql5.com/en/users/yohana/blog A2SR has a special technique in determining the levels of Support ( demand ) and Resistance ( supply ) . Unlike the ordinary way that we seen on the net, A2SR has a original concept in determining actual SR levels. The original technique was not taken from the internet,
SMCpro VIP MT4  Original Price  $620   ---  Currently Price 20% OFF ( for unlimited use )   BONUS  AUX VIP Club 2024 : Include  EA Airbag  and  Load Data History  to enhance the performance of this tool to its maximum potential  Click Here to Download Files   ( for users only )   Hello World! Introducing.. SMCpro VIP tool and Indicator for MetaTrader 4, designed to revolutionize your trading experience with the ICT Smart Money Concept. This system is meticulously crafted to empower trad
30% OFF NOW! PRICE INCREASING MARCH 30TH! Introducing GoldenGate Entries: A Cutting-Edge Trading Solution!  Discover a revolutionary approach to trading with GoldenGate Entries (GGE), an advanced indicator designed to elevate your trading experience. GGE provides a comprehensive set of features to empower users with precision and confidence in their trading decisions. No re-painting! Pairs:   Any (FX - Commodities - Equities - Stocks - Crypto) TimeFrames:   15m up to H1 Key Features: Buy
More from author
The indicator displays 4 current levels between which the price is located. The levels are calculated based on the range of the previous day. The number and value of levels is arbitrary and expressed as a percentage. The position of the levels is calculated from the minimum of the previous day (an example can be found in the description of the parameters). It is advisable to place the levels in the settings line in order, nevertheless, the indicator will sort them by itself and if levels are fou
Displays the readings of the Moving Average indicator on the older timeframe. Wishes for other types of Moving Average are accepted (however, the possibility of implementation depends on the type of algorithm). It doesn't make sense to apply it to the current timeframe - there are free indicators for this. Does not redraw the readings starting from the first bar. It is very important to have and match the history of the timeframes on which it is installed and set in the settings. A simple built-
The next version of the indicator based on the range of previous day. Considers a difference of time zones. By default works the time zone of the broker. Can work on time zones: Greenwich, broker or local.  It can be applied only on timeframe from H1 below. If the day range of new day is lower minimum, then minimum is transferred from ranges of previous day symmetrically concerning the line of closing previous day (optionally, look Input parameters ). Screenshot 1: operation of the
In indicators the positive scale often unreasonably is accepted though in fact they are the symmetric. Such property has also standard RSI. The presented indicator works in the scale, symmetric concerning zero, but at the same time completely repeats an original form. In this indicator important levels 20 and -20. It is very convenient at its use in automatic trade as application of one threshold by optimization excludes overoptimization. Besides, the algorithm of calculation of the indi
The indicator is constructed on the basis of ZigZagHistory ( https://www.mql5.com/ru/market/product/37376 ). At the same time calculated on the current timeframe and on the specified high. The history of the high timeframe is displayed by hollow squares. The history of a current timeframe is displayed by rhombuses. Colors and the sizes of signs can be adjusted. Attention!  The Price noise parameter - has significant effect on formation of extrema. Parameters: High TimeFrame (HTF) - the high ti
This indicator is based on the previous option ( https://www.mql5.com/ru/market/product/37376 ) and includes all completions at the time of creation. Availability of additional data allows to understand more deeply the principle of work as this indicator and original. Points on extrema of bars show history of a portrayal of extrema as before. Levels of a reverse show as far as the price for formation of a new shoulder has to deviate. The Price noise parameter has a special impact (the name "devi
ZigZag Minimal
Aleksandr Martynov
The indicator is made on the basis of the algorithm put in the ZigZag History indicator ( https://www.mql5.com/ru/market/product/37376/ ). In the real option there are no additional buffers and an opportunity to trace work history. It causes the minimum involvement of random access memory, however productivity practically does not improve. Attention!  The Price noise parameter - has significant effect on formation of extrema. Parameters: Depth  - is depth of search of a local extremum in bar
The RSI Symmetric indicator approximated by function of the known Buzzer indicator. Display for the high timeframe is provided. 2 types of signals are of interest: 1. Position of the RSI line concerning the approximated line 2. The trend direction of the approximated line  Indicator parameters: RSI TimeF rame - the worker  timeframe (it has to be equal or more than current); RSI Period - no comments; Buzzer Period is the period of approximation of the RSI Symmetric indicator; B
Индикатор отображает 4 текущих уровня между, которыми находится цена. Уровни вычисляются на основе диапазона предыдущей недели. Количество и значение уровней произвольное   и выражается в процентах . Положение уровней отсчитывается от минимума предыдущего дня (пример можно посмотреть в описании параметров). Целесообразно размещать уровни в строке настроек по порядку, тем не менее индикатор сам их отсортирует и если обнаружатся уровни отстоящие менее чем на 1% выдаст ошибку. Индикатор работает н
ZigZag Level
Aleksandr Martynov
One of the disadvantages of the ZigZag indicator when working with advisers is the need to find the latest extremes. For this purpose, various algorithms of history analysis in indicator buffers are used. However, the indicator itself knows these values and can therefore display them. To this target, the ZigZag Minimum indicator ( https://www.mql5.com/ru/market/product/37975 ) has been refined. The zero buffer stores the value of the last maximum. The first buffer stores the value of the last m
ZigZag Mini Extra
Aleksandr Martynov
Not a logical continuation of the ZigZag indicator series is an indicator cut to an absolute minimum. An important property of this indicator is that it will never redraw the value of a completed bar. Based on previous indicator algorithms, e.g. ( https://www.mql5.com/ru/market/product/37975 ). Parameters: Depth  - is depth of search of a local extremum in bars; On minute calc  - is switching ON/OFF of calculation on minute bar (it is switched off - calculation on each tic).
The proposed indicator is based on the ZigZag Mini Extra indicator ( https://www.mql5.com/ru/market/product/42632 ). Unlike the prototype can be built at the price of Close or High-Low with the established timeframe. The prices of the current timeframe will be used when calculating the indicator on the highest timeframes at Close price, . Indicator parameters: ZigZag TimeFrame = PERIOD_CURRENT - operating time frame (must be equal or more than current timeframe); Depth = 12 - depth of
The ZigZag indicator is based on the RSI indicator. This makes it possible to identify significant extremes. Different calculation options are provided: - RSI indicator at Close or Hi-Low prices (1 and 2 buffers respectively in OnClose mode - the first buffer, in Hi-Low mode the first buffer at High price, the second buffer at Low); - ZigZag indicator by period (standard) or minimal deviation. (The ZigZag indicator values are always in zero buffer.) If you use a higher timeframe, make s
Trend Ranger
Aleksandr Martynov
The indicator does not use predictions. It merely shows what range the price is in. However, it does a good job with chart markings and mapping current trade preferences. It can act as an independent tool of medium and long-term urgent trade, and together with oscillators it is possible to build a good scalper system. Important! The signal is 0 bar - does not repaint! Indicator parameters: Zone Range (Pips) - size of zone in pips excluding the number of characters; Line or Histogram Wid
Based on the course records of Yuri Antonov (academyfx.ru) YouTube Channel: https://www.youtube.com/playlist? list=PLj3wALUOwoZ9kdacS09K9bjD1zulR _ HJh The indicator is intended for people who know the strategy but find it difficult to mark the graph.  Approaches the new Intensive MD system. The default parameters are set as of mid-2019. For a 5-digit EURUSD account! You can work on the 4-character after the parameters are recalculated. The current parameters can be found on the autho
Indicator of fractals with adjustable indents. Designed according to an original simplified algorithm for use in EA. The main ones in the indicator are lines showing the levels of the current fractals, which allows you to read the values ​ ​ of the last fractal in one operation. It works on a closed bar, so it does not redraw and does not load the terminal with calculations. It should be understood that the indicator is late with the detection of the fractal by the number of bars on the r
Trend Ranger XO
Aleksandr Martynov
Индикатор отображает на графике другой популярный индикатор XO, представленный на рисунке в подвале. Важно! Сигнальным является 0 бар - не перекрашивается!  Параметры индикатора: Zone Range (Pips)   - размер зоны в пипсах без учета количества знаков; Line or Histogram Width   - ширина линий или гистограммы;    Zone Draw Type  - способ отрисовки зон: в виде гистограммы или линий на графике; Up Zone Color   -  цвет зоны BUY; Down Zone Color   - цвет зоны SELL; AlertsMessage   - включение вывода со
Сканер Heiken Ashi на четырех таймфреймах. Индикатор не рисует и не подсматривает историю. Модифицированный расчет повышает чувствительность! Возможно отключить модифицированный расчет для каждого таймфрейма отдельно, а также отключить анализ 4 таймфрейма. В нулевом (скрытом) буфере хранится информация о совпадении трендов на всех рабочих ТФ. Эта опция упрощает анализ и чтение из советников. Требователен к истории. Наиболее простое отсутствие данных по старшим ТФ проверяется при загрузке. Осно
Indicator from the Real Non RePaint MultiTimeFrame (Real NRP MTF)  series. Specially designed to display the RSI standard indicator reading from the Senior TimeFrame (TF) to the Junior. The indicator differs from the standard scale - symmetrical relative to 0. Add 50.0 to the readings to get the standard values. Does not look into the future for history at the senior TF. DOES NOT DIFFER from the standard real-time indicator readings (including bias), but shows the actual indicator readings on th
Indicator from the Real Non RePaint MultiTimeFrame   (Real NRP MTF)  series. The indicator is based on the standard one. Does not redraw in any mode: the last closed candle is a rock. Does not look into the future for history at the senior TF. The formula for sensitivity enhancement has been changed (disabled in settings). It works on the current TF or older ones with the display on the current one. The last closed Heiken Ashi candle of the current timeframe before the opening of the new senior
Indicator from the  Real Non RePaint MultiTimeFrame  (Real NRP MTF) series. Specially designed to display the standard Stohastic indicator from the senior timeframe (TF) to the junior. The indicator differs from the standard scale - symmetrical relative to 0. Add 50.0 to the readings to get the standard values. Does not look into the future for history at the senior TF. DOES NOT DIFFER from the real-time standard indicator (offset-based), but shows the actual indicator counts on the history
Индикатор содержит 3 RSI с возможностью выбора рабочего таймфрейма, периода и параметра сглаживания каждого. Не перерисовывает начиная с 1 бара. При задании параметра сглаживания большего 1 показания будут обработаны специальным образом, для исключения мелких колебаний. Возможно использовать в качестве готовой торговой системы, где показания старших ТФ определяют тренд, а младший используется для поиска точек входа, в качестве примера может служить система Дмитрия Брылякова  https://www.infoclub
Dynamic Fibo Level
Aleksandr Martynov
Индикатор отображает динамические разворотные уровни по шкале Фибоначи. Основан на индикаторе ЗИГ-ЗАГ, который управляется периодом и минимальной глубиной для переключения тренда. Если указать глубину переключения равной 0, то она не будет участвовать в расчетах индикатора. Используется неперерисовывающий сформированные вершины индикатор - возможны несоответствия экстремумов со стандартным индикатором ЗИГ-ЗАГ. Расчитывается на закрытом баре, действие зоны отображается для текущего бара. Основные
Filter:
No reviews
Reply to review
Version 1.6 2019.11.13
Восстановлен оригинальный порядок определения вершин. Усовершенствован алгоритм работы на каждом тике.
Version 1.5 2019.11.07
Исправлен алгоритм для работы с малыми периодами. Приоритет отдается смене тренда.
Возможны отличия от оригинального индикатора.
Version 1.4 2019.04.22
Final version. Initiative completions are complete.
Version 1.3 2019.04.20
Parameters are entered:
Price noise - it is equivalent to deviation in the original indicator. Has significant effect.
On minute calc is switching ON/OFF of calculation on minute bar (it is switched off - calculation on each tic).
Version 1.2 2019.04.05
Drawing on the current bar is corrected
Version 1.1 2019.04.04
Names of buffers of history are added