PD Universal Oscillator
- Indicators
- Denis Povtorenko
- Version: 1.1
- Updated: 12 November 2018
- Activations: 5
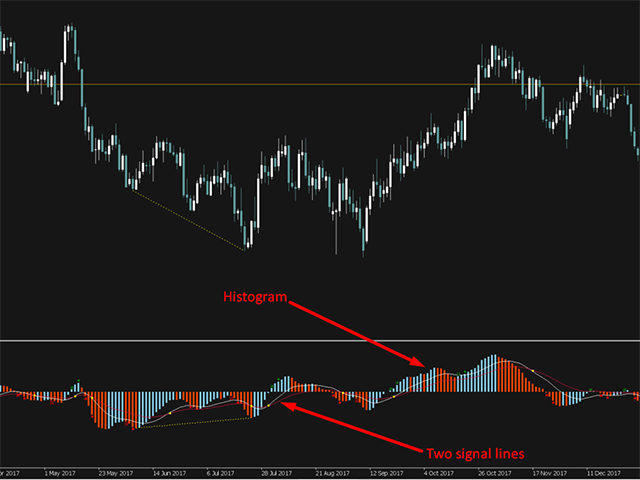
Технический индикатор Universal Oscillator является комбинацией торговых сигналов самых популярных и широко используемых осцилляторов. Индикатор представлен гистограммами, а также линиями fast и slow MA, что позволяет расширить список получаемых торговых рекомендаций и работать как по тренду, так и в боковом движении рынка. Таким образом, гистограммы позволяют определить момент пробоя ценовых значений и движение в новой фазе рынка, а линии указывают на зоны перекупленности и перепроданности. Основная идея Universal Oscillator исходит от индикаторов AO и MACD.
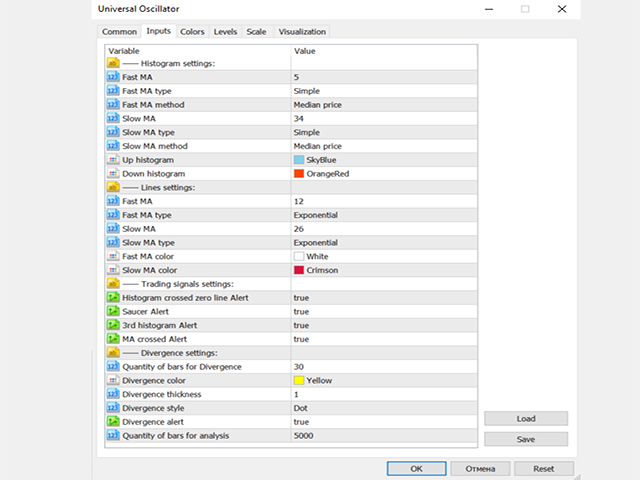
Универсальность индикатора заключается в том, что можно настраивать его гистограммы и линии на тех параметрах, которые вас интересуют. Тем самым вы формируете торговые сигналы (которые я указал ниже) исходя из своих торговых предпочтений. Universal Oscillator даёт возможность отслеживать дивергенцию и пересечение линий по интересующих вас условиям.
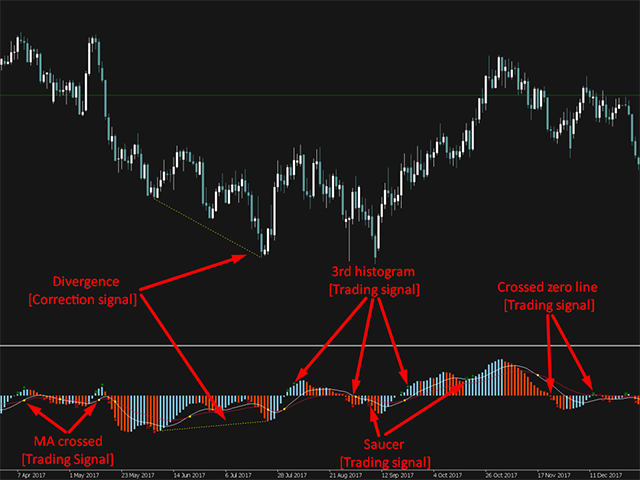
Торговые сигналы индикатора:
1. Crossed zero line: данный торговый сигнал возникает в момент пробития гистограм индикатора нулевой линии. Это свидетельствует о пересечении Fast и Slow МА, по которым строятся гистограммы. Пересечение свидетельствует о смене тренда на рынке.
2. 3rd histogram: отображает направленное движение в восходящей или нисходящей фазе рынка. То есть отображает три последовательных восходящих/нисходящих гистограммы для восходящего/нисходящего направления индикатора. Три направленные гистограммы отображают расширение значений между МА, что дополнительно указывает на силу тренда. Таким образом, сигнал к покупкам возникает только тогда, когда 3 подряд гистограммы демонстрируют восходящую динамику и находятся выше нулевой линии (для продаж зеркальная ситуация). Это своего рода подтверждающий фильтр предыдущего сигнала.
3. Saucer: классический торговый сигнал OA. Отображает смену направления гистограмм и тем самым подтверждают окончание краткосрочной коррекционной фазы. Является сигналом для дополнительного входа или коррекции текущих целевых уровней.
4. MA crossed: отображает пересечение двух вспомогательных линий. В момент пересечения отображает сигналы перекупленности и перепроданности. Если сигнал возникает на максимуме/минимуме гистограм, то это сильный сигнал к началу коррекционного движения. Чем дальше возникает пересечение от нулевой линии - тем сильнее коррекционный сигнал.
5. Divergence: классический коррекционный торговый сигнал. Указывает на расхождение/схождение котировок финансового актива с гистограммами индикатора Universal Oscillator. За счёт того, что вы сами можете настроить параметры индикатора, можете увидеть наличие дивергенции по разным значениям гистограмм. Важно: дивергенция определяется по факту и рисуется на локальных минимумах/максимумах свечи и гистограмм. Дивергенция не перерисовывается и учитывает только движение выше нулевой линии. То есть расхождение/схождение котировок должно образовываться в одной рыночной фазе.
Способы применения:
Индикатор является вспомогательным инструментом для анализа и нуждается в дополнительных трендовых инструментах, если вы работаете на пробой. Если же торговать на коррекциях, то данный индикатор отлично справляется с этой задачей. Сигнал «Crossed zero line» является сигналом смены тренда, а «3rd histogram» подтверждает его. «Saucer» необходимо использовать на добавление позиций или фиксации ранее открытых сделок. Линии Universal Oscillator отображают коррекции внутри тренда. Если быстрая МА пересекла медленную сверху вниз и гистограммы + линии находиться выше линии баланса, то это сигнал для открытия позиции против текущего растущего тренда (сигнал на продажу является зеркальной ситуацией).
Совет:
Обращайте внимание на импульс по гистограммам. Если гистограммы Universal Oscillator в текущем моменте значительно откланяются от предыдущего диапазона, то это свидетельствует о сильном направленном движении, против которого торговать не стоит. Но если котировки демонстрируют новый максимум / минимум, а гистограммы UO находиться в среднем диапазоне, то стоит ожидать прорыва в сторону движения, ведь котировки имеют запас хода определяющийся по разнице МА.