Renko Graph
- Indicators
- Iurii Tokman
- Version: 1.0
- Activations: 5
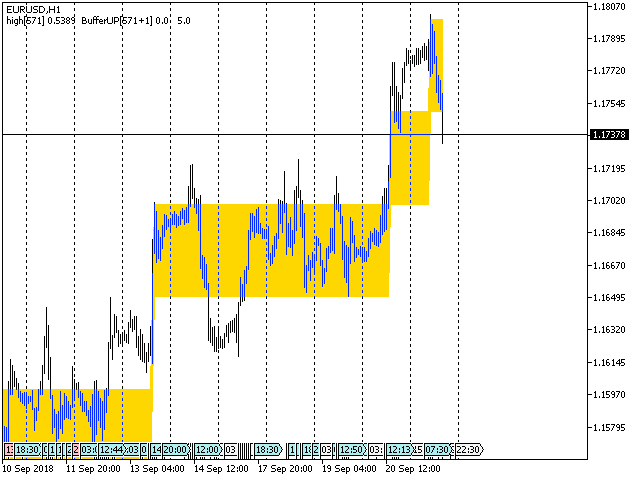
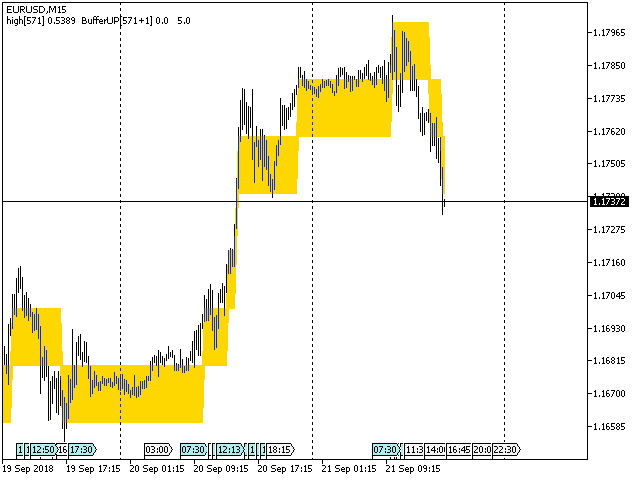
Renko graph
The Renko indicator in the main chart window at the location with the current price.
The indicator displays price changes in the form of rectangles ("bricks") against the background of a regular quote chart. The upward movement of the price, by the number of points specified in the settings, is marked by adding above the previous next rectangle, and downward movement - below the previous rectangle.
The indicator is designed to visually identify the main trend. Used to identify key support and resistance levels as it averages the underlying trend. This view does not take into account small price fluctuations ("noise"), which allows you to focus on the really significant movements.
A new indicator value above or below is plotted only if the price movement has exceeded the specified threshold level. The size of which is set in the settings and is always the same. For example, if the base size is 10 points, and the price has risen by 20, then 2 indicator values will be drawn up.
The advantage of the indicator is that any of the bricks can show the duration of the time of its formation. If the price fluctuated within a range, did not grow and did not fall by the value of the threshold, then the brick will remain without price changes all this time.
Description of indicator settings
- Cell - threshold level or height of rectangles (bricks), in points (for example, 10 points).
- RenkoPrice - based on which prices the indicator is built, High_Low - maximum and minimum price values, _Close - based on closing prices.
If the indicator overlaps the price chart, check the Chart on foreground value in the chart settings.