Acceleration Fractals
- Indicators
- Vladimir Tkach
- Version: 1.0
- Activations: 20
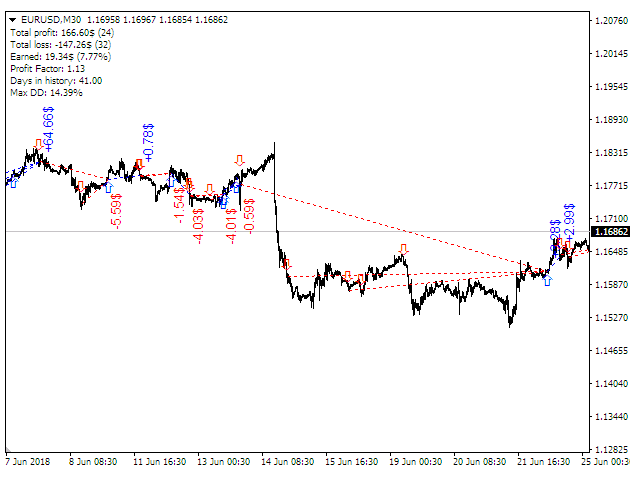
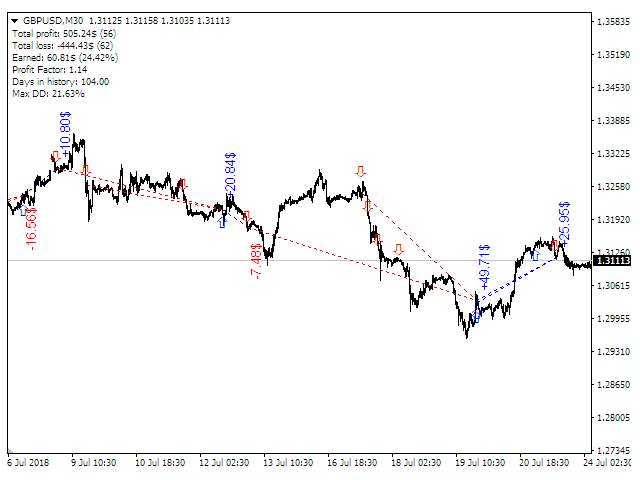
The indicator analyzes the change in the minimum and maximum prices of the previous bars fixing the entrance of the big players. If the change (delta) increases, a signal is displayed on the graph in the form of an arrow. At the same time, virtual trade on history is carried out. In case of a repeat of the signal, the positions are increased (refilling). Thus the lot of positions can differ. The results of virtual trading in the form of losses / losses, profitability, drawdown and transaction lines are displayed on the price chart and in the comment field.
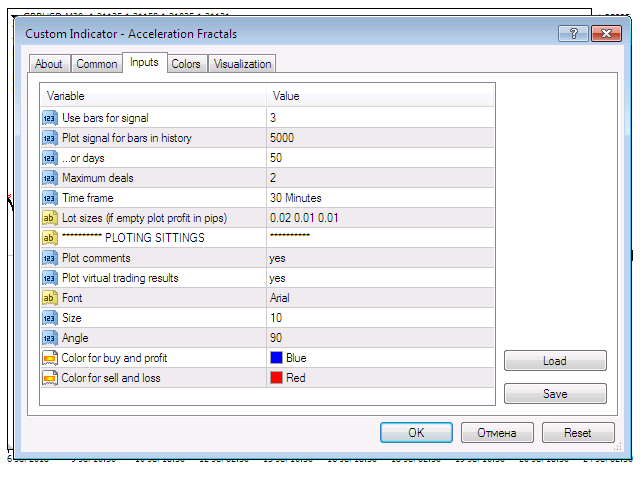
Indicator Parameters
Use bars for signal - the number of signal bars;
Plot signal for bars in history - show signals and results of virtual trade on this story;
... or days - the length of the history in days;
Maximum deals - the maximum number of unidirectional transactions when the signal repeats (refills);
Time frame - used timeframe bars;
Lot sizes (if empty plot profit in pips) - the size of the lot of transactions in virtual trading. Through the gap, you can specify the amount of topping positions. If empty, the results of the virtual trade will be presented in points;
Plot comments - show the results of virtual trading in the comments;
Plot virtual trading results - show the results of virtual trading on the chart in the form of lines and results of transactions;
Font - the font of the output results is a bargain;
Size - the font size of the displayed transaction results;
Angle - the angle of the results of transactions;
Color for buy and profit - color for lines of transactions for purchase and positive results of transactions;
Color for sell and loss - color for lines of transactions for sale and negative results of transactions.