• Overview
  • Reviews (11)
  • Comments (23)
  • What's new

Multi oscillator divergence MT5

4.67

I recommend you to read the product's blog (manual) from start to end so that it is clear from the beginning what the indicator offers.

The indicator identifies when a divergence occurs between price and an oscillator/indicator. It identifies both regular and hidden divergences. It has a RSI, Bollinger Bands and ATR filter options which makes it possible to filter out only the strongest setups. The indicator also offers options to wait for an Engulfing formation, Donchian channel breakout, Hull moving average color alignment or for price to cross a moving average (see screenshot #3) to confirm the divergence before signaling the trade opportunity. Combined with your own rules and techniques, this indicator will allow you to create (or enhance) your own powerful system.

Features

  • At the end of the product's blog you will be able to download the source code of an example Expert Advisor (EA) which is using the iCustom() function to retrieve trade signals from the indicator. Even though the EA is fully functional, the main purpose is to use the code and paste it into your own developed EA. Given my limited time I will not be able to provide with any programming support though. My apologies
  • Can detect divergences for the following oscillators/indicators: MACD (Metatrader native), OsMA, Stochastics, RSI, CCI, RVI, Awesome, ADX, Composite index, ATR, OBV, MFI, Momentum, Accumulation/Distribution and Accelerator. Only one oscillator/indicator can be selected.
  • Draws solid lines for regular/classical (potential reversal) divergences and dashed lines for hidden (trend continuation) divergences. The lines are drawn on the chart as well as in the indicator window.
  • Sends an alert when a divergence or a breakout/cross has been detected. All Metatrader native alert types are supported.

Input parameters

Please find the description and explanation of the input parameters here.


Reviews 11
Johan Julien Aubry
855
Johan Julien Aubry 2023.02.12 11:38 
 

Powerfull indicator, very cheap and with a lot of possibilities to customise settings. Can be used for entry points or to confirm other entries. Well documented and EA compatible. Jan is really helpful and very reactive. I totally recommend this product!

Edensgarden
20
Edensgarden 2022.01.17 14:27 
 

It's a very good divergence indicator; it does what is promised by Jan. I have incorporated this tool into my trading habits. Also great support from Jan.

kamz1419
149
kamz1419 2021.07.16 18:14 
 

Great product, works as exactly as required and the alerts are timely and you change and choose from a range of settings. The support Jan offers os excellent and he replies very fast with the required solutions. Thanks

Recommended products
Atomic Analyst MT5
Issam Kassas
3.64 (11)
First of all Its worth emphasizing here that this Trading Indicator is   Non-Repainting ,   Non-Redrawing   and   Non-Lagging   Indicator, Which makes it ideal from both manual and robot trading.  The Atomic Analyst  is a PA Price Action Indicator that uses Strength and Momentum of the price to find a better edge in the market. Equipped with an AI filter which help remove noises and false signals, and Increase Trading Potential. Using Multiple layers of complex Indicators, the Atomic Analyst
This indicator scans for you up to 15 trading instruments and up to 21 time frames for occurrences of the high probability reversal patterns: Double Tops/Bottoms with fake breakouts . What this indicator detects: This indicator detects a special form of Double Tops and Bottoms, so called Double Tops/Bottoms with fake breakouts . For double tops with fake breakouts the highest price of the right shoulder must be higher than the left shoulder. For double bottoms with fake breakouts the lowest pric
The  Basic Candlestick Patterns  is a Multi-Symbol and Multi-Timeframe scanner for identifying candlestick patterns. it displays your chosen patterns on the chart and helps you make trade decisions. The indicator has simple settings for coloring and alerts. You can also activate or deactivate the desired patterns, symbols and timeframes. Bullish Patterns Hammer Inverse hammer Bullish engulfing Morning star Three white soldiers Bearish Patterns Hanging man Shooting star Bearish engulfing Ev
Trend Side - a technical indicator for determining the trend. It is a set of several full-fledged trading strategies. The indicator uses an advanced trend filtering system, has a statistical panel, calculates entry and exit levels, and calculates the dynamic Trailing Stop level. Suitable for any type of symbols, never redraws its signals and results. A comprehensive tool for professional trend trading. The set of the Trend Side indicator also includes Andrews Trend Scanner - a multi-currency
Orbit Rage Final 2
BILLY ARANDUQUE ABCEDE
Note : i only sell this EA on MQL5, any other sellers is fake. Orbit Rage Final, a cutting-edge trading strategy meticulously designed around the bull/bear candle approach and divergence analysis. This powerful tool is engineered to empower you to shape the life you desire. To embark on this transformative journey, simply download and seamlessly integrate it into your MetaTrader 4 platform by placing it in the experts advisors folder. Orbit Rage Final revolutionizes trading by offering a risk-f
KT Renko Patterns MT5
KEENBASE SOFTWARE SOLUTIONS
KT Renko Patterns scans the Renko chart brick by brick to find some famous chart patterns that are frequently used by traders across the various financial markets. Compared to the time-based charts, patterns based trading is easier and more evident on Renko charts due to their uncluttered appearance. KT Renko Patterns features multiple Renko patterns, and many of these patterns are extensively explained in the book titled Profitable Trading with Renko Charts by Prashant Shah. A 100% automate
Elevate Your Trading Experience with Wamek Trend Consult!   Unlock the power of precise market entry with our advanced trading tool designed to identify early and continuation trends. Wamek Trend Consult empowers traders to enter the market at the perfect moment, utilizing potent filters that reduce fake signals, enhancing trade accuracy, and ultimately increasing profitability.   Key Features: 1. Accurate Trend Identification: The Trend Consult indicator employs advanced algorithms and unparall
Automated Trendlines MT5
Georgios Kalomoiropoulos
Trendlines  are the most essential tool of technical analysis in forex trading.  Unfortunately, most  traders don’t draw them correctly. Automated Trendlines indicator is a professional tool for serious traders that help you visualize the trending movement of the markets . AMAZING OFFER --> Activations from 5 to 20 for "MTF Supply Demand Zones" and "Automated Trendlines" There are two types of Trendlines Bullish Trendlines and Bearish Trendlines. In the uptrend, Forex trend line is drawn th
Wave Trend MT5
Diego Arribas Lopez
MT4 Version Wave Trend MT5 Wave Trend is an oscillator, which helps identifing in a extremely accurate manner market reversals. The Oscillator being obove the overbought level and a cross down of the fast into the slow MA usually indicates a good SELL signal. If the oscillators is below the oversold level and the fast MA crosses over the slower MA usually highlights a good BUY signal. The Wave Trend indicator can be also used when divergences appear against the price, indicating the current move
This AJiBoLang indicator is suitable for all cycles of the signal, very suitable for short-term signals, the signal accuracy is good. Just look at the arrows on the chart and make a single order. The green arrow is the Buy single and the red arrow is the Sell single. After making the Buy order, if the yellow line goes up to the upper level and travels a certain distance, then you can sell the Buy order. After making the Sell single, if the yellow line goes to the lower level and travels a
Liquidity Oscillator
Paolo Scopazzo
5 (1)
A powerful oscillator that provide Buy and Sell signals by calculating the investor liquidity. The more liquidity the more buy possibilities. The less liquidity the more sell possibilities. Please download the demo and run a backtest! HOW IT WORKS: The oscillator will put buy and sell arrow on the chart in runtime only . Top value is 95 to 100 -> Investors are ready to buy and you should follow. Bottom value is 5 to 0 -> Investors are ready to sell and you should follow. Alert + sound will app
How to use Pair Trading Station Pair Trading Station is recommended for H1 time frame and you can use it for any currency pairs. To generate buy and sell signal, follow few steps below to apply Pair Trading Station to your MetaTrader terminal. When you load Pair Trading Station on your chart, Pair Trading station will assess available historical data in your MetaTrader platforms for each currency pair. On your chart, the amount of historical data available will be displayed for each currency pai
KT Momentum Arrows MT5
KEENBASE SOFTWARE SOLUTIONS
5 (3)
KT Momentum Arrows Indicator is based on a momentary breakout which is calculated using the bands deviation and emerging volatility in a certain direction. A buy signal is generated when the price closes above the upper band and a sell signal is generated when the price closes below the lower band. A magnitude coefficient is used as the input which affects the band deviation and volatility at the same time. The coefficient value should be carefully selected and analyzed based on the instrument a
Fib Auto Trendline
Nhlanhla Brilliant Mashavha
INTRODUCTION The  Fib Autotrendline   is a basic tool that analysts use to find out when a security's trend is reversing. By determining the   support and resistance areas , it helps to identify significant changes in price while filtering out short-term fluctuations, thus eliminating the noise of everyday market conditions. It is an excellent tool for any trader who follows indicators that use   swing highs  and   swing lows . How to Use the fib Auto Trendline Indicator The Fib Auto Trendline
PipFinite Exit EDGE MT5
Karlo Wilson Vendiola
4.89 (35)
Did You Have A Profitable Trade But Suddenly Reversed? In a solid strategy, exiting a trade is equally important as entering. Exit EDGE helps maximize your current trade profit and avoid turning winning trades to losers. Never Miss An Exit Signal Again Monitor all pairs and timeframes in just 1 chart www.mql5.com/en/blogs/post/726558 How To Trade You can close your open trades as soon as you receive a signal Close your Buy orders if you receive an Exit Buy Signal. Close your Sell orde
Golden section price action indicator - is a trend-scalping complete system with enter and exit points. Indicator is based on most powerfull price action japan patterns that are filtered by volume, volatility, market phase. Pattern is not a simple combinations of candles. Patterns must have "weight" to move market in right direction. "Weight" - is the summary of pattern's volume, the size of pattern candles according to last average volatility and ofcourse pattern must appear in correct market p
Inventory Retracement Trade it is designed based on one of the most popular tradingview indicator.  This is mostly combined with other popurlar trend indicator to confirm the strength of the movement. Definition Inventory Retracement Trade is quickly becoming one of the most popular ways to identify where short-term counter trend institutional inventory has subsided and when it’s time to re-enter into a trade’s original trend direction.
Sensey
Yaroslav Varankin
Sensey Candlestick Pattern Recognition Indicator Sensey is an advanced tool capable of accurately identifying candlestick patterns. Not only does it recognize patterns, but it also detects price highs and lows within a specified time frame. Sensey operates seamlessly across multiple timeframes and is compatible with all currency pairs, futures, and commodities. Unlike some indicators, Sensey does not repaint historical data, ensuring reliable analysis even in cryptocurrency markets. You can wit
This indicator will show you the TP and SL Values (in that currency) that you already set  for every orders on the charts  ( closed to the transaction/order line)  that will help you a lot to estimated your profit and loss for every order.    And it also show you the PIPs values too.  the shown format  is      " Currency Values of our Profit or Loss /  PIPs values ".    The TP Value will be shown in Green Color and  the SL Value  will be shown in Red Color.  For any question or more information,
Noize Absorption Index - is the manual trading system that measures the difference of pressure between bears forces and bulls forces. Green line - is a noize free index that showing curent situation. Zero value of index shows totally choppy/flat market.Values above zero level shows how powerfull bullish wave is and values below zero measures bearish forces.Up arrow appears on bearish market when it's ready to reverse, dn arrow appears on weak bullish market, as a result of reverse expectation.
The Trend Catcher: The Trend Catcher Strategy with Alert Indicator is a versatile technical analysis tool that aids traders in identifying market trends and potential entry and exit points. It features a dynamic Trend Catcher Strategy , adapting to market conditions for a clear visual representation of trend direction. Traders can customize parameters to align with their preferences and risk tolerance. The indicator assists in trend identification, signals potential reversals, serves as a trail
FREE
Candle Pattern Finder MT5
Pavel Zamoshnikov
4.33 (6)
This indicator searches for candlestick patterns. Its operation principle is based on Candlestick Charting Explained: Timeless Techniques for Trading Stocks and Futures by Gregory L. Morris. If a pattern is detected, the indicator displays a message at a bar closure. If you trade using the MetaTrader 4 terminal, then you can download the full analogue of the " Candle Pattern Finder for MT4 " indicator It recognizes the following patterns: Bullish/Bearish (possible settings in brackets) : Hamme
This is the famous Sunflower indicator for Metatrader5. This indicator marks possible tops and bottoms on price charts. The indicator identifies tops and bottoms in the asset's price history, keep in mind that the current sunflower of the last candle repaints, as it is not possible to identify a top until the market reverses and it is also not possible to identify a bottom without the market stop falling and start rising. If you are looking for a professional programmer for Metatrader5, please
DYJ SuperTrendWave is a highly accurate peak and trough trading system. This indicator looks for the highest and lowest points of candles as entering and leaving the market. The entrance price is near the highest or lowest point. The notification type of signal has been added to the dyj supertrend. When a multi-space signal is generated, The following types of notification signals are available:  Alert  mailSend, MobilePush. Input InpSignalPeriod   =  10; BarDistance       =  24; InpIsAlert 
Indicator and Expert Adviser  EA Available in the comments section of this product. Download with Indicator must have indicator installed for EA to work. Mt5 indicator alerts for bollinger band and envelope extremes occurring at the same time. Buy signal alerts occur when A bullish candle has formed below both the lower bollinger band and the lower envelope  Bar must open and close below both these indicators. Sell signal occur when A bear bar is formed above the upper bollinger band and upp
Oscillator trading signals - это динамический индикатор, определяющий состояние к продолжению тенденции роста или падению цены торгового инструмента и отсечению зон с нежелательной торговлей. Индикатор состоит из 2 линий осцилляторов. Медленная и быстрая сигнальная линия.  Шкала отображения перевернутая. Зоны вблизи 0 свидетельствуют о тенденции роста цены валютной пары. Зоны -100 свидетельствуют о падении цены валютной пары. На основном графике в виде стрелок отображается потенциально выгодные
Dot reversal
Vitalii Zakharuk
The Dot reversal indicator was created on the basis of the original indicators of the search for extremes, the indicator is well suited for detecting a reversal or a large sharp jerk to one side, thanks to it you will know when this will happen, it will notify you with the appearance of a blue point for buying red for selling It uses in its basis the process of identifying the rate of change in price growth and allows you to find points of entry and exit from the market. a fundamental techn
Premium level is a unique indicator with more than 80% accuracy of correct predictions! This indicator has been tested for more than two months by the best Trading Specialists! The author's indicator you will not find anywhere else! From the screenshots you can see for yourself the accuracy of this tool! 1 is great for trading binary options with an expiration time of 1 candle. 2 works on all currency pairs, stocks, commodities, cryptocurrencies Instructions: As soon as the red ar
DYJ TradingView
Daying Cao
5 (1)
DYJ TRADINGVIEW is a multi indicator rating system, using the rating signals counts and analysis tools to find entry opportunities in global markets DYJ TRADINGVIEW has 10 built-in indicators for market analysis. Indicator-based analysis is used by many traders to help them make decisions on what trades to take and where to enter and exit them.  We use several different types that can complement each other well. Use us to follow your market, You can find more accurate transactions. The trend ind
Fibonacci and RSI Demo version MQL5
Carlos Daniel Vazquez Rosas
4 (1)
Fibonacci and RSI. Demo versión only works with GBPUSD. For full version, please, visit visit https://www.mql5.com/en/market/product/52101 The indicator is a combination of the Fibonacci and RSI indicators. Every time the price touches one of the fibonacci levels and the rsi condition is met, an audible alert and a text alert are generated. Parameters number_of_candles : It is the number of candles that will be calculated. If you put 100, the indicator will give you the maximum and min
FREE
Buyers of this product also purchase
First of all Its worth emphasizing here that this Trading System is Non-Repainting , Non-Redrawing and Non-Lagging Indicator , Which makes it ideal from both manual and robot trading .  The Smart Trend Trading System MT5 is a comprehensive trading solution tailored for new and experienced traders . It combines over 10 premium indicators and features more than 7 robust trading strategies , making it a versatile choice for diverse market conditions . Trend Following Strategy : Provides precise ent
Quantum Trend Sniper
Bogdan Ion Puscasu
5 (37)
Introducing   Quantum Trend Sniper Indicator , the groundbreaking MQL5 Indicator that's transforming the way you identify and trade trend reversals! Developed by a team of experienced traders with trading experience of over 13 years,   Quantum Trend Sniper Indicator   is designed to propel your trading journey to new heights with its innovative way of identifying trend reversals with extremely high accuracy. ***Buy Quantum Trend Sniper Indicator and you could get Quantum Breakout Indicator fo
FX Volume MT5
Daniel Stein
4.94 (17)
Visit our all-new   Stein Investments Welcome Page   to get the latest information, updates and trading strategies. FX Volume is the FIRST and ONLY volume indicator that provides a REAL insight into the market sentiment from a broker's point of view. It provides awesome insights into how institutional market participants, like brokers, are positioned in the Forex market, much faster than COT reports. Seeing this information directly on your chart is the real game-changer and breakthrough solut
RelicusRoad Pro MT5
Relicus LLC
4.81 (21)
How many times have you bought a trading indicator with great back-tests, live account performance proof with fantastic numbers and stats all over the place but after using it, you end up blowing your account? You shouldn't trust a signal by itself, you need to know why it appeared in the first place, and that's what RelicusRoad Pro does best! NOW $147 (increasing to $499 after a few updates) - UNLIMITED ACCOUNTS (PCs or MACs) **  User Manual + Strategies + Training Videos + Private Group with
FX Power MT5 NG
Daniel Stein
5 (4)
Trading GOLD, and currencies, with the dog walk strategy  - super smart Trading GOLD, and currencies, with the breakout strategy  - super easy Visit our all-new   Stein Investments Welcome Page   to get the latest information, updates and trading strategies. FX Power MT5 NG  is the next generation of our long-time very popular currency strength meter, FX Power.  And what does this next-generation strength meter offer? Everything you have loved about the original FX Power  PLUS GOLD/XAU st
Advanced Supply Demand MT5
Bernhard Schweigert
4.53 (15)
Best Solution for any Newbie or Expert Trader! This indicator is a unique, high quality and affordable trading tool because we have incorporated a number of proprietary features and a new formula. With this update, you will be able to show double timeframe zones. You will not only be able to show a higher TF but to show both, the chart TF, PLUS the higher TF: SHOWING NESTED ZONES. All Supply Demand traders will love it. :) Important Information Revealed Maximize the potential of Advanced Suppl
XQ Indicator MetaTrader 5
Marzena Maria Szmit
5 (1)
Step into the realm of Forex trading with confidence and precision using XQ, a cutting-edge Forex indicator designed to elevate your trading game to unprecedented heights. Whether you're a seasoned trader or just stepping into the world of currency exchange, XQ Forex Indicator empowers you with the insights and signals needed to make informed trading decisions. The signal conditions are a combination of three indicators, and XQ Forex Indicator only display  medium and long-term trends . The ind
Volume by Price MT5
Brian Collard
5 (3)
The Volume by Price Indicator for MetaTrader 5 features Volume Profile and Market Profile TPO (Time Price Opportunity). Get valuable insights out of currencies, equities and commodities data. Gain an edge trading financial markets. Volume and TPO histogram bar and line charts. Volume Footprint charts. TPO letter and block marker charts including split structures. Versatile segmentation and compositing methods. Static, dynamic and flexible ranges with relative and/or absolute visualizations. Lay
Introducing   Quantum Breakout PRO , the groundbreaking MQL5 Indicator that's transforming the way you trade Breakout Zones! Developed by a team of experienced traders with trading experience of over 13 years,   Quantum Breakout PRO   is designed to propel your trading journey to new heights with its innovative and dynamic breakout zone strategy. Quantum Breakout Indicator will give you signal arrows on breakout zones with 5 profit target zones and stop loss suggestion based on the breako
ICT, SMC, SMART MONEY CONCEPTS, SMART MONEY, Smart Money Concept, Support and Resistance, Trend Analysis, Price Action, Market Structure, Order Blocks, BOS/CHoCH,   Breaker Blocks ,  Momentum Shift,   Supply&Demand Zone/Order Blocks , Strong Imbalance,   HH/LL/HL/LH,    Fair Value Gap, FVG, Inversion FVG, IFVG,  Premium  &   Discount   Zones, Fibonacci Retracement, OTE, Buy Side Liquidity, Sell Side Liquidity, BSL/SSL Taken, Equal Highs & Lows, MTF Dashboard, Multiple Time Frame, BigBar, HTF OB
Top indicator for MT5   providing accurate signals to enter a trade without repainting! It can be applied to any financial assets:   forex, cryptocurrencies, metals, stocks, indices .  Watch  the video  (6:22) with an example of processing only one signal that paid off the indicator! MT4 version is here It will provide pretty accurate trading signals and tell you when it's best to open a trade and close it. Most traders improve their trading results during the first trading week with the help of
Gann Squares Indicator: Analyzing Markets with Geometric Patterns The Gann Squares indicator is a powerful tool for market analysis that draws upon the mathematical concepts introduced by W.D. Gann in his article on "Mathematical Formula for Market Predictions." This indicator incorporates Gann's techniques involving square numbers such as 144, 90, and 52, as well as the Square of 9. Additionally, it incorporates  method for utilizing the Square of 9 in conjunction with channels and the star pa
TrendMaestro5
Stefano Frisetti
note: this indicator is for METATRADER4, if you want the version for METATRADER5 this is the link:  https://www.mql5.com/it/market/product/108106 TRENDMAESTRO recognizes a new TREND in the bud, he never makes mistakes. The certainty of identifying a new TREND is priceless. DESCRIPTION TRENDMAESTRO identifies a new TREND in the bud, this indicator examines the volatility, volumes and momentum to identify the moment in which there is an explosion of one or more of these data and therefore the mome
Blahtech Supply Demand MT5
Blahtech Limited
4.57 (14)
Was: $299  Now: $99   Supply Demand uses previous price action to identify potential imbalances between buyers and sellers. The key is to identify the better odds zones, not just the untouched ones. Blahtech Supply Demand indicator delivers functionality previously unavailable on any trading platform. This 4-in-1 indicator not only highlights the higher probability zones using a multi-criteria strength engine, but also combines it with multi-timeframe trend analysis, previously confirmed swings
Owl Smart Levels MT5
Sergey Ermolov
4.47 (36)
MT4 version  |   FAQ The Owl Smart Levels Indicator is a complete trading system within the one indicator that includes such popular market analysis tools as Bill Williams' advanced fractals , Valable ZigZag which builds the correct wave structure of the market, and Fibonacci levels which mark the exact levels of entry into the market and places to take profits. Detailed description of the strategy Instructions for working with the indicator Advisor-assistant in trading Owl Helper Private User
TPSproTREND PrO MT5
Roman Podpora
5 (5)
TPSpro TRENDPRO  - is a trend indicator that automatically analyzes the market and provides information about the trend and each of its changes, as well as giving signals for entering trades without redrawing! The indicator uses each candle, analyzing them separately. referring to different impulses - up or down impulse. Exact entry points into transactions for currencies, crypto, metals, stocks, indices!  -  Version MT4                  DETAILED DESCRIPTION        /       TRADING SETUPS       
Gartley Hunter Multi
Siarhei Vashchylka
5 (5)
Gartley Hunter Multi - An indicator for searching for harmonic patterns simultaneously on dozens of trading instruments and on all classic timeframes: (m1, m5, m15, m30, H1, H4, D1, Wk, Mn). Manual (Be sure to read before purchasing) | Version for MT4 Advantages 1. Patterns: Gartley, Butterfly, Shark, Crab. Bat, Alternate Bat, Deep Crab, Cypher 2. Simultaneous search for patterns on dozens of trading instruments and on all classic timeframes 3. Search for patterns of all possible sizes. Fr
TrendDecoder Premium MT5
Christophe, Pa Trouillas
5 (1)
Identify ranges  | Get earliest signals of Trends  | Get clear exits before reversal  | Spot the Fibo levels the price will test   |  Non-repainting, non-delayed indicator - ideal for manual and automated trading - for all assets and all time units $69   for launch - then back to >>   $149 After purchase,   please contact me on this channel   for recommended and personalised settings MT4   version:  Click here Get our full method with  BladeSCALPER  and   PowerZONES What is it about? TrendDE
Was: $249  Now: $99   Market Profile defines a number of day types that can help the trader to determine market behaviour. A key feature is the Value Area, representing the range of price action where 70% of trading took place. Understanding the Value Area can give traders valuable insight into market direction and establish the higher odds trade. It is an excellent addition to any system you may be using. Inspired by Jim Dalton’s book “Mind Over Markets”, this indicator is designed to suit the
Golden Spikes Detector
Batsirayi L Marango
5 (1)
Golden Spikes Detector This indicator is based on an advanced strategy primarily for trading spikes on Boom and Crash Indices. Complex algorithms were implemented to detect high probability entries only. It alerts on potential Buy and Sell entries. To trade spikes on the Deriv or Binary broker, only take Buy Boom and Sell Cash alerts. It was optimised to be loaded on 5-minute timeframe although multiple timeframe analysis is done in the background. Features ·             Desktop pop up and sound
Matrix Arrow Indicator MT5
Juvenille Emperor Limited
5 (14)
Matrix Arrow Indicator MT5  is a unique 10 in 1 trend following   100% non-repainting  multi-timeframe indicator that can be used on all symbols/instruments:   forex,   commodities,   cryptocurrencies,   indices,   stocks .  Matrix Arrow Indicator MT5  will determine the current trend at its early stages, gathering information and data from up to 10 standard indicators, which are: Average Directional Movement Index (ADX) Commodity Channel Index (CCI) Classic Heiken Ashi candles Moving Aver
IX Power MT5
Daniel Stein
5 (2)
IX Power   finally brings the unbeatable precision of FX Power to non-Forex symbols. It accurately determines the intensity of short, medium and long-term trends in your favourite indices, stocks, commodities, ETFs, and even cryptocurrencies. You can   analyse everything   your terminal has to offer. Try it out and experience how   your timing improves significantly   when trading. Read about our latest strategic development -  Easy scalping with IX Power Visit our all-new   Stein Investments
Golden Gate Algo MT5
James David Lane
4 (6)
Introducing GoldenGate Algo: A Cutting-Edge Trading Solution!  Discover a revolutionary approach to trading with GoldenGate Algo (GGA), an advanced indicator designed to elevate your trading experience. GGA provides a comprehensive set of features to empower users with precision and confidence in their trading decisions. No re-painting! Pairs:   Any TimeFrames:   15m up to H1 Key Features: Buy and Sell Arrow Indications:   Receive Buy and Sell arrow indications accompanied by pop-up alerts,
Legacy of Gann for MT5
Pavel Zamoshnikov
5 (4)
The indicator very accurately determines the levels of the possible end of the trend and profit fixing. The method of determining levels is based on the ideas of W.D.Gann, using an algorithm developed by his follower Kirill Borovsky. Extremely high reliability of reaching levels (according to K. Borovsky  - 80-90%) Indispensable for any trading strategy – every trader needs to determine the exit point from the market! Precisely determines targets on any timeframes and any instruments (forex, met
Bill Williams Advanced
Siarhei Vashchylka
5 (3)
Bill Williams Advanced is designed for automatic chart analysis using Bill Williams' "Profitunity" system. The indicator analyzes four timeframes at once. Manual (Be sure to read before purchasing) Advantages 1. Automatically analyzes the chart using the "Profitunity" system of Bill Williams. The found signals are placed in a table in the corner of the screen. 2. Equipped with a trend filter based on the Alligator indicator. Most of the system signals are recommended to be used only accordi
Trend Forecaster
Alexey Minkov
5 (3)
The Trend Forecaster indicator utilizes a unique proprietary algorithm to determine entry points for a breakout trading strategy. The indicator identifies price clusters, analyzes price movement near levels, and provides a signal when the price breaks through a level. The Trend Forecaster indicator is suitable for all financial assets, including currencies (Forex), metals, stocks, indices, and cryptocurrencies. You can also adjust the indicator to work on any time frames, although it is recommen
Professional Scalping Tool on Deriv Attention! The indicator will be sold in limited quantities!!! Description: This trading indicator is designed for professional traders focused on scalping. Designed with the market in mind, it provides highly accurate spike trading signals. It works on the M1 timeframe and supports the following symbols: Boom 300 Index, Boom 500 Index, Boom 1000 Index, Crash 300 Index, Crash 500 Index, Crash 1000 Index. Functional Features: - Direction: - Trading is ca
The 123 Pattern is one of the most popular, powerful and flexible chart patterns. The pattern is made up of three price points: a bottom, a peak or valley, and a Fibonacci retracement between 38.2% and 71.8%. A pattern is considered valid when the price breaks beyond the last peak or valley, moment at which the indicator plots an arrow, rises an alert, and the trade can be placed. [ Installation Guide | Update Guide | Troubleshooting | FAQ | All Products ] Clear trading signals Customizable c
Quantum Heiken Ashi PRO MT5
Bogdan Ion Puscasu
4.5 (8)
Introducing the Quantum Heiken Ashi PRO charts with integrated alerts Designed to provide clear insights into market trends, the Heiken Ashi candles are renowned for their ability to filter out noise and eliminate false signals. Say goodbye to confusing price fluctuations and hello to a smoother, more reliable chart representation. What makes the Quantum Heiken Ashi PRO truly unique is its innovative formula, which transforms traditional candlestick data into easy-to-read colored bars. Red and g
Trade Assistant MetaTrader System  — a multi-timeframe system that is based on three standard indicators:   Stochastic oscillator ,   RSI   (Relative Strength Index), and   CCI   (Commodity Channel Index). It displays current trend directions for M1, M5, M15, M30, H1, H4, D1, W1, and MN1 timeframes. When you follow such an indicator you have a clear picture of the trends across all important timeframes. It doesn't matter which timeframe you attach this indicator to. Input parameters CheckCandl
More from author
I recommend you to read the product's blog  (manual) from start to end so that it is clear from the beginning what the EA offers. This Expert advisor's (EA) main strategy is to place trades when 3 moving averages (MA) are in consecutive alignment and at a certain distance from each other (it can be used for instance for a not very well known strategy used by some institutional traders, which involves the MAs 10, 20 and 30 on the D1 time frame). The EA works best on H1 and larger time frames. Th
I recommend you to read the   product's blog  (manual) from start to end so that it is clear from the beginning what the indicactor offers. This multi time frame and multi symbol indicator identifies double or triple top/bottom formations or a following neckline breakout (confirmed top/bottom). It offers filters for RSI overbought/oversold, candle patterns (pin bar, engulfing, tweezer, morning/evening star, three line strike) and divergences (MACD, OsMA, Awesome (AO), RSI, CCI, Stochastic) whic
The indicator identifies when a divergence occurs between price and an indicator or oscillator. It identifies both regular and hidden divergences. Combined with your own rules and techniques, this indicator will allow you to create (or enhance) your own powerful system. Features Can detect divergences for the following oscillators/indicators:   MACD, OsMA, Stochastics, RSI, CCI, RVI, Awesome, ADX, ATR, OBV, Composite index, MFI and Momentum. Only one oscillator/indicator can be selected. Draws
FREE
I recommend you to read the   product's blog  (manual) from start to end so that it is clear from the beginning what the indicactor offers. This multi time frame and multi symbol divergence dashboard indicator sends an alert when one or two different divergences have been identified. It can be used with all time frames from M1 to MN. Maximum 9 time frames can be shown in the dashboard at the same time. It is possible to enable moving average, RSI or Bollinger bands trend filter to filter out on
Among the top indicators offered here on the market in terms of value for money. I recommend you to read the   product's blog  (manual) from start to end so that it is clear from the beginning what the indicator offers. This supply and demand zone indicator draws the zones on the chart and sends alerts when the price has reached or broken a zone. It has support  for one nested zones (zones on one other time frame than the current)  which will also be drawn on the chart and involve alerts. It
I recommend you to read the   product's blog  (manual) from start to end so that it is clear from the beginning what the indicactor offers. This multi time frame and multi symbol trend indicator sends an alert when a strong trend or trend reversal has been identified. It can do so by selecting to build up the dashboard using Moving average (single or double (both MA:s aligned and price above/below both)), RSI, Bollinger bands, ADX, Composite index (Constance M. Brown), Awesome (Bill Williams), 
This multi time frame and multi symbol indicator scans for pin bars. Combined with your own rules and techniques, this indicator will allow you to create (or enhance) your own powerful system. Features Can monitor all symbols visible in your Market Watch window at the same time. Apply the indicator to just one chart and instantly monitor the entire market. Can monitors every time frame, from M1 to MN, and sends you a real-time alert when a pin bar is identified. All Metatrader native alert types
I recommend you to read the   product's blog  (manual) from start to end so that it is clear from the beginning what the indicactor offers. This multi time frame and multi symbol indicator can identify the following 5 crosses: when a fast moving average crosses a slow moving average line. when price has reached a single moving average (closed above/below or just bounced). when a triple moving average formation has appeared (all 3 MA:s in consecutive alignment) when the MACD main line crosses th
I  recommend you to read the   product's blog  (manual) from start to end so that it is clear from the beginning what the indicator offers. This multi time frame and multi symbol indicator identifies double top/bottom, head & shoulders, pennant/triangle and flag patterns. It is also possible to setup alerts only when a neckline/triangle/flagpole breakout has occured (neckline breakout = confirmed signal for top/bottoms and head & shoulders).  The indicator can also be used in single chart mode.
I recommend you to read the   product's blog  (manual) from start to end so that it is clear from the beginning what the indicactor offers. This multi time frame and multi symbol supply and demand zone dashboard indicator sends alerts when the price has reached a supply/demand zone. It is also possible to use it to be alerted about regular double tops/bottoms instead of zones. It can be used with all time frames from M1 to MN. It is possible to use RSI, divergence (MACD, OsMA, RSI or Awesome) a
Please if possible consider the  paid version  which I will continue to develop (there will be no future updates for this free version). This Expert Advisor identifies when a divergence occurs between price and an oscillator/indicator. It identifies both regular/classical (trend reversal) and hidden (trend continuation) divergences. It has RSI, bollinger, stochastics, moving average and ADX filter options which makes it possible to filter out only the strongest setups. The default settings ar
FREE
I  recommend you to read the   product's blog  (manual) from start to end so that it is clear from the beginning what the indicator offers. In addition to finding bullish and bearish Three line strike formations this multi symbol and mutli time frame indicator can also scan for the following candlestick patterns (please see screenshots for explanation of the patterns): Three white soldiers (reversal>continuation pattern) Three black crows (reversal>continuation pattern) The formations do not ap
This indicator can send alerts when a Heiken Ashi Smoothed color change occurs. Combined with your own rules and techniques, this indicator will allow you to create (or enhance) your own powerful system. Features Can send all types of alerts. Option to delay the alert one or more bars in order to confirm the color (trend) change. Input parameters Candle shift for alert: Default is 1. Setting it to 0 will alert you on color change on the current candle. This should be regarded as a pending (uncon
FREE
Averaging down EA
Jan Flodin
5 (1)
This cost averaging Expert advisor (EA) places additional trades in the same direction as the original (manually opened) order when the price goes against you. It can be used as a grid system or as pure martingale system (exponential increasing of lot size) or smoothed martingale (for instance linear increasing of the lot size). Due to the risk involved, this EA is more suitable for intermediate to advanced traders who are well aware of how to handle risk management and trading an already profit
I recommend you to read the  product's blog  (manual) from start to end so that it is clear from the beginning what the EA offers. This Expert Advisor identifies when a divergence occurs between price and an oscillator/indicator. It identifies both regular/classical (trend reversal) and hidden (trend continuation) divergences. It has supply/demand zone, RSI, bollinger, stochastics, moving average (regular MA and Hull MA), ADX and volume filter options which makes it possible to filter out only
I recommend you to read the   product's blog  (manual) from start to end so that   it is clear from the beginning what the indicator offers. This multi time frame and multi symbol indicator identifies double top/bottom, head & shoulder, pennant/triangle and flag patterns. It is also possible to setup alerts only when a neckline/triangle/flagpole breakout has occured (neckline breakout = confirmed signal for top/bottoms and head & shoulders). The indicator can also be used in single chart mode.
The indicator identifies when a divergence occurs between price and an indicator or oscillator. It identifies bullish and bearish hidden or regular (classical) divergences. Combined with your own rules and techniques, this indicator will allow you to create (or enhance) your own powerful system. Features Can detect divergences for the following indicators/oscillators: MACD, OsMA (Moving average of Oscillator), Stochastics, RSI, CCI, RVI, Awesome (AO), ADX, ATR, OBV, MFI, Momentum and   Composi
FREE
This indicator can send alerts when a Heiken Ashi Smoothed color change occurs. Combined with your own rules and techniques, this indicator will allow you to create (or enhance) your own powerful system. Features Can send all types of alerts. Option to delay the alert one bar in order to confirm the color (trend) change. Input parameters Wait for candle close: 'true' or 'false'. Setting it to 'true' will delay the alert to the opening of the bar following the bar where the color change occurred.
FREE
I recommend you to read the   product's blog  (manual) from start to end so that it is clear from the beginning what the indicactor offers. This multi time frame and multi symbol indicator identifies double or triple top/bottom formations or a following neckline breakout (confirmed top/bottom). It offers RSI, pin bar, engulfing, tweezer, morning/evening star filters as well divergence filter options which makes it possible to filter out only the strongest setups. The indicator can also be used
This indicator recognizes a special type of Inside Bar formation which is formed by a big Master candle followed by 4 smaller candles (please see the strategy explanation below). Features Plots buy/sell stop lines on the chart as well as well as take profit and stop loss levels. The TP/SL levels are based on the Average True Range (ATR) indicator. Object colors are changeable. Sends you a real-time alert when a Master candle formation is identified - sound / popup / email / push notification. On
I recommend you to read the   product's blog  (manual) from start to end so that it is clear from the beginning what the indicactor offers. This multi time frame and multi symbol divergence dashboard indicator sends an alert when one or two different divergences have been identified. It can be used with all time frames from M1 to MN. It is possible to enable moving average or RSI trend filter to filter out only the strongest setups. Combined with your own rules and techniques, this indicator wi
Features This is an indicator that recognizes a special type of Inside Bar formation which is formed by a Master candle followed by 4 smaller candles (please see the strategy explanation below). Plots buy/sell stop lines on the chart as well as well as take profit and stop loss levels. The TP/SL levels are based on the Average True Range (ATR) indicator. Object colors are changeable. Sends you a real-time alert when a Master candle formation is identified - sound / pop-up / email / push notifica
I recommend you to read the  product's blog  (manual) from start to end so that it is clear from the beginning what the indicator offers. This multi time frame and multi symbol supply and demand zone dashboard indicator sends alerts when the price has reached a supply/demand zone. It is also possible to use it to be alerted about regular double tops/bottoms instead of zones. It can be used with all time frames from M1 to MN. Maximum 9 time frames can be shown in the dashboard at the same time. 
I recommend you to read the   product's blog  (manual) from start to end so that it is clear from the beginning what the indicactor offers. This multi time frame and multi symbol indicator can identify the following 5 crosses: when a fast moving average crosses a slow moving average line. when price has reached a single moving average (closed above/below or just bounced). when a triple moving average formation has appeared (all 3 MA:s in consecutive alignment). when the MACD main line crosses t
Please if possible consider buying the MT5 version   which at the moment offers more functionaIity . I also recommend you to read the product's blog  (manual) from start to end so that it is clear from the beginning what the EA offers. This Expert advisor's (EA) main strategy is to place trades when 3 moving averages (MA) are in consecutive alignment and at a certain distance from each other (it can be used for instance for a not very well known strategy used by some institutional traders, whic
I recommend you to read the   product's blog  (manual) from start to end so that it is clear from the beginning what the indicactor offers. This indicator for Metatrader 4 identifies when a divergence occurs between price and an oscillator/indicator. It identifies both bullish and bearish divergences. It has a RSI filter option which makes it possible to filter out only the strongest setups. The indicator also offers options to wait for an Engulfing formation, Donchian channel breakout or for p
I  recommend you to read the   product's blog  (manual) from start to end so that it is clear from the beginning what the indicator offers. This multi time frame and multi symbol indicator scans for Pin bars, Morning/evening stars, Engulfings, Tweezers, Three Line Strikes, Inside bars and Pennants and Triangles.  The indicator can also be used in single chart mode. Please read more about this option in the product's   blog . Combined with your own rules and techniques, this indicator will allow
This multi time frame and multi symbol indicator scans for Pin bars, Morning/Evening stars, Engulfings, Tweezers, Three line strikes, Inside bars and Pennants and Triangles. The indicator can also be used in single chart mode. Please read more about this option in the product's blog . Combined with your own rules and techniques, this indicator will allow you to create (or enhance) your own powerful system. Features Can monitor all symbols visible in your Market Watch window at the same time. Ap
This multi time frame and multi symbol indicator identifies when the stochastics signal line (D) crosses the stochastics main line (K) as well as options  to scan for main line and signal line level crossovers.  As a bonus it can also scan for Bollinger bands and RSI overbought/oversold crosses. Combined with your own rules and techniques, this indicator will allow you to create (or enhance) your own powerful system. Features Can monitor all symbols visible in your Market Watch window at the sam
This multi indicator/oscillator (hereafter indicator), multi time frame and multi symbol indicator identifies when a divergence occurs between price and one, two or three indicators. It identifies both regular/classical (trend reversal) and hidden (trend continuation) divergences. It has RSI and MA trend filter options which makes it possible to filter out only the strongest setups. Combined with your own rules and techniques, this indicator will allow you to create (or enhance) your own powerfu
Filter:
Johan Julien Aubry
855
Johan Julien Aubry 2023.02.12 11:38 
 

Powerfull indicator, very cheap and with a lot of possibilities to customise settings. Can be used for entry points or to confirm other entries. Well documented and EA compatible. Jan is really helpful and very reactive. I totally recommend this product!

Daviddollar
86
Daviddollar 2022.06.30 17:04 
 

Not worth it, it alerts after the divergence is triggered. When using backtest only shows the confirmed ones and erases de rest.

Edensgarden
20
Edensgarden 2022.01.17 14:27 
 

It's a very good divergence indicator; it does what is promised by Jan. I have incorporated this tool into my trading habits. Also great support from Jan.

kamz1419
149
kamz1419 2021.07.16 18:14 
 

Great product, works as exactly as required and the alerts are timely and you change and choose from a range of settings. The support Jan offers os excellent and he replies very fast with the required solutions. Thanks

hpolanco
64
hpolanco 2021.02.26 00:31 
 

Please add multicolor histogram EXAMPLE: http://www.profitf.com/wp-content/uploads/2015/03/MACD-color.jpg

marco
132
marco 2020.10.04 11:05 
 

Very interesting Indicator and Jan is a super Friendly & Dedicated Developer

jacki robo
88
jacki robo 2020.09.07 09:18 
 

this indicator was great .I want to give 1000 star!

Robby Wijaya
210
Robby Wijaya 2020.04.14 20:30 
 

This indicator are very very great and smart, its catch almost 90% of divergence form but when you know how to use it properly for scalping strategy then this indicator I can say Perfect 100% !! Thanks Jan you are ROCK , GBU

Hasan Yildirim
911
Hasan Yildirim 2019.12.30 14:28 
 

User didn't leave any comment to the rating

Erik Vikanes Hansen
212
Erik Vikanes Hansen 2019.08.22 12:02 
 

This indicator seems to be very promising, where it gives reliable entry signals and one can choose from a variety of different oscillators. I have been using it for a short time and so far I am very happy. Jan the developer, is also very friendly and easy to get in touch with. He helps out with his experience with regards to both choosing the best oscillator and preferred settings for different instruments. So far I would recommend this indicator. It is very easy to play around with all the different oscillators and settings for backtesting.

Thomas
85
Thomas 2019.06.11 14:37 
 

I can't tell how amazing this Indicator is. In combination with a few different setups it is a weapon on GBP/USD. Really, really great. Thank you Mr. Flodin.

Reply to review
Version 3.3 2023.03.18
*** Please always make a backup of the existing indicator (the .ex5 file) before you make an update ***

Change log:
- added Hull moving average to the list of breakout options
- added Bollinger trend filter filter as an option to the already existing RSI and ATR filters
- it is now possible to select to add the trend filter indicator to the chart
Version 3.2 2022.02.15
*** Please always make a backup of the existing indicator (the .ex5 file) before you make an update ***

- bug fix in the function which draws lines and arrows
Version 3.1 2022.01.18
*** Please always make a backup of the existing indicator (the .ex5 file) before you make an update ***

- bug fix in the Engulfing filter
Version 3.0 2022.01.17
*** Please always make a backup of the existing indicator (the .ex5 file) before you make an update ***

- added an option to ignore wicks on divergence candles, hence divergence signals will based on open/close prices instead of high/low prices.
Version 2.9 2022.01.12
*** Please always make a backup of the existing indicator (the .ex5 file) before you make an update ***

- added the possibility to be alerted only if the following candle (the candle after the divergence candle) is an engulfing candle. More information in the product's blog.
Version 2.8 2021.11.16
*** Please always make a backup of the existing indicator (the .ex5 file) before you make an update ***

- added Stochastics oversold/overbought filter for Stochastics divergences
- added Accumulation/Distribution and Accelerator divergences
- added an option to set the minimum amount of bars between extremums
- added an option to use an ATR filter instead of the RSI filter
Version 2.7 2021.11.03
*** Please always make a backup of the existing indicator (the .ex5 file) before you make an update ***

This is not a mandatory update if you are not using my Expert Advisor for auto trading based on signals from this indicator.

- added support for trading Donchian channel and Moving average breakouts with my Expert Advisor
Version 2.6 2021.08.31
*** Please always make a backup of the existing indicator (the .ex5 file) before you make the update ***

- added options to wait for a Donchian channel breakout or Moving average cross to confirm the divergence before signaling the trade
Version 2.5 2020.09.25
*** Please always make a backup of the existing indicator (the .ex5 file) before you make an update ***

This is not a mandatory update if you are not using iCustom() calls in an own developed Expert Advisor.

- added the possibility to use another buffer (#4) for iCustom() calls. By using this buffer instead you will know if the divergence is of regular (classical) or hidden type. Code example at the end of the product's blog
Version 2.4 2020.08.02
*** Please always make a backup of the existing indicator (the .ex5 file) before you make an update ***

- I have changed the logic of detecting divergences so that more divergences will be detected. The new logic will allow divergences even if there are additional indicator extremums (top/bottoms) between the 2 already existing extremum points. Please be aware of the fact that the new logic also comes with a performance cost. Something which will be more visible on slower computers.
- added an option to disable drawing of lines and arrows if the RSI filter is enabled and the price it outside the RSI levels
Version 2.3 2020.02.04
- added an option to embed a custom alert text into the alert
- upon request I have added the possibility to scan for "early" divergences. This means that the alert will come directly upon candle open instead of waiting for the slope in the indicator to change direction (candle shift 1 or 2). Candle shift must be set to 0 for this to work. Please be aware though that this will lead to more false signals (repaintings)
Version 2.2 2020.01.23
- minor bug fixes
Version 2.1 2019.11.01
- added support for MFI and Momentum divergences
- added the possibility to show MACD main line as histogram instead of a line (same as in the Metatrader native MACD indicator)
Version 2.0 2019.09.19
- added possibility to select OBV volume type
Version 1.9 2019.09.19
*** Please always make a backup of the existing indicator (the .ex4 file) before you make the update ***

- added support for OBV, ATR and Composite Index divgergences
- added an option to select if divergence candle must close at least xx % away from the high/low price
Version 1.8 2019.08.21
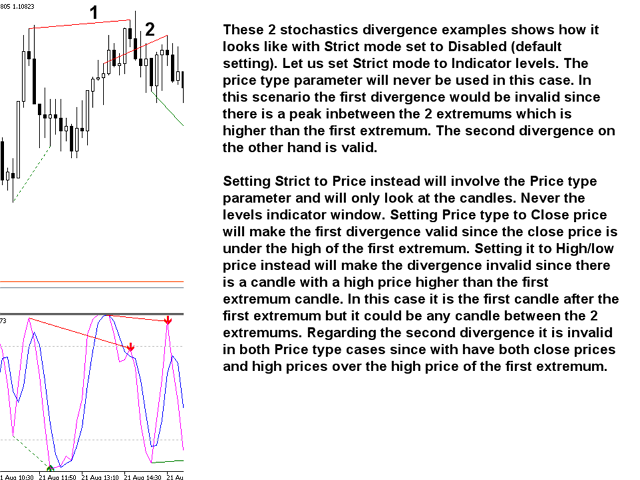
- added an option to use strict mode for price or indicator levels. When this has been enabled then the levels between the both extremums are not allowed to be higher/lower then the first or last extremum candle or indicator level.
Version 1.7 2019.08.15
- fixed an error for the level lines in the indicator window
Version 1.6 2019.08.14
- added ADX divergence
Version 1.5 2019.06.13
- corrected an issue with the RSI filter. Alerts came even if RSI was out of range.
Version 1.3 2019.02.18
- added RSI filter option
- added the possibility to disable scanning of bullish or bearish divergences
Version 1.2 2018.08.16
- added possibility to set custom line level values in the indicator window for Stochastics and RSI
Version 1.1 2018.06.27
- added support for iCustom with two buffers. Buffer index 4 for bull signals and index 5 for bear signals. The shift is always 0. The value returned is a close price of the candle where the divergence occured.