ADX Candles 2 AM
- Indicators
- Andriy Matviyevs'kyy
- Version: 26.0
- Updated: 12 September 2023
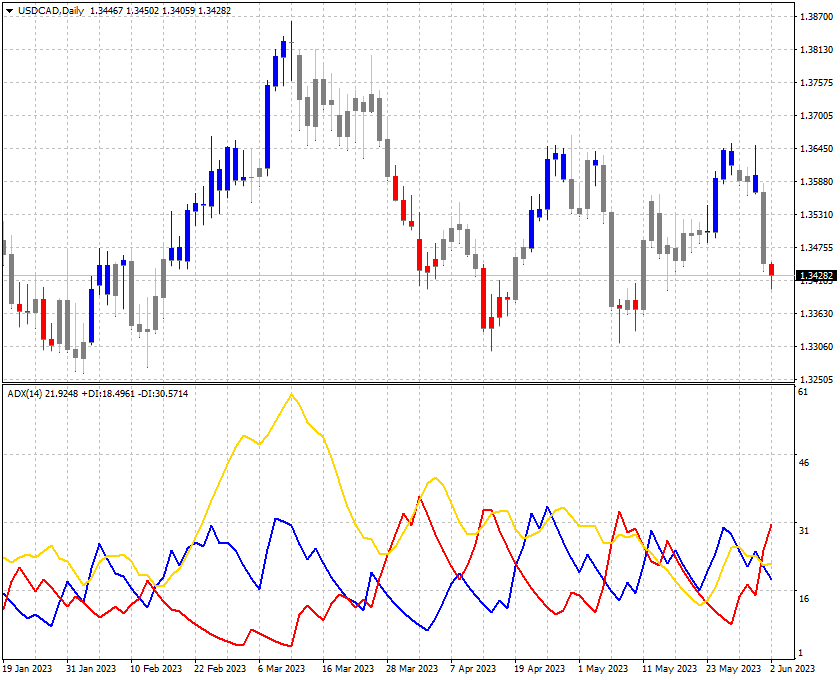
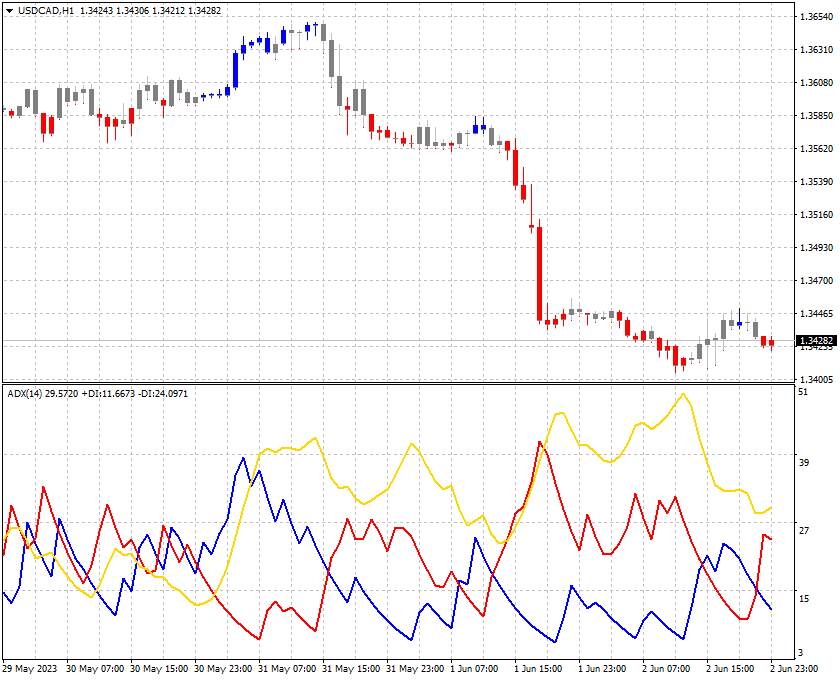
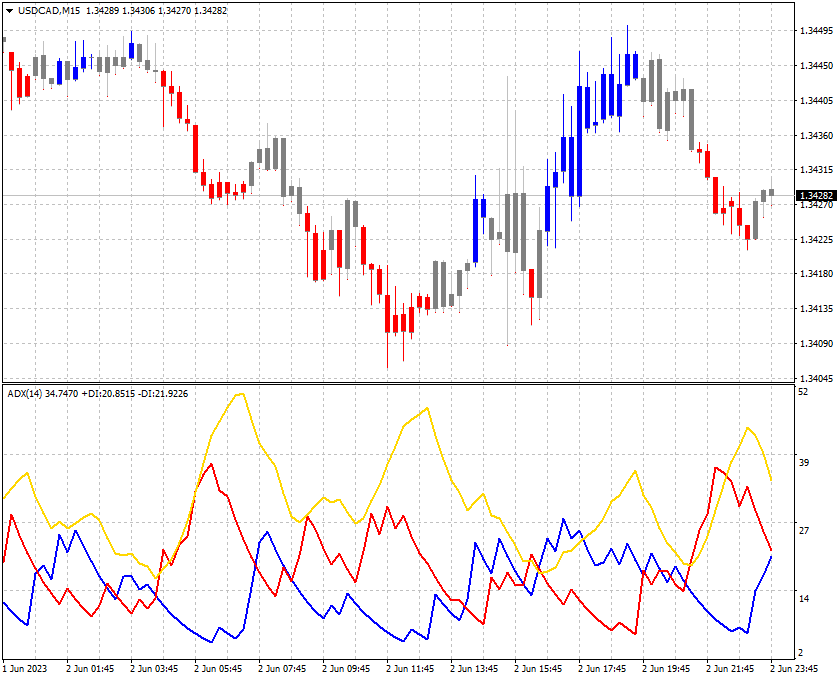
This indicator colors candles in accordance with the projected price movement. The analysis is based on the values of the classic ADX.
- If the DMI+ line is above the DMI- line and the main ADX line grows - the candlestick is painted in color that signals a price growth;
- If the DMI+ line is below the DMI- line and the main ADX line grows - the candlestick is painted in color that signals a price fall.
The indicator does not redraw on completed candlesticks.
The forming candlestick can change its color depending on the current data.
Thus, it is recommended to wait for the candlestick to be completed before making a decision.
The signal is confirmed when the price exceeds the High or Low of the completed candlestick that is painted in the corresponding color.
At the same time the precious candlestick must have a neutral or opposite color.
- ADX Period (>0) - ADX period used to calculate the indicator;
- ADX Price - price used in calculation.