Fibo Candle Previous for MT5
- Indicators
- Taras Slobodyanik
- Version: 3.50
- Updated: 26 November 2023
- Activations: 10
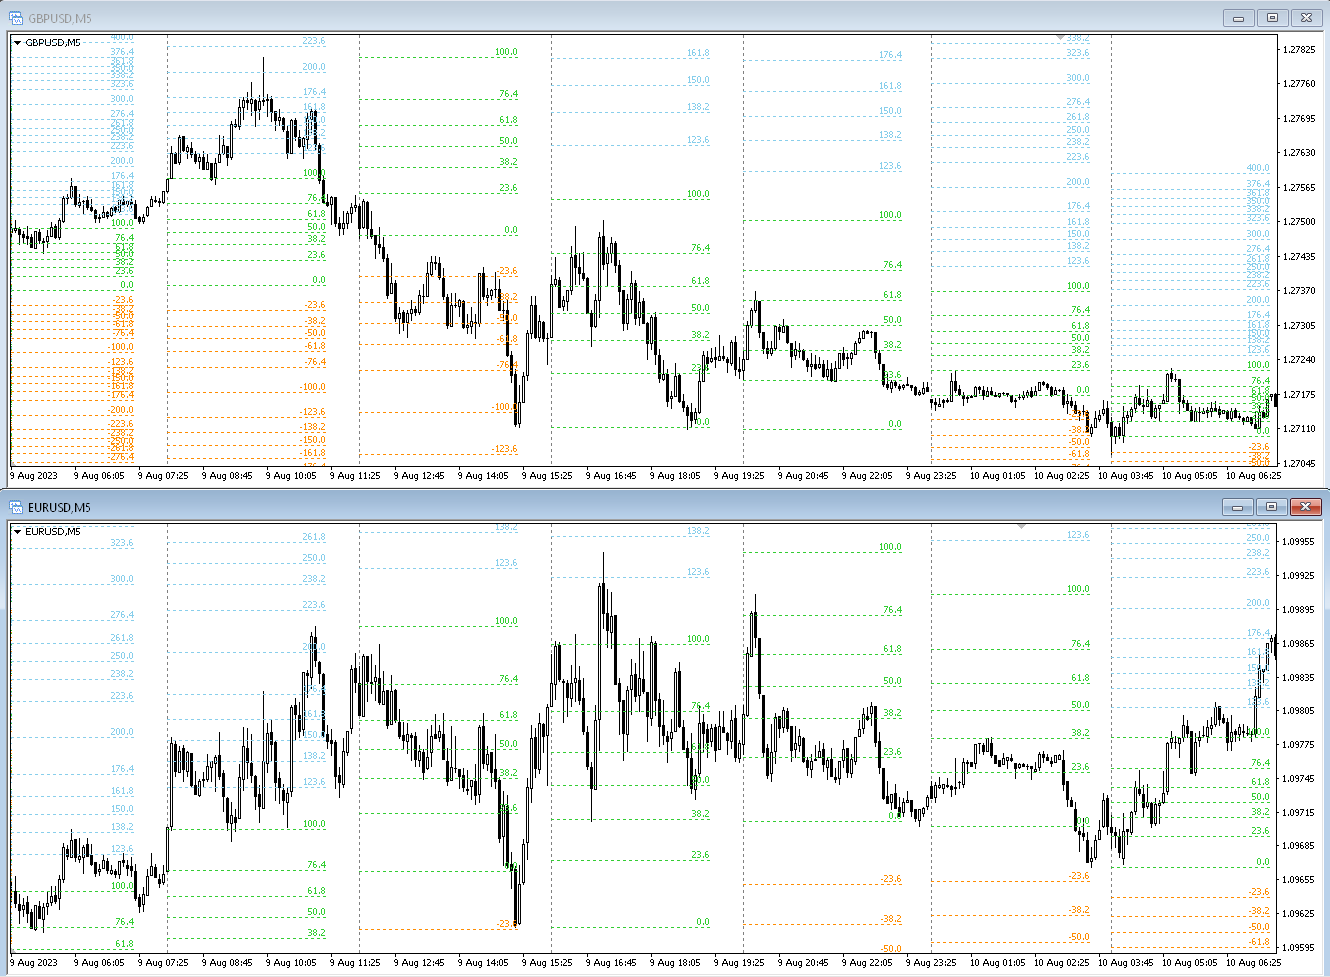
The indicator automatically draws the Fibonacci levels based on ZigZag indicator, Trading Sessions, Fractals or Candles (including non-standard timeframes: Year, 6 Months, 4 Months, 3 Months, 2 Months) (Auto Fibo Retracement). You can choose any higher time frame for Fibonachi calculation.
The levels are redrawn every time the current bar closes. It is possible to enable alerts when crossing the specified levels.
You can also analyze levels in history. To do this, it is necessary to specify the number of Fibo levels in the "Number of Fibo in the past" parameter.
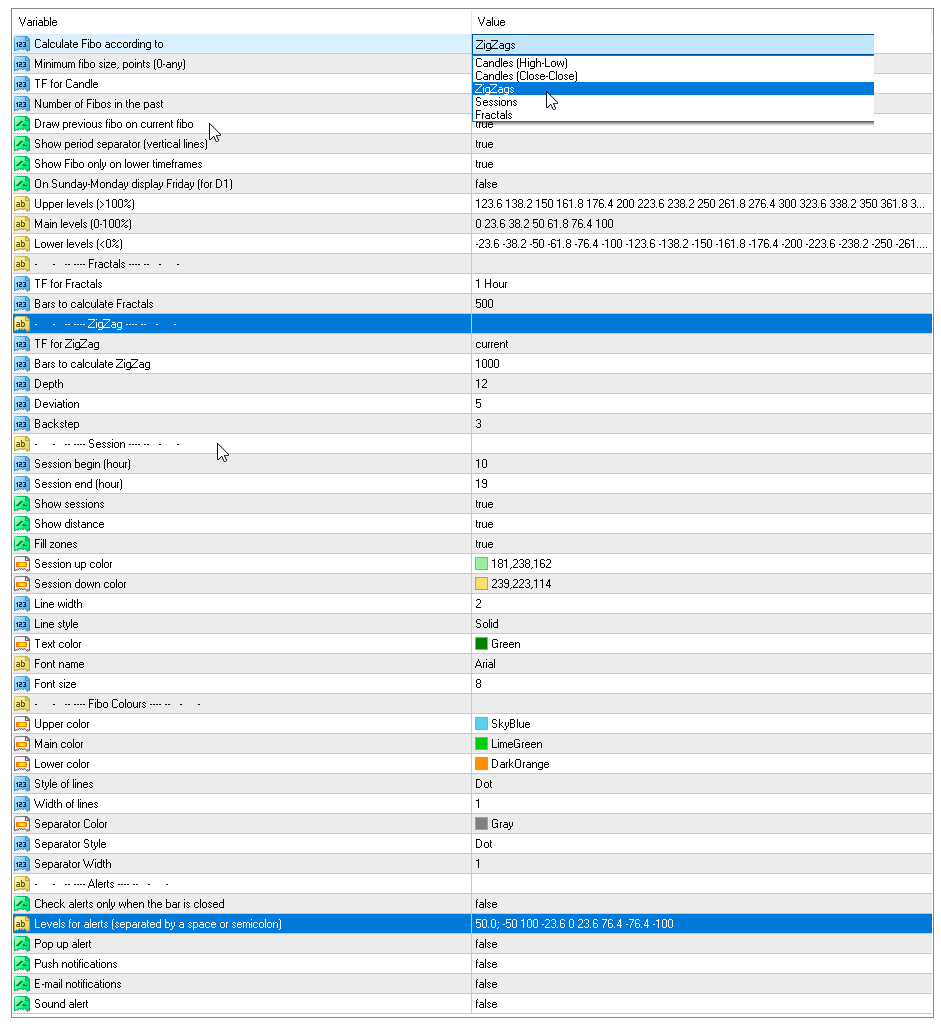
Parameters
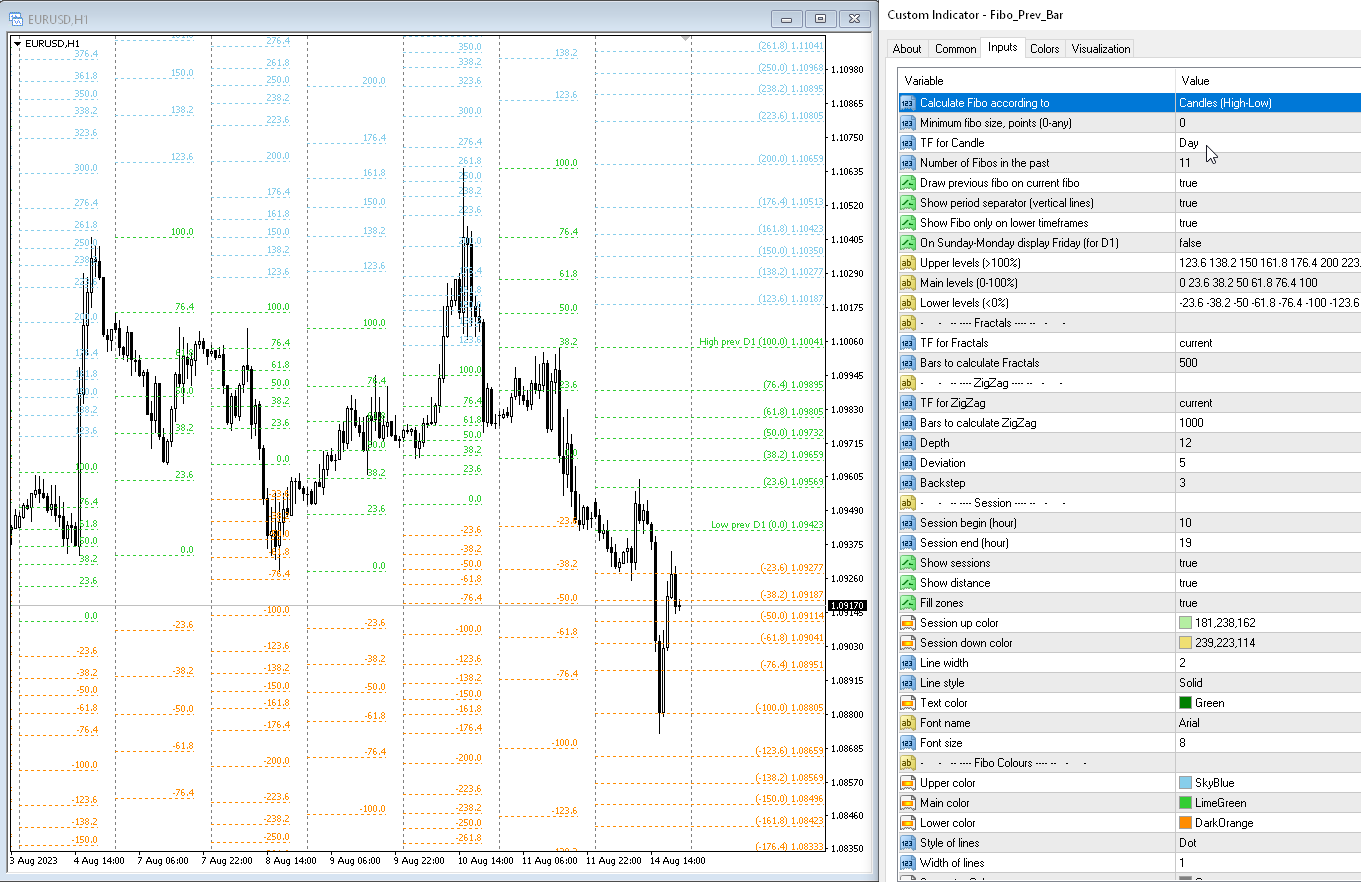
Calculate Fibo according to — Fibo search modes:- Candles (High-Low) — build a fibo based on the high-low;
- Candles (Close-Close) — build a fibo based on the close-close;
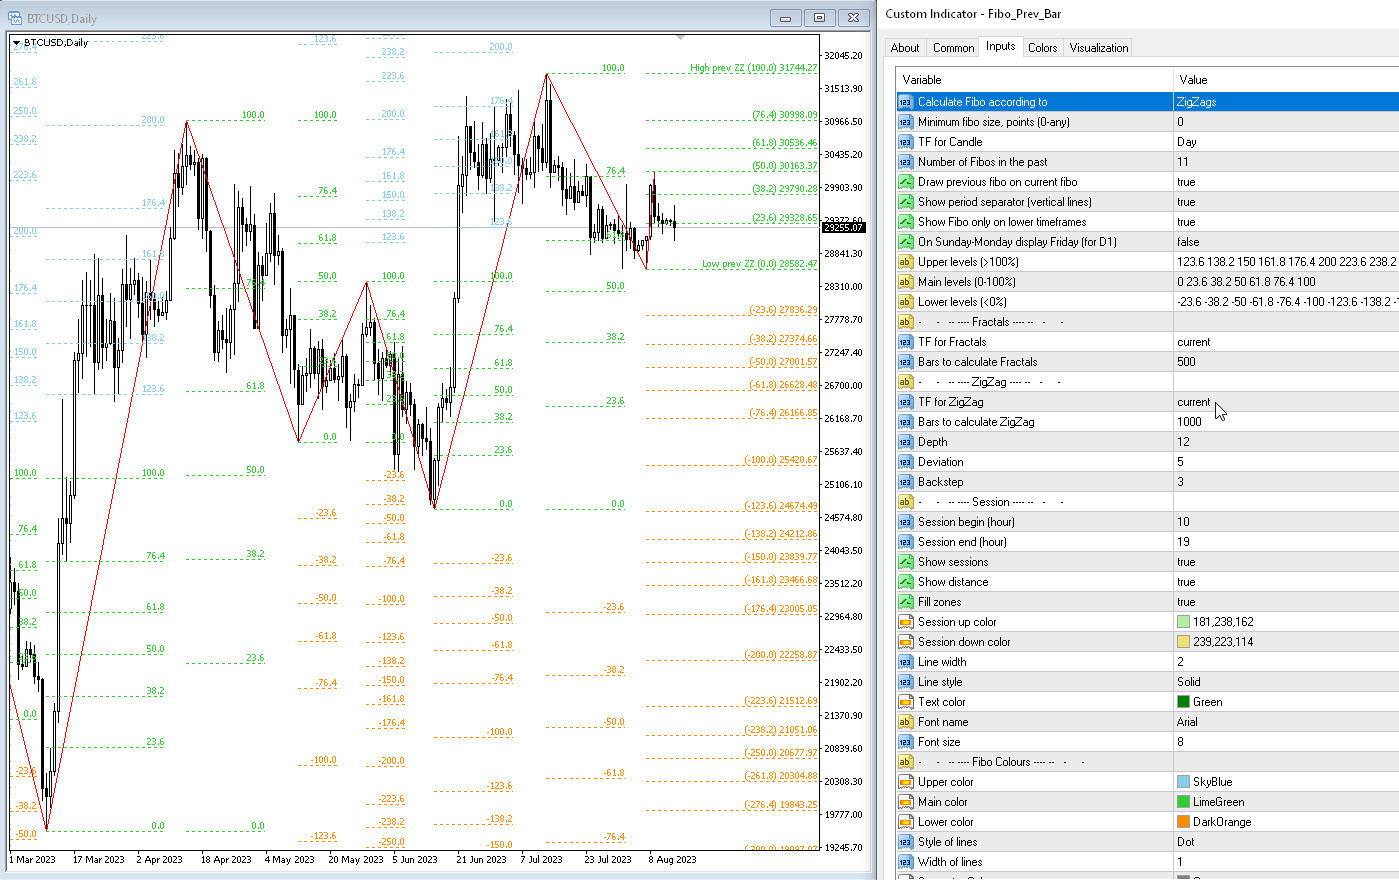
- ZigZags — build fibo by ZigZag points;
- Sessions — build fibo by Trading Sessions;
- Fractals — build fibo by Fractals points.
Minimum fibo size, points (0-any) — the minimum Fibo size in points. If the fibo is less than this size, then it is ignored.
TF for Candle — timeframe of candles for building Fibo levels;
Number of Fibo in the past — the number of Fibo levels to plot in history;
Upper levels (>100%) — upper levels, the values must be greater than 100 (separated by space or semicolon);
Main levels (0-100%) — middle levels, the values must be between 0 and 100 (separated by space or semicolon);
Lower levels (<0%) — lower levels, the values must be less than 100 (separated by space or semicolon);
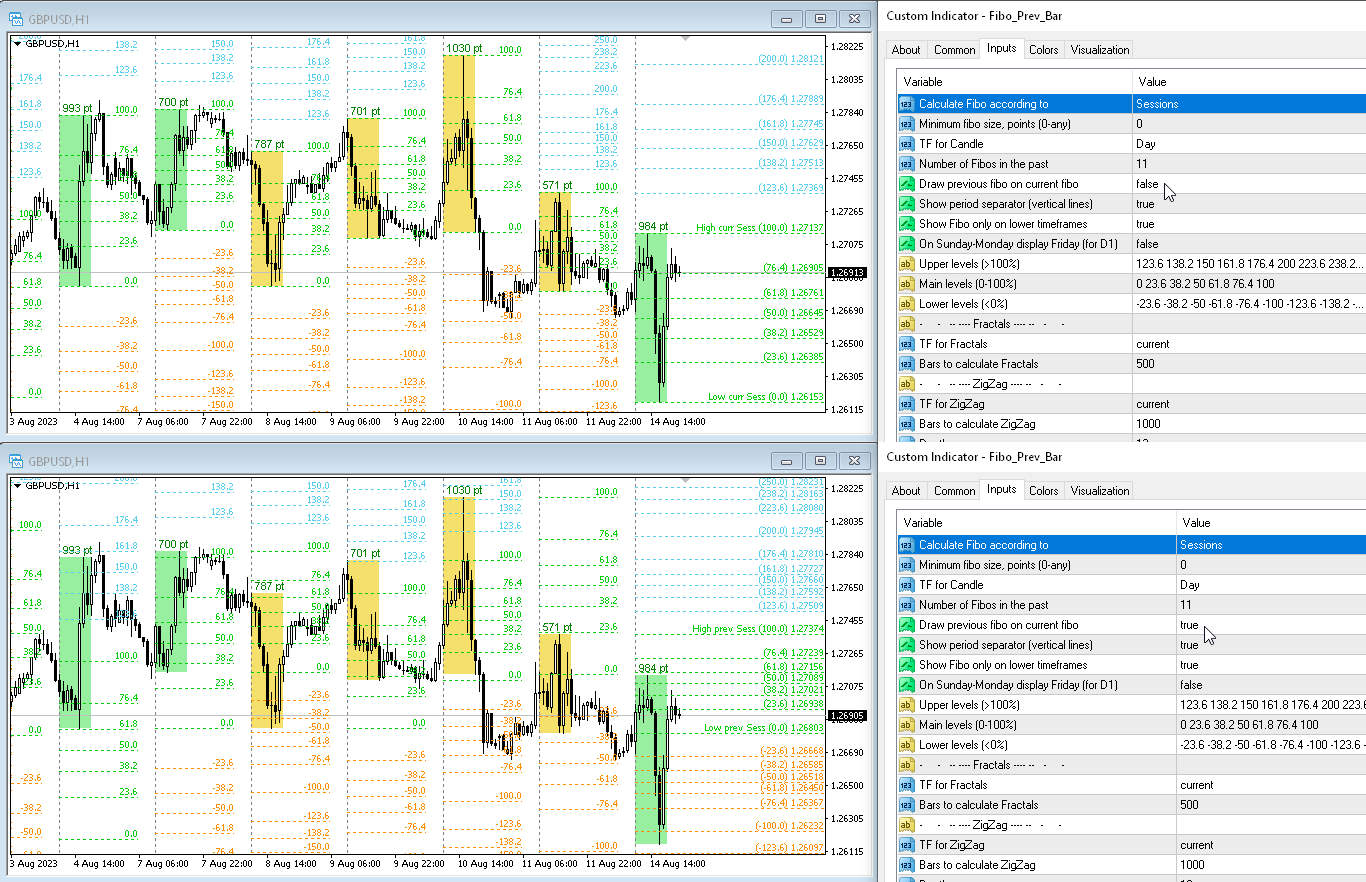
Draw previous fibo on current fibo — draw the previous Fibo in place of the current Fibo. If you disable this parameter, then Fibos will be drawn at the levels at which they were calculated.
On Sunday-Monday display Friday (for D1) — if there are quotes on Saturday-Sunday, then draw a Friday fibo. Only for period D1;
Show period separator (vertical lines) — show the period separator. Will be displayed as vertical lines on the chart;
Show Fibo only on lower timeframes — draw Fibo only on smaller periods;
Upper color — color of upper lines;
Main color — color of middle lines;
Lower color — color of lower lines;
Style of lines — line style;
Width of lines — line width;
Min pause between signals (sec) — pause between alerts in seconds;
Levels for alerts (separated by a space or semicolon) — levels for alerts, separated by spaces or semicolons;
Alerts — enable pop-up alerts;
Push notification — enable push-notifications;
Send e-mail — send emails.


This is one of the main indicators for my reviews, excellent the attentiveness of the developer to implement suggestions for improvements, great job!