• Overview
  • Reviews (319)
  • Comments (972)
  • What's new

Advanced Supply Demand

4.94

CURRENTLY 26% OFF !!

Best Solution for any Newbie or Expert Trader!

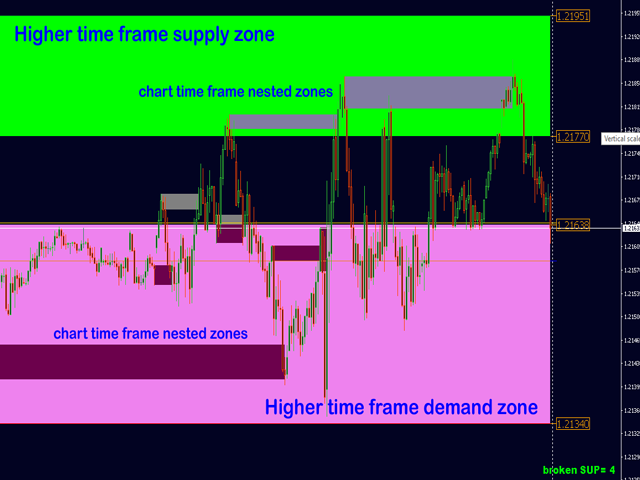
This indicator is a unique, high quality and affordable trading tool because we have incorporated a number of proprietary features and a new formula. With this update, you will be able to show double timeframe zones. You will not only be able to show a higher TF but to show both, the chart TF, PLUS the higher TF: SHOWING NESTED ZONES. All Supply Demand traders will love it. :)

Important Information Revealed

Maximize the potential of Advanced Supply Demand, please visit https://www.mql5.com/en/blogs/post/720245 

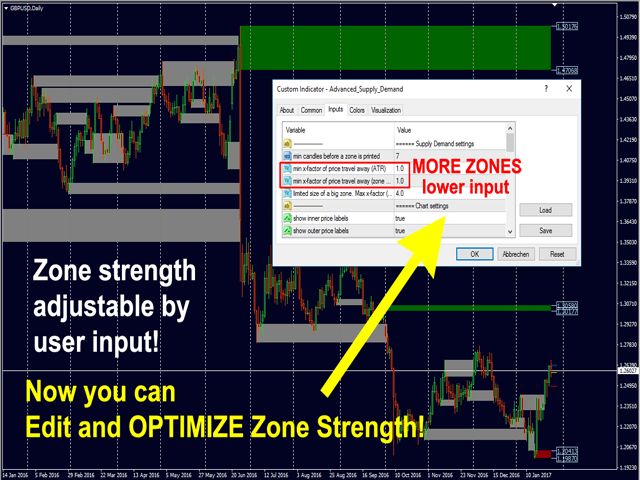
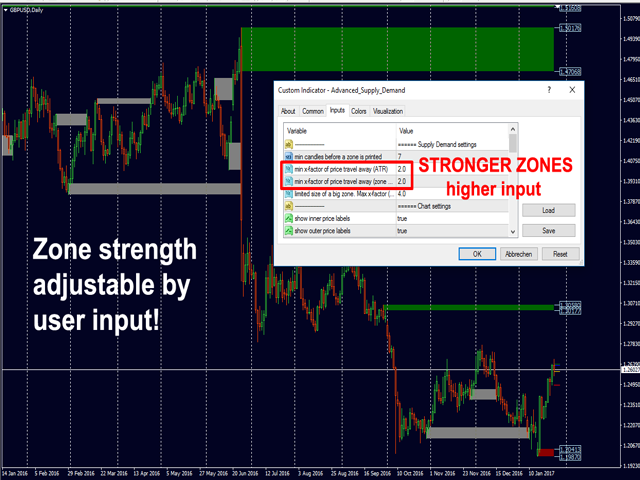
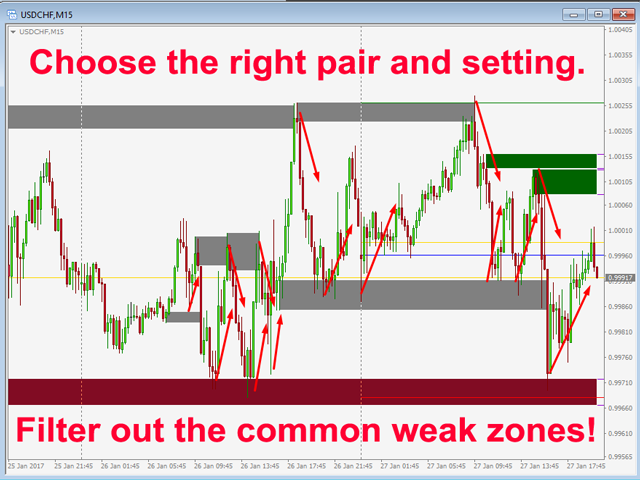
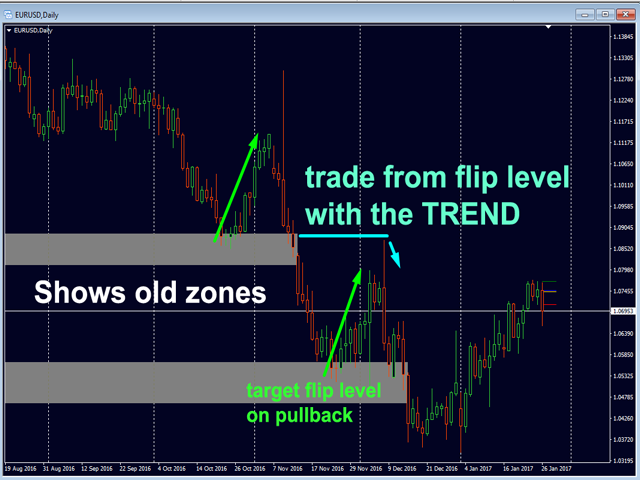
Imagine how your trading will improve because you are able to pinpoint the exact trigger point of entry or target? Built on new underlying algorithms it makes it even easier to identify potential imbalances between buyers and sellers. This is because it graphically shows the strongest supply and demand zones and how it performed in the past (showing old zones). These features were designed to help make it easier for you to find the best entry zones and levels. Now you can optimize and edit the zone strength for your symbol and timeframe!

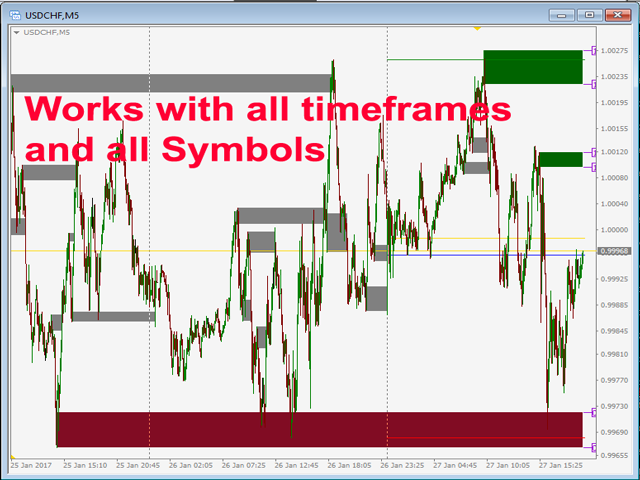
Advanced Supply Demand Indicator works on all products and timeframes. It is a new formula, and the very new features are two zone strength functions adjustable by user input! This is a great advantage in trading. When you learn how to use the proprietary features such as the zone strength with min X-factor of price travel away, you will be able to tell whether the zone is strong or not.

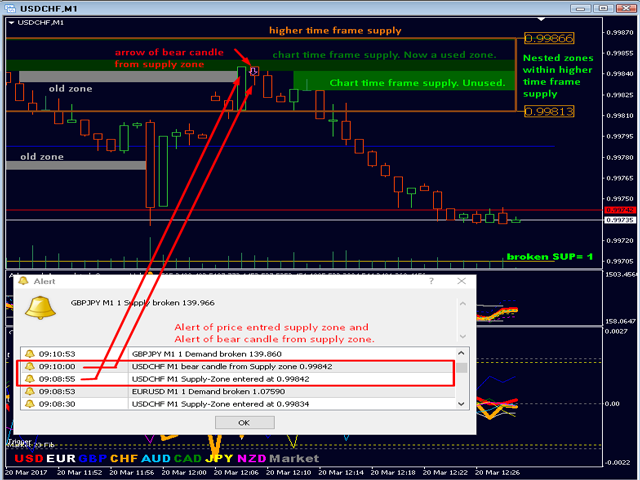
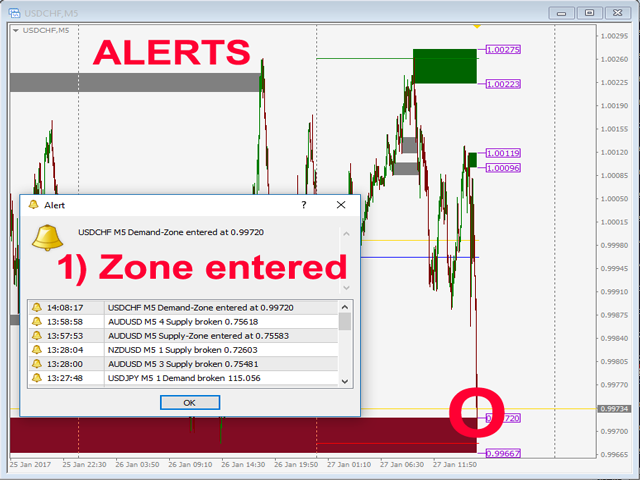
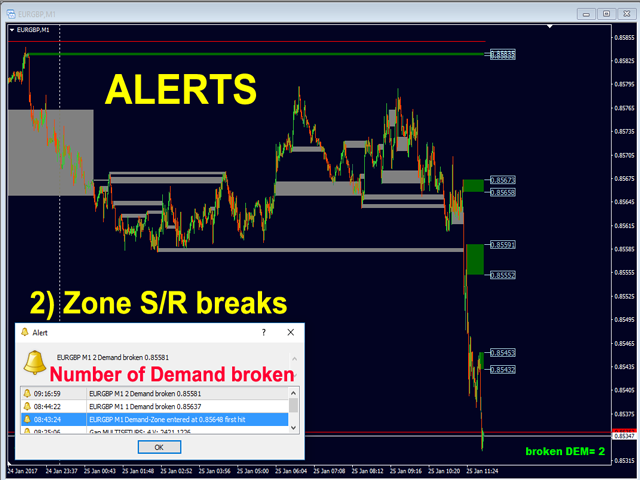
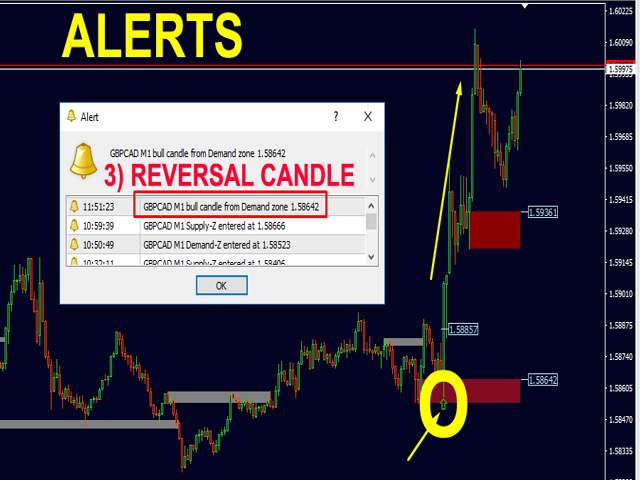
The supply and demand zones are used as an alert trigger. You have the choice of 3 alerts. If the price 1) enters the zone and/or 2) breaks the zone and/or 3) a reversal candle has formed from a zone. You can use popup alert with sound on MetaTrader 4 and/or push and/or email. When you will receive the alert you will know as a trader what to do.

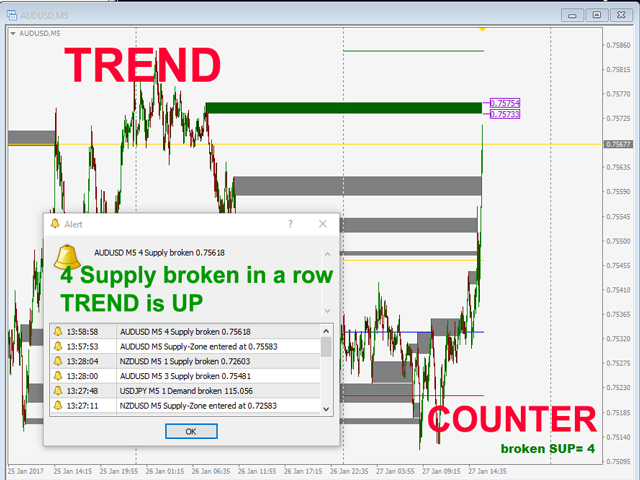
A message will tell you how many demand zones have been broken in a row, so you want to trade with the trend and look for a trend continuation.

The indicator can detect nested S/D zones!

A very powerful feature! The alert will tell if a S/D zone is nested (within) a higher timeframe S/D zone! All alerts can be filtered for nested zones.

Parameters

Supply Demand settings

  • Min candles before a zone is printed (used for live chart).
  • Min X-factor of price travel away (ATR) (The higher the number the stronger the zones). OPTIMIZE HERE FOR YOUR SYMBOL AND TIME FRAME!
  • Min Y-factor of price travel away (zone size) 2nd Input: The higher the number the stronger the zones. OPTIMIZE HERE FOR YOUR SYMBOL AND TIME FRAME!
  • Limited size of a big zone. Max factor (ATR) (Oversized big zones will be reduced. The higher the number the larger zones are allowed).

MTF settings

  • Add higher TF
  • Higher TF period (if MTF is the same or lower than chart TF, the higher one will be used)
  • min HTF!-candles before a zone is printed
  • min X-factor of price travel away (ATR) MTF
  • min Y-factor of price travel away (zone size) MTF
  • Limited size of a big zone. Max factor (ATR) MTF (Oversized big zones will be reduced. The higher the number the larger zones are allowed).
  • Show inner price labels MTF
  • Show outer price labels MTF

Chart settings

  • Show inner price labels.
  • Show outer price labels.
  • Show old zones (needed for Sup/Dem counter, see below).
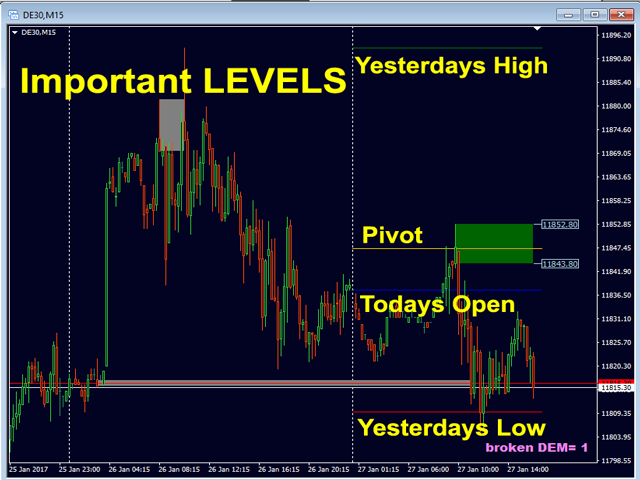
  • Show yesterdays high/low
  • Show todays pivot
  • Show number of broken Sup/Dem in a row (counter)
  • Show above in corner
  • draw rectangle extended over live candle

Alert settings

  • Alert zone hit
  • Alert zone break
  • Alert reverse candle from zone
  • alert only NESTED zones! (within MTF)
  • Alert Fake Breakout
  • FBO min bar Size Point
  • FBO bar close back % (20-90)
  • FBO pattern bar count (1-3)
  • Popup Alerts (MT4 popup and sound)
  • Send email alerts
  • Send push alerts

    Color settings

    • You know how to use it. Each zone has its own color.
      To see the full list click here.

      Other settings

      • use PIN (to use for an EA)
      • Show max number of supply zones
      • Show max number of demand zones
      • To see the full list click here.

        Tips

        1. User Manual: Click Here.
        2. Use my template (See comments).
        3. Optimize Zone Strength for your symbol and timeframe.
        4. Stay within the trend. The indicator is mostly used with one of my other specialized indicators of currency strength.
        5. Check my news and blogs on profile for trading system and trade examples.

        I will always help you if you have any questions.

        Best regards, Bernhard

        Reviews 20
        Solomon Ola
        113
        Solomon Ola 2023.03.26 11:29 
         

        I recommend this supply and demand to everyone trading is the best of the best I have been making money 💰 the moment I bought hit

        Reinaldo Ivan Santiago Perez
        260
        Reinaldo Ivan Santiago Perez 2023.03.06 05:20 
         

        best indis i have try so far so much money lost but finnaly have what i need thanks

        Oleg Moiseyenko
        145
        Oleg Moiseyenko 2023.03.04 00:06 
         

        Respect to the author for his work in creating indicators to facilitate trading. I especially want to note the support. In combination with the use of three indicators, success is guaranteed. I’v been using the second year, no complaints, 5 stars rating

        Recommended products
        This is the complete REX package. It consists of the lite, pro and ULTRA version.  Perfect for beginners and intermediates. REX complete is 100% non repaint. The strategy is based on a mix of different strategies, statistics, including pivot points, oscillators and patterns.  As the trading idea consists of a variety of some classic indicators like Momentum, Williams Percent Range, CCI, Force Index, WPR, DeMarker, CCI, RSI and Stochastic, it is clear that the fundamental indicators have being
        1 800 USD
        Supply and Demand Monster MT4
        Tsog Erdene Borjigon Enkhkhudulmur
        Supply and demand zones are at the heart of   supply and demand trading . These zones are areas that show  liquidity at a specific price.  The supply zone is also called the distribution zone, while the demand zone is called the accumulation zone.   Our indicator automatically draw supply and demand zones in Metatrader 5. It give opportunity to understand trading zone and avoiding risk.
        40 USD
        Introduction to X3 Chart Pattern Scanner X3 Cherart Pattern Scanner is the non-repainting and non-lagging indicator detecting X3 chart patterns including Harmonic pattern, Elliott Wave pattern, X3 patterns, and Japanese Candlestick patterns. Historical patterns match with signal patterns. Hence, you can readily develop the solid trading strategy in your chart. More importantly, this superb pattern scanner can detect the optimal pattern of its kind. In addition, you can switch on and off individu
        250 USD
        Infinity Trend Pro
        Yaroslav Varankin
        1 (1)
        This is a trend indicator without redrawing Developed instead of the binary options strategy (by the color of the Martingale candlestick) Also works well in forex trading When to open trades (binary options) A signal will appear in the place with a candle signaling the current candle It is recommended to open a deal for one candle of the current timeframe M1 and M5 When a blue dot appears, open a deal up When a red dot appears, open a trade down. How to open trades on Forex. When a signal is rec
        1 000 USD
        Auto Levels
        Yaroslav Varankin
        Auto Level this tool is able to determine the levels of support and resistance. search and display when the price has broken through the level and when it pushed off from it. the indicator can be useful if you use resistance support levels in your trading. or the highs and lows of the price, then it will greatly simplify your work and help you more quickly and more accurately determine the rebound or breakdown of the current trend or tendencies level. blue line bottom uptrend red line on top dow
        500 USD
        The indicator detects and displays 3 Drives harmonic pattern (see the screenshot). The pattern is plotted by the extreme values of the ZigZag indicator (included in the resources, no need to install). After detecting the pattern, the indicator notifies of that by a pop-up window, a mobile notification and an email. The indicator highlights the process of the pattern formation and not just the complete pattern. In the former case, it is displayed in the contour triangles. After the pattern is com
        30 USD
        WanaScalper MT4
        Isaac Wanasolo
        1 (1)
        A scalping indicator based on mathematical patterns, which on average gives signals with relatively small SL, and also occasionally helps to catch big moves in the markets (more information in the video) This indicator has three main types of notifications: The first type warns of a possible/upcoming signal on the next bar The second type indicates the presence of a ready signal to enter the market/open a position The third type is for SL and TP levels - you will be notified every time price r
        1 350 USD
        Trend Ray
        Andriy Sydoruk
        The indicator shows the potential trend direction by cyclical-wave dependence. Thus, all the rays of the intersection will be optimal rays, in the direction of which the price is expected to move, taking into account the indicator period. Rays can be used as a direction for potential market movement. But we must not forget that the approach must be comprehensive, the indicator signals require additional information to enter the market.
        59 USD
        Before
        Nadiya Mirosh
        The Before indicator predicts the most likely short-term price movement based on complex mathematical calculations. Most of the standard indicators commonly used in trading strategies are based on fairly simple calculations. This does not mean that there were no outstanding mathematicians in the world at the time of their creation. It is just that computers did not yet exist in those days, or their power was not enough for the sequential implementation of complex mathematical operations. Nowa
        77 USD
        Diamond Trend
        Segundo Calvo Munoz
        Indicator which identifies Trend and also buy/sell opportunities. Use for entries aligned to the Trend.  Although Diamond Trend is very accurate identifying entry points, it is always recommended to use a support indicator in order to reconfirm the operation. Remind to look for those Assets and Timeframes which best fit to your trader behavior/need... Valid for Scalping and Long Term operations. Please, set up a Bars Chart to be able to visualize the indicator properly...  ...And remind to give
        50 USD
        BPSPanel
        Remi Passanello
        BPS Panel Breakout Pro Scalper Solution Panel This indicator is part of the   RPTrade Pro Solutions  systems. BPS Panel   is a daily trend indicator using Price Action, Dynamic Support and Resistances. It's designed to be used by anyone, even the absolute beginner in trading can use it. NEVER repaints . Indications are given   from close to close . Designed to   be used alone , no other indicators are required. Gives you the trend and potential Take Profit at the beginning of the day. How
        1 300 USD
        FiboRec
        Alfred Kamal
        This indicator depends on Fibonacci lines but there is a secret lines i used them, by using FiboRec indicator you will be able to know a lot of important information in the market such as: Features You can avoid entry during market turbulence. You can enter orders in general trend only. You will know if the trend is strong or weak. Signal Types and Frame used You can use this indicator just on H1 frame. Enter buy order in case Candle break out the square area and closed over it, at least 20
        100 USD
        Tunafish EA MT4
        Ismaele Daniele Lodetti
        Tunafish EA is the most efficient EA on my profile. I spent a lot of time and effort to make this software sophisticated with possibilities of high potential returns while keeping the drawdown below 25%. The algorithms of the robot provide investors of any level of training with an investment opportunity that is both safe and aggressive. Tunafish EA imitating the work of the brain, capable of learning and adapting to changing conditions and predicting situations. When applied to trading in fina
        69 USD
        Trendiness Index
        Libertas LLC
        5 (3)
        "The trend is your friend" is one of the best known sayings in investing, because capturing large trendy price movements can be extremely profitable. However, trading with the trend is often easier said than done, because many indicators are based on price reversals not trends. These aren't very effective at identifying trendy periods, or predicting whether trends will continue. We developed the Trendiness Index to help address this problem by indicating the strength and direction of price trend
        49 USD
        Weis Wave with Alert
        Panagiotis Diamantopoulos
        4.78 (18)
        20% Off from 499$ to 399$, offer end 31/3/2023    https://youtu.be/RjSSW0byp-I ** NEW PLUTUS SIGNALS and ALL IN ONE ** Wychoff's UpThrust + Spring, Fake Breaks and Plutus  trading signals added (for more info visit  http://www.tradethevolumewaves.com  ) Different Wave Types, choose what your cumulative Histogram diplays: Volume, Pips, Progressive Volume Rate, Time or Emphasized Volume Waves  **IF YOU PURCHASE DO NOT FORGET TO CONTACT ME BECAUSE THERE IS MORE: Two Hrs Webinar + Training Room
        399 USD
        Black series MT4
        Dmitriy Kashevich
        1 (1)
        Black series MT4 - The indicator is designed for trading on binary options with Timeframe M1-M5-M15 Multicurrency (Works on cryptocurrency and currency pairs) The signal appears when the candle opens Up to 90% correct signals There is no signal redrawing at all Can be used with other indicators. Good for scalping! In Settings there is: -Indicator working methods -I Allert Arrow color Red signal down Blue signal up Also watch the video how the indicator works and signals
        999 USD
        This indicator is the logical continuation of the well-known equidistant channel indicator: https://www.mql5.com/en/market/product/8723 . The main purpose of the indicator is the visualization of price levels relative to the parallel channel using Fibo Bobokus levels in a separate window and the price history. This often allows forecasting the future price movement with a sufficiently high degree of probability. The Fibo levels calculation equation is as follows: FiboLevel = (50-(100*((Close[i]-
        40 USD
        The indicator automatically calculates and plots Fibonacci support and resistance levels - one of the most effective tools for market analysis. The calculation uses the averaged price data for the selected period and timeframe. The minimum and maximum for this period are taken as the beginning and end of the movement. Fibonacci levels allow you to see potential reference points, around which the price movement can slow down or reverse, that is, they are used to predict further movement, as well
        30 USD
        PZ 123 Pattern
        PZ TRADING SLU
        3.75 (4)
        The 123 Pattern is one of the most popular, powerful and flexible chart patterns. The pattern is made up of three price points: a bottom, a peak or valley, and a Fibonacci retracement between 38.2% and 71.8%. A pattern is considered valid when the price breaks beyond the last peak or valley, moment at which the indicator plots an arrow, rises an alert, and the trade can be placed. [ Installation Guide | Update Guide | Troubleshooting | FAQ | All Products ] Clear trading signals Customizable c
        49 USD
        Trend Scanner
        Vladimir Kalendzhyan
        4.33 (6)
        By purchasing this indicator, you have the right to receive a free copy of one of   my other indicator's or advisor’s!  (All future updates are included. No limits) . To get it , please contact me by  mql5 message ! The Trend Scanner trend line indicator displays the trend direction and its changes. The indicator works on all currency pairs and  timeframes. The indicator simultaneously displays multiple readings on the price chart: the support and resistance lines of the currency pair, the exist
        50 USD
        Laser Trend
        Nicolas Zouein
        The trend is your friend! This is what this indicator is all about. Follow this famous saying and be safe. Characteristics: Buy/Sell signals fixed on the close of a bar. Works on all symbols and all timeframes. Clear visual market trend laser line, Buy/Sell signal arrows, market strength meter, TP1 & TP2 boxes. Visual signals when to enter, when to exit the market. No repainting. Compatible with Flexible EA for trading automation. (Ask for a free set file optimized to perform 2010-2018) Para
        50 USD
        The indicator detects and displays М. Gartley's Butterfly pattern. The pattern is plotted by the extreme values of the ZigZag indicator (included in the resources, no need to install). After detecting the pattern, the indicator notifies of that by the pop-up window, a mobile notification and an email. The pattern and wave parameters are displayed on the screenshots. The default parameters are used for demonstration purposes only in order to increase the amount of detected patterns. Parameters
        30 USD
        UniversalIndicator is a universal indicator. A great helper for beginners and professional traders. The indicator algorithm uses probabilistic and statistical methods for analyzing the price of a trading instrument. The indicator is set in the usual way. Advantages of the indicator works on any time period works with any trading tool has a high probability of a positive forecast does not redraw Indicator Parameters LengthForecast = 30 - the number of predicted bars
        400 USD
        The indicator detects and displays Shark harmonic pattern (see the screenshot). The pattern is plotted by the extreme values of the ZigZag indicator (included in the resources, no need to install). After detecting the pattern, the indicator notifies of that by a pop-up window, a mobile notification and an email. The indicator highlights the process of the pattern formation and not just the complete pattern. In the former case, it is displayed in the contour triangles. After the pattern is comple
        30 USD
        Shark Surfer is a new generation indicator applying a well-established trend-following trading. The product is good both for scalping, as well as medium- and long-term trading. Shark Surfer analyzes a selected symbol and shows the recommended market entry, take profit and stop loss levels. Shark Surfer trades on all symbols and timeframes. It also features email and push notifications concerning the new trading signals. The indicator searches for suitable market entry points on an already formed
        500 USD
        Owl smart levels
        Sergey Ermolov
        5 (7)
        Indicator Guide   |  Owl Smart Levels Strategy  |  MT5 version  |  How to install?  | FAQ The Owl Smart Levels Indicator  is a complete trading system within the one indicator that includes such popular market analysis tools as  Bill Williams' advanced fractals , Valable ZigZag which builds  the correct wave structure  of the market, and  Fibonacci levels  which mark the exact levels of entry into the market and places to take profits. For a detailed description of the trading system, see the a
        97 USD
        DMAX pro
        Danny Teoh Kok Keong
        DMAX SIGNAL IS VERY POWERFUL TOOL TO HELP YOU ENTRY,ITS CAN DETECT OVERSOLD AND OVERBOUGHT IN FOREX MARKET. ITS CAN TRADE 24 FOREX PAIR IN MARKET, 80% ACCURATE RESULT. MANY TRADER FAIL BECAUSE OF ENTRY POINT AND EXIT POINT , SIGNAL OF DMAX WILL GIVE VERY GOOD SIGNAL TO LET YOU KNOW WHERE TO ENTRY AND EXIT.  RISK MANAGEMENT IS VERY IMPORTANT IN TRADING FOREX, PLEASE DONT RISK OVER 5% PER TRADE IS FORE MARKET
        150 USD
        This is a new strategy for SUPPLY DEMAND areas It is based on a calculation using the tick volume to detect the big price action in market for both bear /bull actions this smart volume action candles are used to determine the supply and demand areas prices in between main supply and demand lines indicate sideway market  up arrows will be shown when prices moves above the main supply and the secondary supply lines Down arrows will be shown when prices moves below the main demand and the secondary
        30 USD
        The indicator is designed to search for the 123 Pattern of the Zig Zag indicator, on two time frames. To do this, two ZigZag indicators, high and low time frames, are displayed simultaneously on the same chart in the indicator. The time frame of the chart on which the indicator is installed is considered low. The high time frame is selected in the indicator settings. The indicator has the ability to determine and show: Formation of the 123 pattern on a high time frame. Formation and bre
        30 USD
        PipsFactoryDaily
        Alfred Kamal
        5 (2)
        This indicator depends on High and Low price of currency in the last day, and then I made some secret equations to draw 10 lines. Features You will know what exactly price you should enter the market. You will know when to be out of market. You will know what you should do in market: Buy Sell Take profit, and there are three levels to take your profit Support Resistance Risk to buy Risk to sell Signal Types and Timeframes Used You can use this indicator just on (M1, M5, M15, M30, H1) timefra
        75 USD
        Buyers of this product also purchase
        Ultimate Sniper Dashboard
        Hispraise Chinedum Abraham
        4.78 (18)
        Discounted at $299! Prices may increase in the future! Read description below! Best Entry System for Ultimate Sniper Dashboard: ULTIMATE DYNAMIC LEVELS. (Please Check my products) The Ultimate Sniper Dashboard ONLY works on live markets due to MT4 multicurrency testing limits. Introducing the Ultimate-Sniper Dashboard! Our very best which contains both HA-Sniper, MA-Sniper. and many special modes. The Ultimate Sniper Dashboard is an absolute beast! Best Solution for any Newbie or Expert Trad
        299 USD
        Ultimate Dynamic Levels
        Hispraise Chinedum Abraham
        4.86 (7)
        Discounted at $199 for early birds! Prices may increase in the future. Read description below. Introducing Ultimate Dynamic Levels - the BEST Entry Indicator for the Ultimate Sniper Dashboard! Extremely Low-Risk timely entries and high RR! Find the Ultimate Sniper Dashboard Here The most important ability for both beginner and pro traders is to tell exactly where and when a market is most likely to turn, and how to get in safely and exit with profits. The Ultimate Dynamic Levels indicator ea
        199 USD
        Cycle Sniper
        Elmira Memish
        4.6 (30)
        NEW YEAR SALE PRICE FOR LIMITED TIME!!! Please contact us after your purchase and we will send you the complimentary indicators to complete the system. Cycle Sniper is not a holy grail but when you use it in a system which is explained in the videos, you will feel the difference. If you are not willing to focus on the charts designed with Cycle Sniper and other free tools we provide, we recommend not buying this indicator. We recommend watching the videos about the indiactor and system before
        200 USD
        Currently 20% OFF ! Best Solution for any Newbie or Expert Trader! This dashboard software is working on 28 currency pairs. It is based on 2 of our main indicators (Advanced Currency Strength 28 and Advanced Currency Impulse). It gives a great overview of the entire Forex market. It shows Advanced Currency Strength values, currency speed of movement and signals for 28 Forex pairs in all (9) timeframes. Imagine how your trading will improve when you can watch the entire market using a single indi
        199 USD
        TPA True Price Action indicator reveals the true price action of the market makers through 100% non-repainting signals (except early signals mode) strictly at the close of a candle! TPA shows entries and re-entries, every time the bulls are definitely stronger than the bears and vice versa. Not to confuse with red/green candles. The shift of power gets confirmed at the earliest stage and is ONE exit strategy of several. There are available now two free parts of the TPA User Guide for our custo
        168 USD
        Supply and Demand Dashboard PRO
        Bernhard Schweigert
        4.79 (19)
        Currently 20% OFF ! This dashboard is a very powerful piece of software working on multiple symbols and up to 9 timeframes. It is based on our main indicator (Best reviews:   Advanced Supply Demand ). The dashboard gives a great overview. It shows: Filtered Supply and Demand values including zone strength rating, Pips distances to/and within zones, It highlights nested zones, It gives 4 kind of alerts for the chosen symbols in all (9) time-frames. It is highly configurable for your personal
        199 USD
        FFXMV Dashboard Plus
        Opengates Success International
        Full Forex Market View Dashboard Plus This is a custom indicator created to give Traders a full view of what is going on in the market. It uses a real time data to access the market and display every bit of information needed to make successful trading. The PLUS there to produce the kind of RESULTS as you see in the SCREENSHOTS, I added a MultipleOrder Utility EA with it with instructions on how to use it with FFXMV Dashboard. INSTALLATION : Read the MANUALS that comes with the rest of the
        850 USD
        Volume by Price MT4
        Brian Collard
        5 (14)
        The Volume by Price Indicator for MetaTrader 4 features Volume Profile and Market Profile TPO (Time Price Opportunity). Get valuable insights out of currencies, equities and commodities data. Gain an edge trading financial markets. Highest quality real-time and historical price data distributions. Versatile range selection methods. Drag and drop with time/price option. Unlimited segmentation. Session filtering with built-in presets for New York, London, Tokyo, Sydney and São Paulo. Composites w
        149.95 USD
        This indicator is a super combination of our 2 products  Advanced Currency IMPULSE with ALERT  and  Currency Strength Exotics . It works for all time frames and shows graphically impulse of strength or weakness for the 8 main currencies plus one Symbol! This Indicator is specialized to show currency strength acceleration for any symbols like Gold, Exotic Pairs, Commodities, Indexes or Futures. Is first of its kind, any symbol can be added to the 9th line to show  true currency strength accelerat
        149 USD
        Ns_Geometric Chart Scale for MT4-Gann Grid,Gann Square & Gann box...To Draw any Geometric Shapes and Gann grid. #Forex Currecnies Pairs-Place same number & decimal in Gann Grid. if Commodities & Cryptocurrencies chart scale shows 0.66/66 same Scale for GannGrid ,for Gann square/Gann scale-66/660 Box only Numbers. #If Stocks & Index sale display - 3.03 that means Same scale input 3.03 for  Gann Grid and 303 for Gann Square & Gann Box Scale. Video Links :- https://youtu.be/Wnzq2-65GG4           
        599 USD
        Please send me Direct message on MQL5 CHAT after purchasing the Indicator for Training and Installation Support There are some additional files that is important to use with the Indicator . So be sure to contact me after purchasing the Indicator So that I can add you for training and support . If you find any difficulty with installation then send me Direct message here So that I can connect with you via Anydesk or Teamview for the product installation. " Smart Order Block Indicator " to find
        249 USD
        Quantum Volume Point of Control Indicator
        QUANTUM TRADING SOFTWARE LIMITED
        5 (2)
        The Quantum VPOC indicator has been developed to expand the two dimensional study of volume and price, to a three dimensional one which embraces time. The volume/price/time relationship then provides real insight to the inner workings of the market and the heartbeat of sentiment and risk which drives the price action accordingly. The Quantum VPOC indicator displays several key pieces of information on the chart as follows: Volume Profile - this appears as a histogram of volume on the vertical pr
        197 USD
        TheStrat Monitor
        Robert Gerald Wood
        5 (1)
        If you've not already learnt about The Strat trading strategy , go google it now. I promise it won't be a waste of your time, and you will likely learn some new tricks whether you use it or not. OK, so now you know what TheStrat is, you will be able to understand what this indicator can do for you. Key Features In short, the Indicator will: Show Timeframe Continuity for all supported timeframes Supports two timeset views, Day trader and Swing trader Show when Full Timeframe Continuity is in pl
        150 USD
        TrendfollowerSR
        Paul Reymkhe
        4.91 (117)
        Take Your Trading Experience To the Next Level ! and get the exclusive TFSR-Analyzer for free !    So you have all these outstanding features  on up to 20 symbols and all timeframes in a smart and clear Design. Correct identification of the trends  in stock investments are pivotal and TrendFollowerSR ensures this perspective while displaying the correct trend on multiply timeframes to help you go long way as much as possible. The latest technology of the Indicator enables to track whether if
        149 USD
        MR Volume POC Levels 4
        Sergey Khramchenkov
        5 (3)
        The indicator was created for the "Masters of Risk" trading system.  The settings are compared with  volumes in NinjaTrader 8 terminal with CQG datafeed . The settings of EURUSD-6E , GBPUSD-6B , AUDUSD-6A and other currency pairs were compared.  Indicator shows the POC (Point of Control) volume levels for the selected period of time.   Point of Control (POC) are not lines, they are zones.  Which zones are relevant and which are not, is determined by the author's methodology.  Using the indicato
        150 USD
        Advanced Currency Strength Indicator The Advanced Divergence Currency Strength Indicator. Not only it breaks down all 28 forex currency pairs and calculates the strength of individual currencies across all timeframes , but, You'll be analyzing the WHOLE forex market in 1 window (In just 1 minute) . This indicator is very powerful because it reveals the true movements of the market.  It is highly recommended to  analyze charts knowing the performance of individual currencies or the countries ec
        149 USD
        Royal Scalping Indicator M4
        Vahidreza Heidar Gholami
        4.2 (5)
        Royal Scalping Indicator is an advanced price adaptive indicator designed to generate high-quality trading signals. Built-in multi-timeframe and multi-currency capabilities make it even more powerful to have configurations based on different symbols and timeframes. This indicator is perfect for scalp trades as well as swing trades. Royal Scalping is not just an indicator, but a trading strategy itself. Features Price Adaptive Trend Detector Algorithm Multi-Timeframe and Multi-Currency Trend Low
        149 USD
        MTF Supply Demand Zones
        Georgios Kalomoiropoulos
        4.8 (20)
        Next Generation Of Automated Supply And Demand Zones. New and Innovative Algorithm that Works At Any Chart. All Zones Are Being Created Dynamically According To Price Action Of The Market. BIG PROMO OFFER --> Pay 1 and get 5 copies of "MTF SUPPLY DEMAND ZONES" indicator Activations will go from 5 to 25  (valid till the end of October) If you get the MTF Supply Demand Zones you can join the " Trade Like Me " Video Series. It contains 14 Live Sessions where  i am placing trades on Forex, Sto
        149 USD
        Introduction to EFW Analytics EFW Analytics was designed to accomplish the statement "We trade because there are regularities in the financial market". EFW Analytics is a set of tools designed to maximize your trading performance by capturing the repeating fractal geometry, known as the fifth regularity in the financial market. The functionality of EFW Analytics consists of three parts. Firstly, Equilibrium Fractal Wave Index is an exploratory tool to support your trading logic to choose which r
        200 USD
        Full Forex Market View Dashboard
        Opengates Success International
        5 (2)
        FULL FOREX MARKET VIEW Dashboard Indicator This is a custom indicator created to give Traders a full view of what is going on in the market. It uses a real time data to access the market and display every bit of information needed to make successful trading. INSTALLATION : Before attaching this Indicator to your window chart, go to your MT4's Market Watch panel and HIDE all the Currency pairs you don't need or trade and leave the rest there. The reason is that FFMV Dashboard will DISPLAY ALL the
        650 USD
        Beast Super Signal
        Dustin Vlok
        4.78 (100)
        Purchase this indicator and get the Beast Super Signal EA valued at $449 for FREE!  (Full product purchase only). Looking for a powerful forex trading indicator that can help you identify profitable trading opportunities with ease? Look no further than the Beast Super Signal. This easy-to-use trend-based indicator continuously monitors the market conditions, searching for new developing trends or jumping in on existing ones. The Beast Super Signal gives a buy or sell signal when all internal
        189 USD
        Gann Dynamic Square
        Naveen Saroha
        5 (1)
        INTRODUCING WORLD'S FIRST MT4 & MT5  Gann Dynamic Square, Circle and Equilateral Triangle  To Analyze Market Geometric Relationship. Gann Dynamic Square  has some of the most impressive features you will ever find in Gann & Geometric Analysis world. The Gann Dynamic Square is a tool to draw offset Square,Equilateral Triangle & Circle.Most charting software or MT4/MT5 market indicators don't have these features. You will be able draw your Geometric shapes like a professional geometric analys
        399 USD
        WORLD'S FIRST AUTO SCALED GANN PERCENTAGES CHANEL AND GANN GRID                                                                     W.D. Gann Grid With auto Scale & Percentage Change.. Gann Grid is unique concept to finding major turning points  and Support/resistance level Our tools has additional feature for Scale point input method and price percentage method to use any stock and commodities charts scale. Normally people are using fix grid for a
        300 USD
        The signal conditions are a combination of three indicators, and XQ Forex Indicators only display  medium and long-term trends . The indicator's efficacy has been improved with the addition of a filter that blocks out false signals. The XQ Forex Indicator can be used on FX pairs, CFDs, and Cryptocurrencies . There are two type of signals:  Buy or Sell and Big Long or Big Short It is possible to enable sending emails when a major trend-change signal is detected, as well as to display the alerts
        179 USD
        VTrende Pro mt4
        Andrey Dyachenko
        VTrende Pro MT4 - MTF indicator for trend trading with a display panel for MT5 *** Videos can be translated into any language using subtitles (video language - Russian) Although the signals of the VTrende Pro indicator can be used as signals of a full-fledged trading system, it is recommended to use them in conjunction with the Bill Williams TS. VTrende Pro  MT4 is an extended version of the VTrende indicator. Difference between Pro version and VTrende: - Time zones - Signal V - signal 1-
        697 USD
        Quantum Trends Indicator
        QUANTUM TRADING SOFTWARE LIMITED
        1 (1)
        One of the oldest maxims in trading is ‘let the trend be your friend’. You must have come across it! This is easier said than done! First, you have to identify one, then you have to stay in – not easy. Staying in a trend to maximise your profits is extremely difficult. In addition, how do you know when a trend has started? It’s very easy to look back and identify the trend. Not so easy at the live edge of the market. The Quantum Trends indicator is the ‘sister’ indicator to the Quantum Trend Mon
        197 USD
        Order Block Indicator MT4
        Diego Arribas Lopez
        5 (2)
        [ MT5 Version ] Order Block Indicator MT4 Order Block Indicator MT4  is currently the most accurate and customizable indicator in the market. It has been developed to facilitate the analysis of operations based on Order Blocks and Supply and Demand Zones. These zones are possible reversal points of a movement. Order Blocks indicate a possible accumulation of orders in one area. The price usually gets to reach and react strongly to those areas. The most relevant levels for this reaction are the c
        224 USD
        Introduction to Fractal Pattern Scanner Fractal Indicator refers to the technical indicator that makes use of the fractal geometry found in the financial market. Fractal Pattern Scanner is the advanced Fractal Indicator that brings the latest trading technology after the extensive research and development work in the fractal geometry in the financial market. The most important feature in Fractal Pattern Scanner is the ability to measure the turning point probability as well as the trend probabi
        185 USD
        Introduction Excessive Momentum Indicator is the momentum indicator to measure the excessive momentum directly from raw price series. Hence, this is an extended price action and pattern trading. Excessive Momentum Indicator was originally developed by Young Ho Seo. This indicator demonstrates the concept of Equilibrium Fractal Wave and Practical Application at the same time. Excessive Momentum detects the market anomaly. Excessive momentum will give us a lot of clue about potential reversal and
        200 USD
        The Nihilist 5.0 Indicator includes Forexalien and Nihilist Easy Trend trading strategies and systems. It is composed of an MTF Dashboard where you can analyze the different input possibilities of each strategy at a glance. It has an alert system with different types of configurable filters. You can also configure which TF you want to be notified on your Metatrader 4 platform and Mobile application The indicator has the option to view how could be a TP and SL by using ATR or fixed points, even
        299 USD
        More from author
        CURRENTLY 26% OFF Best Solution for any Newbie or Expert Trader! This Indicator is a unique, high quality and affordable trading tool because we have incorporated a number of proprietary features and a new formula. With only ONE chart you can read Currency Strength for 28 Forex pairs! Imagine how your trading will improve because you are able to pinpoint the exact trigger point of a new trend or scalping opportunity? User manual: click here That's the first one, the original! Don't buy a worthle
        148 USD
        Advanced Currency IMPULSE with ALERT
        Bernhard Schweigert
        4.93 (458)
        CURRENTLY 31% OFF !! Best Solution for any Newbie or Expert Trader! This indicator is a unique, high quality and affordable trading tool because we have incorporated a number of proprietary features and a secret formula. With only ONE chart it gives Alerts for all 28 currency pairs. Imagine how your trading will improve because you are able to pinpoint the exact trigger point of a new trend or scalping opportunity! Built on new underlying algorithms it makes it even easier to identify and confir
        88 USD
        Currently 20% OFF ! Best Solution for any Newbie or Expert Trader! This dashboard software is working on 28 currency pairs. It is based on 2 of our main indicators (Advanced Currency Strength 28 and Advanced Currency Impulse). It gives a great overview of the entire Forex market. It shows Advanced Currency Strength values, currency speed of movement and signals for 28 Forex pairs in all (9) timeframes. Imagine how your trading will improve when you can watch the entire market using a single indi
        199 USD
        Advanced Supply Demand MT5
        Bernhard Schweigert
        4.36 (11)
        Best Solution for any Newbie or Expert Trader! This indicator is a unique, high quality and affordable trading tool because we have incorporated a number of proprietary features and a new formula. With this update, you will be able to show double timeframe zones. You will not only be able to show a higher TF but to show both, the chart TF, PLUS the higher TF: SHOWING NESTED ZONES. All Supply Demand traders will love it. :) Important Information Revealed Maximize the potential of Advanced Suppl
        199 USD
        Supply and Demand Dashboard PRO
        Bernhard Schweigert
        4.79 (19)
        Currently 20% OFF ! This dashboard is a very powerful piece of software working on multiple symbols and up to 9 timeframes. It is based on our main indicator (Best reviews:   Advanced Supply Demand ). The dashboard gives a great overview. It shows: Filtered Supply and Demand values including zone strength rating, Pips distances to/and within zones, It highlights nested zones, It gives 4 kind of alerts for the chosen symbols in all (9) time-frames. It is highly configurable for your personal
        199 USD
        This indicator is a super combination of our 2 products  Advanced Currency IMPULSE with ALERT  and  Currency Strength Exotics . It works for all time frames and shows graphically impulse of strength or weakness for the 8 main currencies plus one Symbol! This Indicator is specialized to show currency strength acceleration for any symbols like Gold, Exotic Pairs, Commodities, Indexes or Futures. Is first of its kind, any symbol can be added to the 9th line to show  true currency strength accelerat
        149 USD
        Currency Strength Exotics
        Bernhard Schweigert
        5 (23)
        CURRENTLY 20% OFF ! Best Solution for any Newbie or Expert Trader! This Indicator is specialized to show currency strength for any symbols like Exotic Pairs Commodities, Indexes or Futures. Is first of its kind, any symbol can be added to the 9th line to show true currency strength of Gold, Silver, Oil, DAX, US30, MXN, TRY, CNH etc. This is a unique, high quality and affordable trading tool because we have incorporated a number of proprietary features and a new formula. Imagine how your trading
        128 USD
        Best Solution for any Newbie or Expert Trader! This Indicator is an affordable trading tool because we have incorporated a number of proprietary features along with a new formula. The Advanced Accumulated Currency Volume Indicator is specialized for the main 28 Forex pairs and works on all time frames. It is a new formula that on a single chart extracts all the currency volume (C-Volume) of AUD, CAD, CHF, EUR, GBP, JPY, NZD, and USD. This is a great advantage in trading. Volume traders will know
        58 USD
        Best Solution for any Newbie or Expert Trader! This Indicator is a unique, high quality and affordable trading tool because we have incorporated a number of proprietary features and a new formula. With only ONE chart you can read Currency Strength for 28 Forex pairs! Imagine how your trading will improve because you are able to pinpoint the exact trigger point of a new trend or scalping opportunity? User manual:   click here That's the first one, the original! Don't buy a worthless wannabe clone
        128 USD
        My Trade History PRO
        Bernhard Schweigert
        5 (3)
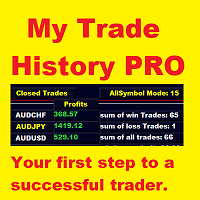
        CURRENTLY 20% OFF !! Best Solution for any Newbie or Expert Trader! Review your trades is the first step to a successful trader. Successful traders have a habit of regularly reviewing their trading performance. This tool will help you to do just that. The review process will be most effective with this tool to track your trading. Analyse your manual trades or the trades of your EA. Use the 3 general view. To switch between just click on the button. Closed Trades Open Trades Close+Open Trades A
        65 USD
        CURRENTLY 26% OFF !! This indicator is a super combination of both our main indicators ( Advanced Currency Strength 28 &  Advanced Currency IMPULSE with ALERT ). It shows Currency Strength values for TICK-UNITS and alert signals for 28 Forex pairs. 11 different Tick-Units can be used. Those are 1, 2, 3, 4, 5, 6, 10, 12, 15, 20, and 30 Seconds. The Tick-Unit bar in the sub-window will be shown and shifted to the left when there is at least 1 tick within the second’s timer.  With only ONE chart y
        148 USD
        Best Solution for any Newbie or Expert Trader! This indicator is a unique, high quality and affordable trading tool because we have incorporated a number of proprietary features and a secret formula. With only ONE chart it gives Alerts for all 28 currency pairs. Imagine how your trading will improve because you are able to pinpoint the exact trigger point of a new trend or scalping opportunity! Built on new underlying algorithms it makes it even easier to identify and confirm potential trades.
        128 USD
        My Trades in Pips
        Bernhard Schweigert
        4.67 (21)
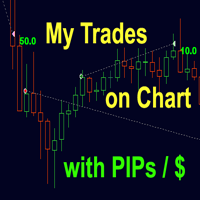
        A trading tool you do not want to miss. The indicator displays all trades/deals in the chart with the symbol it is attached to. It prints the number of pips in profit or loss. By choice it prints a vertical line through sub-windows for better analysis. Check also the PRO-version here:  My Trade History PRO As well it adds the information about the total result of trades in the deposit currency and the total pips. You can choose to show only the trades of the day or to show only trades within a n
        FREE
        Filter:
        BMG29
        180
        BMG29 2023.03.30 14:21 
         

        très utile !!!

        Solomon Ola
        113
        Solomon Ola 2023.03.26 11:29 
         

        I recommend this supply and demand to everyone trading is the best of the best I have been making money 💰 the moment I bought hit

        Bernhard Schweigert
        77272
        Reply from developer Bernhard Schweigert 2023.03.28 13:10
        We're so happy to hear that Advanced Supply Demand has been the best of the best for you! Thank you for your support and review. 💖
        Reinaldo Ivan Santiago Perez
        260
        Reinaldo Ivan Santiago Perez 2023.03.06 05:20 
         

        best indis i have try so far so much money lost but finnaly have what i need thanks

        Bernhard Schweigert
        77272
        Reply from developer Bernhard Schweigert 2023.03.17 11:33
        Thank you for taking the time to share your positive experience with our indicators. We are so glad to hear that they have been helpful for you. 👍
        Oleg Moiseyenko
        145
        Oleg Moiseyenko 2023.03.04 00:06 
         

        Respect to the author for his work in creating indicators to facilitate trading. I especially want to note the support. In combination with the use of three indicators, success is guaranteed. I’v been using the second year, no complaints, 5 stars rating

        Bernhard Schweigert
        77272
        Reply from developer Bernhard Schweigert 2023.03.07 12:30
        Thank you for your kind review! It's great to hear that our indicators have been helpful for your trading and that you've been using them for two years without any issues. We appreciate your support and your 5-star rating! If you ever have any questions or need any assistance, please don't hesitate to reach out to us.
        Outta Maway
        167
        Outta Maway 2023.03.03 19:12 
         

        I'm updating my review now that I have CS28 and CS Impulse. I have spent the last 4 weeks studying the indicators as well as reading the guides on how to use these together, and backtesting different ideas. I've since created a trade plan and moved to a live account.

        First of all, I have never thought about reading the market with a bunch of coloured lines. However I've realised that I can have all the information I need to know e.g what pair to trade, when to enter, where to put SL, when to breakeven and when to exit (my trade plan) all from these 3 indicators. To make life even easier, I just wait for an Impulse alert, then just check whether there is a pullback that meets a certain criteria in a strong daily trend on CS28. Once that's met I check S&D for areas of concern. Trading the combination of H1 and D1 is providing me with a few trade setups per week.

        Alison Carrera
        167
        Alison Carrera 2023.03.02 05:20 
         

        I loved it! Thanks ;D

        Joseph Eastwind
        56
        Joseph Eastwind 2023.02.20 16:10 
         

        Advanced Supply and Demand is an addition to CS28 and CS28 IMPULSE with Alert, another market killer from Bernhard. I encourage every trader to have it. It depicts the zones of supply and demand, allowing you to enter and exit my trade, putting a right TP and SL. Man, this is heaven on earth. Great and professional tool. It is time for many others to fly. Great job Bernhard! 5 stars for sure!!!

        Bernhard Schweigert
        77272
        Reply from developer Bernhard Schweigert 2023.02.25 11:28
        Thank you for your amazing review! Your kind words mean a lot to us, and we're thrilled to know that the tool has been a valuable asset to your trading. 💖
        top_trader_in_the_world
        54
        top_trader_in_the_world 2023.02.03 05:16 
         

        This indicator is PURE gold. Knowing where the levels are at makes a huge difference. Just couple this with the ACS28 and it will all start to unfold. I love both!

        Bernhard Schweigert
        77272
        Reply from developer Bernhard Schweigert 2023.02.07 15:06
        Thank you very much for your excellent review, friend! 💖
        Mammoth999
        70
        Mammoth999 2023.01.31 12:40 
         

        Bernhard' AC28 and AC28 Impulse indicators have impressed me, so I was confident in adding his Supply Demand indicator to my trading tools basket. It's still early days for this newest purchase to fully prove it's worth, but it is working in confluence with my own assessment of trades to take or avoid.

        cutter44
        142
        cutter44 2023.01.29 05:15 
         

        got this quite awhile ago I never seem to get the settings right its either 200 zones or none I'm sure it works for most people its got a ton of cool features I just can't seem to get it. everything works great otherwise. really cool I always mess with it but I dunno wish it had a set file.

        MAKSIM SAROKIN
        162
        MAKSIM SAROKIN 2023.01.28 00:15 
         

        Doubled my deposit in 5 days. Thanks to Bernhard Schweigert. I hope the indicator and support will last a long time)

        Bernhard Schweigert
        77272
        Reply from developer Bernhard Schweigert 2023.01.31 10:45
        Thanks so much for the great review, friend! I wish you more success in your trading career. 💖
        Morteza Rahmani
        76
        Morteza Rahmani 2023.01.18 13:59 
         

        The best indicator I bought!

        Bernhard Schweigert
        77272
        Reply from developer Bernhard Schweigert 2023.02.15 15:37
        Thanks for the "best indicator you bought" ! 👍💖
        passyjh
        204
        passyjh 2023.01.16 13:28 
         

        Great indicator, highly recommended.

        MJ Torres
        71
        MJ Torres 2023.01.10 18:21 
         

        amazing indicator. it save me time drawing the supply & demand zones...Im already half way my target on a PAID 100k prop firm evaluation using this indicator.

        Bernhard Schweigert
        77272
        Reply from developer Bernhard Schweigert 2023.01.12 14:02
        It is a pleasure to read your excellent review, friend! Wishing you the best of luck with your PAID 100k prop firm evaluation! 💖
        Ck.
        721
        Ck. 2023.01.05 06:36 
         

        Excellent product, I'll practice to use it correctly. for now it looks good for me.

        mtsncbl1704
        476
        mtsncbl1704 2023.01.03 20:25 
         

        Die von diesem Indikator angezeigten Pegel sind außergewöhnlich genau. Erstaunlicher Indikator. So viele Einstellungen. Einfach zu bedienen und genau richtig!

        Children of
        39
        Children of 2022.12.30 21:33 
         

        Hands Down, this is One of the best Indicators I came across, it does everything it needs to do exceptionally well!

        Bernhard Schweigert
        77272
        Reply from developer Bernhard Schweigert 2023.01.20 22:13
        Thanks for the great review! 👍
        Shane Moore
        98
        Shane Moore 2022.12.30 02:15 
         

        I have been using this indicator for little while now, and it is amazing how accurate this thing is. I am literally watching the market react as it hits the supply and demand zones on the screen. This is going to become a must use tool for my trading.

        Bernhard Schweigert
        77272
        Reply from developer Bernhard Schweigert 2023.01.02 16:41
        Thank you for your review 🙏
        JACK_LE_CHAT
        270
        JACK_LE_CHAT 2022.12.22 07:28 
         

        The levels displayed by this indicator are exceptionally accurate. I benchmarked them against those displayed by other indicators of same type, extremely few came close in terms of preciseness, and no other tool displays as many features. They update in real time, are logic, and they follow the price evolution on any time frame. Every parameters can be tuned to one's liking to match whatever trading strategy. A pleasure to work with, and a must have to trade in conjunction with the other amazing indicators developed by M. Schweigert.

        Bernhard Schweigert
        77272
        Reply from developer Bernhard Schweigert 2022.12.22 20:04
        Your wonderful review is much appreciated, my friend! Wishing you a successful trading career. 💖
        Server Suleyman
        40
        Server Suleyman 2022.12.16 08:22 
         

        Hello. I just bought the indicator and I couldn't install it on the mt4 platform. It does not install on the mt4 platform. can you help me with this?

        Bernhard Schweigert
        77272
        Reply from developer Bernhard Schweigert 2022.12.16 09:40
        Welcome friend, I have sent you an email.
        Reply to review
        Version 5.9 2023.03.22
        Our indicator has been updated with more improvements. We made overall enhancements to its functionality.

        We highly recommend that you update your indicator to take advantage of these improvements. This will ensure that you are using the latest version of our software and that you can benefit from the latest enhancements and features.

        If you need assistance with the update process or have any questions, please do not hesitate to contact us. We are always here to help.
        Version 5.8 2023.02.24
        We are proud to announce that our Supply and Demand Zone Indicator continues to be the highest rated tool of its kind in the market. Our team has worked hard to develop and refine this powerful tool, and we believe it will help you identify profitable trading opportunities with greater accuracy.
        With the recent release of the new Metatrader version, we have made various improvements to ensure that our software continues to integrate seamlessly with this popular trading platform. These changes include performance enhancements, so you can expect even smoother and more reliable performance from our indicators.
        Version 5.7 2023.01.24
        Please update to Version 5.7

        Best rated Supply and Demand Zone Indicator in the Market.

        Various improvements for new Metatrader version.

        Please keep your indicators up to date. It's free.
        Version 5.6 2022.12.22
        Various improvements for new Metatrader version.
        Please update.
        Version 5.5 2022.11.21
        Best rated Supply and Demand Zone Indicator in the Market.
        Various improvements.
        Please update.
        Version 5.4 2022.10.21
        Added more improvements.
        Updating is recommended.
        Version 5.3 2022.09.22
        Added more improvements,
        Updating is recommended.

        Version 5.2 2022.08.20
        More improvements.
        Please update.
        Version 5.1 2022.07.21
        Best rated Supply and Demand Zone Indicator in the Market.
        Various improvements.
        Please update.
        Version 5.0 2022.06.22
        Various improvements for new Metatrader version.
        Version 4.9 2022.05.18
        A useful feature has been added at the request of a trader.
        A trader can have only buy or sell preferences for an instrument. This selects the alarms that are chosen. The graph and alert when entering a zone are unaffected.

        ==== General Alert Settings ====
        New input:
        + Traders preference alerts buy-sell-both

        Please update.
        Version 4.8 2022.04.20
        Various improvements.
        Please update.
        Version 4.7 2022.03.20
        Various improvements.
        Please update.
        Version 4.6 2022.02.18
        Various improvements.
        Please update.
        Version 4.5 2022.01.17
        Various improvements for new Metatrader version.
        Please update.
        Version 4.4 2021.12.17
        Various improvements.
        Please update.
        Version 4.3 2021.11.18
        More improvements.
        A "Must" update.
        Another bridge for EA import has been added.
        Version 4.2 2021.10.11
        Best rated Supply and Demand Zone Indicator in the Market.
        Various improvements.
        Please update.
        Version 4.1 2021.08.23
        Various improvements.
        Version 4.0 2021.06.13
        IMPORTANT UPDATE!
        VERSION 4 !!!
        Version 3.7 2021.05.09
        Various improvements.
        Version 3.6 2021.03.14
        Best rated Supply and Demand Zone Indicator in the Market.
        Various improvements for new Metatrader version.
        Version 3.5 2020.10.20
        MAJOR UPDATE 2020 SERIES 03
        ==================

        The new update brings:
        MODIFICATION FOR ZONE SIZE (optional)

        Some traders of supply and demand zones asked for a new function. It was added optionally: Including a wick for the width of the supply and demand zones.

        New input:
        + Include wick 1 for the zone size
        By default, the function is not used. To use the function, you must set the new input = true (the selection is also copied to the higher time frame).
        Since the zones will be wider, some zones could be filtered. You may want to use lower XY factors.

        This is possibly the last update from a 2020 series.
        From now on I will add the new features to "Supply and Demand Dashboard PRO".
        Version 3.4 2020.10.10
        The new update brings:
        1) Graphical improvements and
        2) Some traders of supply and demand zones requested a new function. It was added optionally: Draw supply and demand zones only at major highs and lows.
        New input:
        + use only major highs and lows
        By default, the function is not used. To use the function, you must set the new input = true. (The choice will be copied to the higher timeframe as well.
        To show all zones at highs and lows you might want to set all XY-factors = 1.0, but it can be combined.)
        Version 3.3 2020.10.04
        MAJOR UPDATE 2020
        ==================

        Added optional: Supply and Demand zones with ENGULFING BARS pattern at the beginning of the zone.
        Use reversal candle color for bar 1 or bar 2 (the one before). Use either ones or both.
        Use true engulfing pattern for above mentioned bars. (Must choose above.)

        By default the use is false. To use the function you must set the new inputs = true.

        New inputs:
        ==== Candle pattern
        + use reversal candle color bar 1
        + use reversal candle color bar 2 (both or either)
        + use true engulfing pattern (choose above)
        Version 3.2 2020.09.17
        Various improvements and graphic options for counter of broken zones.
        Version 3.1 2020.07.23
        Thanks to client report, fixed an issue with show old zones and number of broken Sup/Dem in a row.
        Version 3.0 2020.02.10
        Added zone size info in point. As requested by trader.
        It will show in the right corner of the rectangles. The size of the higher timeframe is shifted a few bars to the left.
        new inputs:
        === Chart settings
        + show zone size (point)
        + show zone size MTF (point)

        associated inputs:
        + color price labels
        === other settings
        + font size zone
        + Label font 1
        Version 2.90 2020.01.14
        Various improvements.
        Version 2.80 2019.10.18
        At the request of a trader:
        Added room in points for HIT-alert. Now the trader can receive an earlier alert when price is NEAR a zone. Then he can take action or watch. This input should be applied according to the symbol and timeframe. The trader can make it bigger to suit his needs. The default value is 5 points. (10 point = 1 pip.)
        new input:
        + room in points for HIT-alert
        Version 2.70 2019.09.21
        1) A new alert for a fake (or false) breakout has been added with several variables:
        new inputs:
        ==== FBO Alert settings
        + Alert Fake Breakout (FBO)
        + FBO min bar Size Point
        + FBO bar closes back % (20-90)
        + FBO pattern bar count (1-3)

        2) For old zones a new candle limit was added. If there is a strong trend, zones with only 2000 bars lookback may not be within range. Therefore, this limit has been increased to 5000. But so far we don't have to draw old zones. Therefore, a new limit has been added for old zones with 1000 bars.
        new input:
        + Show Bars back for old zones

        3) Now you can edit the size for arrow as requested by trader.
        new input:
        + reverse candle arrow size (1 to 5)
        Version 2.60 2019.05.29
        1) Optimized some issue with old zones and counter.

        2) As requested by a trader the reversal arrow will now only draw on nested zones if the filter "alert only nested" is true.

        3) A new filter for alerts has been added to alert only if the zone is new or untouched. (Excluding break alert.)
        New input:
        + reverse candle: use only new zones (default = false)
        To activate the filter set above input to true;

        4) A new candle limit has been added for old zones. If there is a strong trend the zones might not be in range with only 2000 bars look back. So this limit was set higher to 5000 bars. But we do not need to draw old zones so far. That's why a new limit for old zones has been added. (Default = 1000 bars.)
        New input:
        + show Bars back for old zones
        Version 2.50 2019.04.25
        Optimized diverse functions and graphics.
        Version 2.40 2018.12.06
        Optimized XY-filter for higher timeframe MTF.
        To make sure the higher timeframe filters out weak S/D zones the same way as the lower timeframe (chart) does.
        Also you can setup different values for each timeframe.
        Default values are now set to:
        + min X-factor of price travel away (ATR) = 1.4
        + min Y-factor of price travel away (zone size) = 2
        Version 2.30 2018.11.04
        New features added!

        Added an optional filter to alert only nested zones. (The lower timeframe zone must be within a higher timeframe zone.)
        It applies to all 3 actual alerts (hit - reverse - break).
        If turned off the alerts will still tell if the alerted zone was nested or not.
        New input:
        + alert only NESTED zones! (within MTF)

        Added an optional pause in seconds for less CPU use. (Set to 0 to turn it off) At least on each new candle new zones will be checked.
        New input:
        + pause runs in seconds to next update (for less CPU use) (0=not)
        Version 2.20 2018.10.25
        Added a new visual option for higher timeframe zones rectangles.
        If the square is not filled and the width is 1 it can be used as dashed/dotted etc...

        New input below other settings:
        + rectangle line style MTF (width must be 1)
        Version 2.10 2018.10.01
        Added XY-filter for higher timeframe.
        If you want the higher timeframe to show like before set XY-filter MTF = 1.0

        New input parameters:
        ==== MTF settings
        + min HTF!-candles before a zone is printed
        + min X-factor of price travel away (ATR) MTF
        + min Y-factor of price travel away (zone size) MTF

        Added pre-name for objects. In case you want to use the indicator twice on a chart, enter here a letter for the 2nd.

        New input parameters:
        ==== other settings
        + prename for additional objects
        Version 2.0 2018.09.25
        Version 2.0 - 2018.09.24
        Final upgrade with faster calculations.
        It just got hypersonic speed to draw all levels and zones !!!

        + added "usePIN" for developments (Global variables)
        Gives access to the first 5 supply and demand zones (outer price, inner price, if it is used or not, the timeframe, and the symbol).

        Version 1.22 2017.07.17
        Added an input to draw the higher timeframe squares extended to the right to not cover the live candle.
        Optimized alerts.
        Minimized CPU usage with a timer.
        Reorganized inputs.

        New input parameters:
        + draw rectangle extended over live candle (1 to 5 bars)
        + zone print delay seconds for redraw (5 to 60 sec)
        Version 1.14 2017.04.24
        On customers request, I added different colors for broken (old) zones.
        + color supply old
        + color demand old
        Repeating alerts on M1 are been fixed.
        Version 1.13 2017.03.30
        With this update, we have a small add for better graphic.
        Now you can choose empty squares for the higher timeframe (MTF) and edit the line width. This makes it graphically easier to differentiate between chart timeframe zones and higher timeframe zones.
        + rectangle style full MTF (default=false)
        + rectangle width (1-5) MTF (default=3)
        The colors have been modified for the higher TF to be more beautiful.
        Version 1.12 2017.03.16
        With this update, you will be able to show double time frame zones. You will not only be able to show a higher TF but to show both, the chart TF, PLUS the higher TF: SHOWING NESTED ZONES.

        Indicator parameters added:
        ==== MTF settings
        + ADD higher TF
        + higher TF period (or one more if chart TF)
        + show inner price labels MTF
        + show outer price labels MTF
        + limited size of a big zone. Max factor (ATR) MTF
        + color supply MTF
        + color supply used MTF
        + color demand MTF
        + color demand used MTF
        + color price labels MTF
        + size price labels MTF
        Version 1.11 2017.02.06
        Corrected count of broken supply/demand zones and start of daily lines.