• Overview
  • Reviews (4)
  • Comments (60)
  • What's new

Norepaint Harmonic Patterns with minimal Lag

4.67

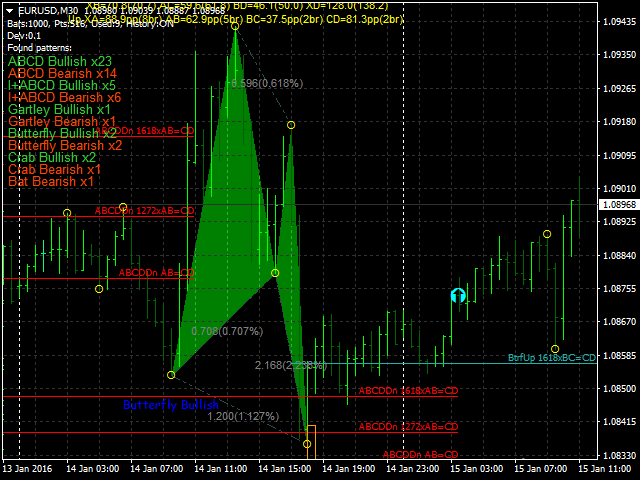
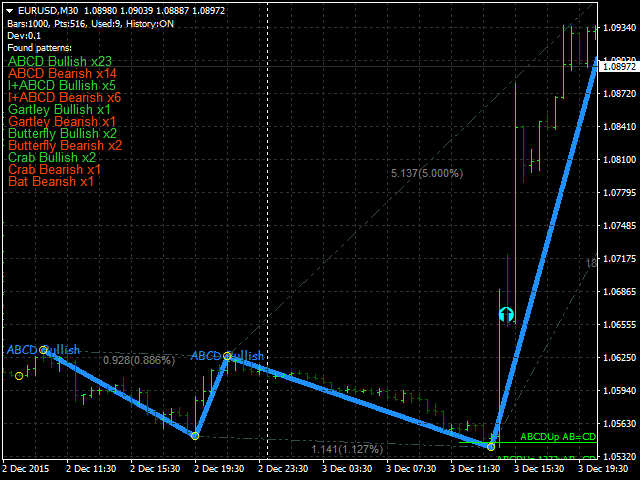
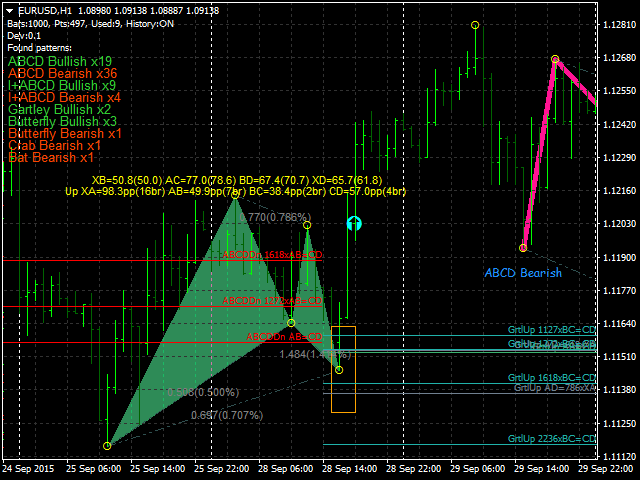
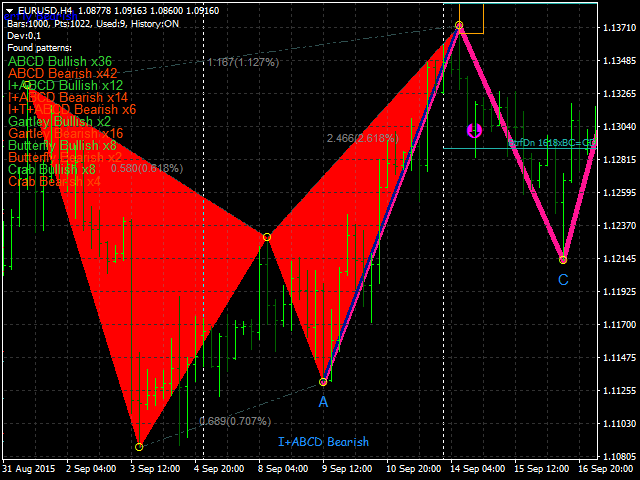
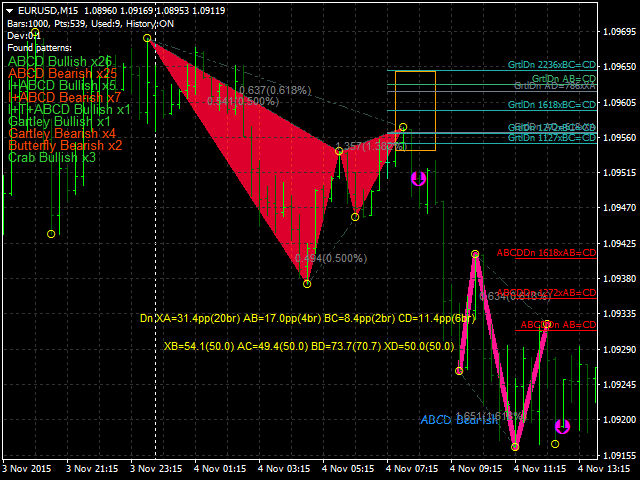
The indicator shows harmonic patterns on the chart without repainting with the minimum possible lag. The search for indicator tops is based on the wave principle of price analysis.

Advanced settings allow you to choose parameters for your trading style. At the opening of a candle (bar), when a new pattern is formed, an arrow of the probable direction of the price movement is fixed, which remains unchanged.

The indicator recognizes the following patterns and their varieties: ABCD, Gartley (Butterfly, Crab, Bat), 3Drives, 5-0, Batman, SHS, One2One, Camel, Triangles, WXY, Fibo, Vibrations. By default, only ABCD and Gartley figures are displayed in the settings. Many additional configurable parameters.

Main Parameters:
  • ShowUpDnArrows - show/hide probable direction arrows
  • ArrowUpCode - up arrow code
  • ArrowDnCode - down arrow code
  • Show old history patterns - enable/disable display of outdated patterns
  • Enable alert messages, actual if history OFF - enable/disable alerts when patterns appear/change (only when history is disabled)
  • Enable alert notification, actual if alert messages is enabled - enable/disable notifications (MQ ID) when patterns appear/change (only when history is disabled)
  • Enable alert mail, actual if alert messages is enabled - enable/disable e-mail when patterns appear/change (only when history is disabled)
  • Enable alert sounds, actual if history OFF - enable/disable audio signals when patterns appear/change (only when history is disabled)
  • AlertsSoundFileName - signal sound file name
  • Back color - background color
  • Main text color - main text color
  • Main text font size - main text font size
  • PeriodLowest - period for the extrema search algorithm
  • DivLLPeriod - separator of a period for the extrema search algorithm
  • LLMethod1 - extrema search algorithm averaging (method 1)
  • LLMethod2 - extrema search algorithm averaging (method 2)
  • LLPrice1 - price type 1 for the extrema search algorithm
  • LLPrice2 - price type 2 for the extrema search algorithm
  • TriggerSensivity - smoothing filter sensitivity (or its minimum limitation when using the option in dynamic mode)
  • UseDynamicSensivity - enable/disable dynamic filtration
  • DynamicSensivityPeriod - dynamic filtration period
  • DynamicSensivityMul - dynamic filtration ratio
  • UseMinSensivityFilterForDynamic - enable/disable the minimum sensitivity threshold during dynamic filtration (the value is included into TriggerSensivity)
  • DrawPnts - enable/disable display of extrema values
  • ArrowCode - extrema value symbol code
  • Limit points to search patterns - amount of extrema points for searching for patterns

All indicator parameters can be found here: https://c.mql5.com/31/679/params-eng.zip

Reviews 4
Zentrader2015
1470
Zentrader2015 2017.12.08 21:32 
 

The best Harmonic indicator, no repaint!!

amfels07
493
amfels07 2017.04.18 18:16 
 

Update: So far 3 out of 3 winners using 1H and 4H ABCD patterns using your indicator..........very easy to use well done sir!!!

Great work on this indicator........ A+++

Recommended products
Trade with Gann on your side!! MASTER CIRCLE 360 CIRCLE CHART, originally created by Gann admitted that this is “The Mother of all charts”. It is one of the last studies that this great trader left for us. The numeric tab le is apparently quite simple like all the tables and is based on square numbers, the SQUARE OF 12 and is by evolution, one of the most important square numbers. Here we can find CYCLE, PRICE AND TIME thanks to angles and grades, to show past and future support and resistance.
Master Scalping M1 is an innovative indicator that uses an algorithm to quickly and accurately determine the trend.The indicator calculates the time of opening and closing positions, the indicator's algorithms allow you to find the ideal moments to enter a deal (buy or sell an asset), which increase the success of transactions for most traders. Benefits of the indicator: Easy to assemble, does not overload the chart with unnecessary information. Can be used as a filter for any strategy. Works on
Noize Absorption Index MT4
Ekaterina Saltykova
5 (1)
Noize Absorption Index - is the manual trading system that measures the difference of pressure between bears forces and bulls forces. Green line - is a noize free index that showing curent situation. Zero value of index shows totally choppy/flat market.Values above zero level shows how powerfull bullish wave is and values below zero measures bearish forces.Up arrow appears on bearish market when it's ready to reverse, dn arrow appears on weak bullish market, as a result of reverse expectation. S
Owl smart levels
Sergey Ermolov
4.63 (54)
MT5 version  |  FAQ The Owl Smart Levels Indicator  is a complete trading system within the one indicator that includes such popular market analysis tools as  Bill Williams' advanced fractals , Valable ZigZag which builds  the correct wave structure  of the market, and  Fibonacci levels  which mark the exact levels of entry into the market and places to take profits. Detailed description of the strategy Instructions for working with the indicator Advisor-assistant in trading Owl Helper Private
RTrends
Nikolay Likhovid
The RTrends indicator does two things: first, it automatically draws the layout of the price chart by plotting trend lines and, secondly, it produces bearish and bullish signals. The layout reflects the fractal nature of the market. Trends from different time horizons are applied simultaneously on the chart. Thus, from a single chart a trader can see trend lines of higher timeframes. The lines, depending on the horizon, differ in color and width: the older the horizon, the thicker the line is. T
Infinity Trend Pro
Yaroslav Varankin
1 (1)
This is a trend indicator without redrawing Developed instead of the binary options strategy (by the color of the Martingale candlestick) Also works well in forex trading When to open trades (binary options) A signal will appear in the place with a candle signaling the current candle It is recommended to open a deal for one candle of the current timeframe M1 and M5 When a blue dot appears, open a deal up When a red dot appears, open a trade down. How to open trades on Forex. When a signal is rec
Point61 Indicator
Evgeniy Machok
5 (1)
The Point61 indicator is the result of many years of monitoring of price behavior of currency pairs and metals. It is not a secret, that in times of uncertainty, traders are looking for possible levels of support and resistance - the point, where price should stop its movement. There are 2 possible scenarios at these points: 1. Reverse (correction) to the opposite direction; 2. Breakthrough to continue movement. Very often these points are used to set stop orders - TakeProfit or
Monster Harmonic Indicator
Paul Geirnaerdt
4.61 (31)
Monster Harmonics Indicator is a harmonic pattern indicator. It recognizes Gartley, Bat, Crab, Butterfly, Cypher, White Swan, Black Swan, Shark and several other patterns. Projected patterns that are not yet completed are recognized, too. Monster even shows the PRZ (Potential Reversal Zone). Users can add their own user defined patterns to Monster. Besides the current pattern, Monster also shows all patterns in the symbols history. Monster will provide alerts for developing patterns. Introduced
The Th3Eng PipFinite indicator is based on a very excellent analysis of the right trend direction with perfect custom algorithms. It show the true direction and the best point to start trading. With StopLoss point and Three Take Profit points. Also it show the right pivot of the price and small points to order to replace the dynamic support and resistance channel, Which surrounds the price. And Finally it draws a very helpful Box on the left side on the chart includes (take profits and Stop loss
TWO PAIRS SQUARE HEDGE METER INDICATOR Try this brilliant 2 pairs square indicator It draws a square wave of the relation between your two inputs symbols when square wave indicates -1 then it is very great opportunity to SELL pair1 and BUY Pair2 when square wave indicates +1 then it is very great opportunity to BUY pair1 and SELL Pair2 the inputs are : 2 pairs of symbols         then index value : i use 20 for M30 charts ( you can try other values : 40/50 for M15 , : 30 for M30 , : 10 for H1 ,
Daily Candle Predictor is an indicator that predicts the closing price of a candle. The indicator is primarily intended for use on D1 charts. This indicator is suitable for both traditional forex trading and binary options trading. The indicator can be used as a standalone trading system, or it can act as an addition to your existing trading system. This indicator analyzes the current candle, calculating certain strength factors inside the body of the candle itself, as well as the parameters of
An indicator of pattern #31 ("Long Island") from Encyclopedia of Chart Patterns by Thomas N. Bulkowski. The second gap is in the opposite direction. Parameters: Alerts - show alert when an arrow appears   Push - send a push notification when an arrow appears (requires configuration in the terminal) GapSize - minimum gap size in points ArrowType - a symbol from 1 to 17 ArrowVShift - vertical shift of arrows in points   ShowLevels - show levels ColUp - color of an upward line ColDn - color of
All Symbols   AND  All Time frames Scan                                                                                                                 Document Introduction   The ABCD is a basic harmonic pattern. The ABCD pattern is a visual, geometric chart pattern comprised of three consecutive price swings. It looks like a diagonal lightning bolt and can indicate an upcoming trading opp
The indicator provides a superior alternative to price action analysis. It enables the identification of normalized patterns, which are then transformed into a graphical representation to forecast future steps within a time series. In the top-left corner, you'll find information regarding the expected prediction accuracy, determined through a complex MSQE calculation. You have the flexibility to adjust the time window, making it easy to validate the indicator's performance. Additionally, you can
The indicator displays the data of the Stochastic oscillator from a higher timeframe on the chart. The main and signal lines are displayed in a separate window. The stepped response is not smoothed. The indicator is useful for practicing "manual" forex trading strategies, which use the data from several screens with different timeframes of a single symbol. The indicator uses the settings that are identical to the standard ones, and a drop-down list for selecting the timeframe. Indicator Parame
Fibonacci retracement and extension line drawing tool Fibonacci retracement and extended line drawing tool for MT4 platform is suitable for traders who use  golden section trading Advantages: There is no extra line, no too long line, and it is easy to observe and find trading opportunities Trial version: https://www.mql5.com/zh/market/product/35884 Main functions: 1. Multiple groups of Fibonacci turns can be drawn directly, and the relationship between important turning points
What are Heiken Ashi Candles? Heiken Ashi, derived from the Japanese term 'Heikin Ashi,' translates to average price bars. It's an indicator depicting price bars on a chart. Formula for Heiken Ashi candles: - Heiken Ashi opening price: (previous candle's opening + closing price) / 2 - Closing price Heiken Ashi: (opening + high + low + closing) / 4 - Heiken Ashi peak: Max of high, opening, or closing price - Heiken Ashi bottom price: Min of low, opening, or closing price How to Read Heik
Wave Wolf MT4
Andrei Salanevich
The Wave Wold MT4 Forex indicator is designed to search for Wolf waves and display them in the current window of the trading terminal. An excellent indicator for traders who use Wolf waves in trading. Its application in trading strategies will significantly increase their efficiency and profitability. INFORMATION ABOUT THE INDICATOR Unlike other Wolf wave indicators, the Wave Wold MT4 forex indicator has a number of features that significantly increase its effectiveness: The first is the
Chart Patterns Detect 15 patterns (Ascending Triangle, Descending Triangle, Rising Wedge, Falling Wedge, Bullish Flag, Bearish Flag, Bullish Rectangle, Bearish Rectangle Symmetrical triangle, Head and Shoulders, Inverted Head and Shoulders, Triple top, Triple Bottom, Double Top, Double Bottom) Use historical data to calculate the probability of each pattern to succeed (possibility to filter notification according to the chance of success) gives graphic indication about the invalidation level and
VR Cub
Vladimir Pastushak
VR Cub is an indicator for getting high-quality entry points. The indicator was developed to facilitate mathematical calculations and simplify the search for entry points into a position. The trading strategy for which the indicator was written has been proving its effectiveness for many years. The simplicity of the trading strategy is its great advantage, which allows even novice traders to successfully trade with it. VR Cub calculates position opening points and Take Profit and Stop Loss targe
Forex Gump
Andrey Kozak
2.83 (6)
Forex Gump is a fully finished semi-automatic trading system. In the form of arrows, signals are displayed on the screen for opening and closing deals. All you need is to follow the instructions of the indicator. When the indicator shows a blue arrow, you need to open a buy order. When the indicator shows a red arrow, you need to open a sell order. Close orders when the indicator draws a yellow cross. In order to get the most effective result, we recommend using the timeframes H1, H4, D1. There
Старый, добрый "AP" в версии трендового осциллятора. Это простой индикатор, который использует максимум возможностей языка MQL4. Но при этом он работает достаточно быстро даже на процессорах 1 Гигагерц и менее. При анализе следует обращать внимание на пересечение уровня 50, если вы намеренны использовать его как трендовый индикатор. Индикатор не перерисовывает, и работает на всех типах графиков и таймфреймах. Сделаны основные возможности оповещения, оповещения работают в обоих направлениях
Trend Master Chart MT4
Frederic Jacques Collomb
Trend Master Chart is the trend indicator you need. It overlays the chart and uses color coding to define different market trends/moves. It uses an algorithm that combines two moving averages and different oscillators. The periods of these three elements are modifiable. It works on any time-frame and any Pair. At a glance you will be able to identify an upward or downward trend and the different entry points into this trend. For example during a marked upward trend (light green color) the dif
FREE
ZhiBiCCI MT4
Qiuyang Zheng
5 (1)
[ZhiBiCCI] indicators are suitable for all cycle use, and are also suitable for all market varieties. [ZhiBiCCI] Green solid line is a reversal of bullish divergence. The green dotted line is a classic bullish divergence. [ZhiBiCCI] The solid line to the red is a reverse bearish divergence. The red dotted line is a classical bearish divergence. [ZhiBiCCI] can be set in the parameters (Alert, Send mail, Send notification), set to (true) to send instant signals to the alarm window, email, in
Super Gator
Agustinus Biotamalo Lumbantoruan
This indi shows the following 1. Supertrend 2. Alligator (Not a regular alligator) 3. ZigZag 4. Moving Average 5. Trend Continuation/Mini correction Signal (plotted in X) (See screenshots in green background color 6. Early Signal Detection (See screenshots in green background color) You may treat Alligator as the lagging indicator The leading indicator is the supertrend. The zig zag is based on the leading indicator where it gets plotted when the leading indicator got broken to the opposite.
Market Breaker Updated version 3
Allistair Kabelo Mandow
1 (1)
Features for software Main functions: Accurate entry signals WITHOUT REPAINTING! Once a signal appears, it remains valid! This is a significant distinction from repainting indicators that might provide a signal and then alter it, potentially leading to deposit losses. Now, you can enter the market with higher probability and precision. There's also a function to colour candles after an arrow appears until the target (take profit) is reached or a reversal signal appears . Display of STOP LOSS
The CCI Divergence is a reasonably useful indicator in itself, but it is even more effective when used with divergence pattern trading. The CCI Divergence indicator signal is one of the most potent signals among the indicators that exist in the market. Here is new version for Divergence Indicator using CCI method, with more improvements. Divergences indicate a potential investment point because the directional moment does not confirm the price. A bullish divergence occurs when the underlying
Trendiness Index
Libertas LLC
5 (3)
"The trend is your friend" is one of the best known sayings in investing, because capturing large trendy price movements can be extremely profitable. However, trading with the trend is often easier said than done, because many indicators are based on price reversals not trends. These aren't very effective at identifying trendy periods, or predicting whether trends will continue. We developed the Trendiness Index to help address this problem by indicating the strength and direction of price trend
The indicator detects and displays Shark harmonic pattern (see the screenshot). The pattern is plotted by the extreme values of the ZigZag indicator (included in the resources, no need to install). After detecting the pattern, the indicator notifies of that by a pop-up window, a mobile notification and an email. The indicator highlights the process of the pattern formation and not just the complete pattern. In the former case, it is displayed in the contour triangles. After the pattern is comple
Forex Indicator  " Shooting Star pattern" for MT4 Indicator  " Shooting Star pattern "  is very powerful indicator   for Price Action trading :    No repaint, No delays; Indicator   detects bearish Shooting Star patterns  on chart:    Red arrow signal on chart (see pictures) P C, Mobile & Email alerts   are included Indicator    " Shooting Star pattern"  is excellent to   combine with Support/Resistance  Levels:  https://www.mql5.com/en/market/product/100903 // More great Expert Advisors and Ind
Buyers of this product also purchase
Gann Made Easy
Oleg Rodin
4.96 (45)
Gann Made Easy is a professional and easy to use Forex trading system which is based on the best principles of trading using the theory of mr. W.D. Gann. The indicator provides accurate BUY and SELL signals including Stop Loss and Take Profit Levels. You can trade even on the go using PUSH notifications. PLEASE CONTACT ME AFTER PURCHASE TO GET MY TRADING TIPS PLUS A GREAT BONUS! Probably you heard already many times about Gann trading methods. Usually Gann's theory is very complex thing not only
Atomic Analyst
Issam Kassas
5 (1)
First of all Its worth emphasizing here that this Trading Indicator is   Non-Repainting ,   Non-Redrawing   and   Non-Lagging   Indicator, Which makes it ideal from both manual and robot trading.  The Atomic Analyst  is a PA Price Action Indicator that uses Strength and Momentum of the price to find a better edge in the market. Equipped with Advanced filters which help remove noises and false signals, and Increase Trading Potential. Using Multiple layers of complex Indicators, the Atomic Anal
TPSproTREND PrO
Roman Podpora
5 (15)
TPSpro TRENDPRO  - is a trend indicator that automatically analyzes the market and provides information about the trend and each of its changes, as well as giving signals for entering trades without redrawing! The indicator uses each candle, analyzing them separately. referring to different impulses - up or down impulse. Exact entry points into transactions for currencies, crypto, metals, stocks, indices!  -  Version MT5               DETAILED DESCRIPTION        /       TRADING SETUPS           
Introducing   Quantum Trend Sniper Indicator , the groundbreaking MQL5 Indicator that's transforming the way you identify and trade trend reversals! Developed by a team of experienced traders with trading experience of over 13 years,   Quantum Trend Sniper Indicator   is designed to propel your trading journey to new heights with its innovative way of identifying trend reversals with extremely high accuracy. ***Buy Quantum Trend Sniper Indicator and you could get Quantum Breakout Indicator fo
Scalper Vault
Oleg Rodin
5 (27)
Scalper Vault is a professional scalping system which provides you with everything you need for successful scalping. This indicator is a complete trading system which can be used by forex and binary options traders. The recommended time frame is M5. The system provides you with accurate arrow signals in the direction of the trend. It also provides you with top and bottom signals and Gann market levels. The indicator provides all types of alerts including PUSH notifications. Please contact me aft
TPSpro RFI Levels
Roman Podpora
5 (13)
A key element in trading is zones or levels from which decisions to buy or sell a trading instrument are made. Despite attempts by major players to conceal their presence in the market, they inevitably leave traces. Our task was to learn how to identify these traces and interpret them correctly. Reversal First Impulse levels (RFI)   -  Version MT5                INSTRUCTIONS                 RUS                 ENG                                       R ecommended to use with an indicator   -  
CURRENTLY 26% OFF Best Solution for any Newbie or Expert Trader! This Indicator is a unique, high quality and affordable trading tool because we have incorporated a number of proprietary features and a new formula. With only ONE chart you can read Currency Strength for 28 Forex pairs! Imagine how your trading will improve because you are able to pinpoint the exact trigger point of a new trend or scalping opportunity? User manual: click here That's the first one, the original! Don't buy a worthle
First of all Its worth emphasizing here that this Trading Tool is Non-Repainting Non-Redrawing and Non-Lagging Indicator Which makes it ideal for professional trading . The Smart Price Action Concepts Indicator is a very powerful tool for both new and experienced traders . It packs more than 20 useful indicators into one combining advanced trading ideas like Inner Circle Trader Analysis and Smart Money Concepts Trading Strategies . This indicator focuses on Smart Money Concepts providing in
Currently 20% OFF ! Best Solution for any Newbie or Expert Trader! This dashboard software is working on 28 currency pairs plus one. It is based on 2 of our main indicators (Advanced Currency Strength 28 and Advanced Currency Impulse). It gives a great overview of the entire Forex market plus Gold or 1 indices. It shows Advanced Currency Strength values, currency speed of movement and signals for 28 Forex pairs in all (9) timeframes. Imagine how your trading will improve when you can watch the e
Entry Points Pro
Yury Orlov
4.7 (224)
Top indicator for MT4 providing accurate signals to enter a trade without repainting! Watch  the video  (6:22) with an example of processing only one signal that paid off the indicator! It can be applied to any financial assets:  forex, cryptocurrencies, metals, stocks, indices.  MT5 version is here   It will provide pretty accurate trading signals and tell you when it's best to open a trade and close it. Most traders improve their trading results during the first trading week with the help of t
Advanced Supply Demand
Bernhard Schweigert
4.92 (310)
CURRENTLY 26% OFF !! Best Solution for any Newbie or Expert Trader! This indicator is a unique, high quality and affordable trading tool because we have incorporated a number of proprietary features and a new formula. With this update, you will be able to show double timeframe zones. You will not only be able to show a higher TF but to show both, the chart TF, PLUS the higher TF: SHOWING NESTED ZONES. All Supply Demand traders will love it. :) Important Information Revealed Maximize the potenti
XQ Indicator MetaTrader 4
Marzena Maria Szmit
3 (2)
Step into the realm of Forex trading with confidence and precision using XQ, a cutting-edge Forex indicator designed to elevate your trading game to unprecedented heights. Whether you're a seasoned trader or just stepping into the world of currency exchange,   XQ Forex Indicator   empowers you with the insights and signals needed to make informed trading decisions. The signal conditions are a combination of three indicators, and XQ Forex Indicator only display  medium and long-term trends . The
TrendMaestro
Stefano Frisetti
5 (2)
note: this indicator is for METATRADER4, if you want the version for METATRADER5 this is the link: TRENDMAESTRO recognizes a new TREND in the bud, he never makes mistakes. The certainty of identifying a new TREND is priceless. DESCRIPTION TRENDMAESTRO identifies a new TREND in the bud, this indicator examines the volatility, volumes and momentum to identify the moment in which there is an explosion of one or more of these data and therefore the moment in which prices have strong probability of f
Introducing the Miraculous Forex Indicator: Unleash the Power of Precision Trading Are you tired of searching for the perfect forex indicator that truly delivers exceptional results across all time frames? Look no further! The Miraculous Forex Indicator has arrived to revolutionize your trading experience and propel your profits to new heights. Built upon a foundation of cutting-edge technology and years of meticulous development, the Miraculous Forex Indicator stands as the pinnacle of str
FX Power MT4 NG
Daniel Stein
5 (8)
Trading GOLD, and currencies, with the dog walk strategy  - super smart Trading GOLD, and currencies, with the breakout strategy  - super easy Visit our all-new   Stein Investments Welcome Page   to get the latest information, updates and trading strategies. FX Power MT4 NG  is the next generation of our long-time very popular currency strength meter, FX Power.  And what does this next-generation strength meter offer? Everything you have loved about the original FX Power  PLUS GOLD/XAU stre
Multiccurrency and multitimeframe Buy and Sell alerts. Auto trailing stop and risk reward takeprofit. The indicator scans and analizing the market so You have nothing to do. trade all your currency pairs in 1 chart! When addig it to a chart change the timeframes and find the best timeframe for that curreency pair chart with the signals! Every pair is different! Strategy:  When the FIRST Buy or SEll arrow appears that is your entry.( The alert panel will alert you on each pair and timeframes you
Quantum Breakout Indicator PRO
Bogdan Ion Puscasu
4.96 (26)
Introducing   Quantum Breakout PRO , the groundbreaking MQL5 Indicator that's transforming the way you trade Breakout Zones! Developed by a team of experienced traders with trading experience of over 13 years, Quantum Breakout PRO is designed to propel your trading journey to new heights with its innovative and dynamic breakout zone strategy. Quantum Breakout Indicator will give you signal arrows on breakout zones with 5 profit target zones and stop loss suggestion based on the breakout box.
Currency Strength Wizard is a very powerful indicator that provides you with all-in-one solution for successful trading. The indicator calculates the power of this or that forex pair using the data of all currencies on multiple time frames. This data is represented in a form of easy to use currency index and currency power lines which you can use to see the power of this or that currency. All you need is attach the indicator to the chart you want to trade and the indicator will show you real str
PRO Renko System
Oleg Rodin
5 (24)
PRO Renko System is a highly accurate trading system specially designed for trading RENKO charts. The ARROWS and Trend Indicators DO NOT REPAINT! The system effectively neutralizes so called market noise giving you access to accurate reversal signals. The indicator is very easy to use and has only one parameter responsible for signal generation. You can easily adapt the tool to any trading instrument of your choice and the size of the renko bar. I am always ready to provide extra support to help
TrendDecoder Premium
Christophe, Pa Trouillas
5 (3)
Identify ranges  | Get earliest signals of Trends  | Get clear exits before reversal  | Spot the Fibo levels the price will test Non-repainting, non-delayed indicator - ideal for manual and automated trading - for all assets and all time units $69   for launch - then back to >>   $149 After purchase,   please contact me on this channel   for recommended and personalised settings MT5   version:  Click here Get our full method with  BladeSCALPER  and   PowerZONES What is it about? TrendDECOD
This indicator I use with RENKO and RangeBar candle Discover the Secret to Successful Forex Trading with Our Custom MT4 Indicator! Have you ever wondered how to achieve success in the Forex market, consistently earning profits while minimizing risk? Here is the answer you've been searching for! Allow us to introduce our proprietary MT4 indicator that will revolutionize your approach to trading. Unique Versatility Our indicator is specially designed for users who prefer Renko and Rangebar candle
TakePropips Donchian Trend Pro
Eric John Pajarillaga Aldana
4.82 (17)
TakePropips Donchian Trend Pro  (MT4) is a powerful and effective tool that automatically detects the direction of the trend using the Donchian Channel and provides you with an entry and exit trading signals! This multi-function indicator includes a trend scanner, trading signals, statistical panel, screener, trading sessions, and alerts history dashboard. It is designed to provide you with trading signals and save you hours analyzing the charts! You can download the user manual and installation
Scalper Inside PRO
Alexey Minkov
4.75 (55)
SALE NOW! Limited Time Offer! An exclusive indicator that utilizes an innovative algorithm to swiftly and accurately determine the market trend. The indicator automatically calculates opening, closing, and profit levels, providing detailed trading statistics. With these features, you can choose the most appropriate trading instrument for the current market conditions. Additionally, you can easily integrate your own arrow indicators into Scalper Inside Pro to quickly evaluate their statistics and
FX Volume
Daniel Stein
4.6 (35)
Visit our all-new   Stein Investments Welcome Page   to get the latest information, updates and trading strategies. FX Volume is the FIRST and ONLY volume indicator that provides a REAL insight into the market sentiment from a broker's point of view. It provides awesome insights into how institutional market participants, like brokers, are positioned in the Forex market, much faster than COT reports. Seeing this information directly on your chart is the real game-changer and breakthrough solut
Cycle Sniper
Elmira Memish
4.41 (34)
NEW YEAR SALE PRICE FOR LIMITED TIME!!! Please contact us after your purchase and we will send you the complimentary indicators to complete the system Cycle Sniper is not a holy grail but when you use it in a system which is explained in the videos, you will feel the difference. If you are not willing to focus on the charts designed with Cycle Sniper and other free tools we provide, we recommend not buying this indicator. We recommend watching the videos about the indiactor and system before pu
Shepherd Harmonic Pattern
Abdullah Alrai
4.68 (59)
This indicator will detect harmonic patterns that are drawn on the chart by manual and automatic methods. You can see user manual from this link: Notes Indicator has control panel and it will save every (chart & timeframe) settings. You can minimize it to have more space on chart and you can press close button to hide all indicator data on chart if you prefer to work with other analysis tools  When you use this indicator and change the settings, add indicators like Moving Average or Bollinger
First of all Its worth emphasizing here that this Trading System is Non-Repainting, Non-Redrawing and Non-Lagging Indicator, Which makes it ideal for professional trading. The "Smart Support and Resistance Trading System" is an advanced indicator tailored for  new  and  experienced  traders. It empowers traders with precision and confidence in the forex market. This comprehensive system combines 7+ strategies, 10 indicators, and various trading approaches, including day trading strategy, swing
RelicusRoad Pro
Relicus LLC
4.78 (139)
How many times have you bought a trading indicator with great back-tests, live account performance proof with fantastic numbers and stats all over the place but after using it, you end up blowing your account? You shouldn't trust a signal by itself, you need to know why it appeared in the first place, and that's what RelicusRoad Pro does best! NOW $147 (increasing to $499 after a few updates) - UNLIMITED ACCOUNTS (PCs or MACs) **  User Manual + Strategies + Training Videos + Private Group with
M1 Arrow
Oleg Rodin
5 (13)
M1 Arrow is an indicator which is based on natural trading principles of the market which include volatility and volume analysis. The indicator can be used with any time frame and forex pair. One easy to use parameter in the indicator will allow you to adapt the signals to any forex pair and time frame you want to trade. The Arrows DO NOT REPAINT and DO NOT LAG! The algorithm is based on the analysis of volumes and price waves using additional filters. The intelligent algorithm of the indicato
ICT, SMC, SMART MONEY CONCEPTS, SMART MONEY, Smart Money Concept, Support and Resistance, Trend Analysis, Price Action, Market Structure, Order Blocks, BOS/CHoCH,   Breaker Blocks ,  Momentum Shift, Supply&Demand Zone/Order Blocks , Strong Imbalance, HH/LL/HL/LH,    Fair Value Gap, FVG,  Premium  &   Discount   Zones, Fibonacci Retracement, OTE, Buy Side Liquidity, Sell Side Liquidity, BSL/SSL Taken, Equal Highs & Lows, MTF Dashboard, Multiple Time Frame, BigBar, HTF OB, HTF Market Structure,  L
More from author
The utility is designed to change the symbol of the current, all or selected charts, change the timeframe , as well as to synchronously move through the history of all charts (automatically or by clicking the button). The list of symbols is read from the "Market Watch" or is set manually. The color, size and position of the buttons are customizable. Synchronization of charts occurs according to the time of the first visible bar when you press the "SYNC" button or when moving the mouse/keyboard i
This is a linear indicator of a currency power having the ability to filter by smoothing values. It shows the current power of selected currencies (the maximum number is 8), as well as historical values. Calculation depends on the selected chart timeframe the indicator is launched at. The indicator displays data as lines for all currencies or as a histogram for the current currency pair. The intersection of the currency strength indices for the current currency pair is additionally displayed as
Mini Charts MT5
Sergey Efimenko
4.91 (23)
The indicator displays minimized charts of any symbol from any timeframe. The maximum number of displayed charts is 28. The charts can be located both in the main and bottom window. Two display modes: candles and bars. Amount of displayed data (bars and candles) and chart sizes are adjustable. To work with a mini chat, you must first put the desired indicator(s) on a regular chart, then save it as a template and apply a template for the mini chart via the appropriate parameter, for example, for
FREE
The utility is designed to   change the symbol   of the current, all or selected charts,   change the timeframe , as well as to   synchronously move through the history   of all charts (automatically or by clicking the button). The list of symbols is read from the "Market Watch" or is set manually. The color, size and position of the buttons are customizable. Synchronization of charts occurs according to the time of the first visible bar when you press the "SYNC" button or when moving the mouse/
Mini Charts
Sergey Efimenko
4.29 (14)
The indicator displays minimized charts of any symbol from any timeframe. The maximum number of displayed charts is 28. The charts can be located both in the main and bottom window. Two display modes: candles and bars. Amount of displayed data (bars and candles) and chart sizes are adjustable. Parameters: Corner - display start corner (selected from the list) CandleMode - display mode: true - candles, false - bars ShowLastBid - enable/disable the last price display LastBidShiftX - last price lin
FREE
CPM Extended MT5
Sergey Efimenko
4.43 (7)
The algorithm is based on the idea of the Currency Power Meter indicator. In this version, the number of displayed values is unlimited, its code is more compact and fast, values of the current bar can be obtained through indicator buffers. What the indicator shows : a thin band and the upper number in front of the currency shows the relative strength index for the last N hours (N is set in the parameters in the variable 'Hours'), a wider band shows the daily index. The more currency pairs using
FREE
CPM Extended
Sergey Efimenko
4.6 (20)
The algorithm is based on the idea of the Currency Power Meter indicator. In this version, the number of displayed values is unlimited, its code is more compact and fast, values of the current bar can be obtained through indicator buffers. What the indicator shows : a thin band and the upper number in front of the currency shows the relative strength index for the last N hours (N is set in the parameters in the variable 'Hours'), a wider band shows the daily index. The more currency pairs using
FREE
The indicator displays harmonic patterns on the chart based on Dynamic ZigZag ( https://www.mql5.com/en/market/product/5356 ) and is almost a complete analog of one of the versions of well-known korHarmonics. The indicator recognizes the following patterns and their varieties: ABCD, Gartley (Butterfly, Crab, Bat), 3Drives, 5-0, Batman, SHS, One2One, Camel, Triangles, WXY, Fibo and Vibrations. Only display of ABCD and Gartley patterns is enabled in the settings by default. The reverse line allows
This is a linear indicator of a currency power having the ability to filter by smoothing values. It shows the current power of selected currencies (the maximum number is 8), as well as historical values. Calculation depends on the selected chart timeframe the indicator is launched at. The indicator displays data as lines for all currencies or as a histogram for the current currency pair. The intersection of the currency strength indices for the current currency pair is additionally displayed as
The indicator allows you to determine the current price direction and market volatility. This version of the Traders Dynamic Index (TDI) has the redrawing of the historical data eliminated, the algorithm calculation speed optimized, more external parameters for a more precise adjustments, and its functionalities extended: added the selection of the initial oscillator and the smoothing methods of the averages. Parameters: Mode Osc - estimation oscillator selection; Period Osc - the calculation
Unique "scalping" trend indicator with the feature of multi-layered smoothing of the resulting lines and a wide selection of parameters. It helps determine a probable change in the trend or a correction virtually near the very beginning of the movement. The toggled intersection arrows are fixed and appear at the opening of a new bar, but, with enough experience, it is possible to look for entry opportunities as soon as the indicator lines intersect at the unfinished bar. The signal appearance l
This is an MTF indicator of support and resistance levels based on Advanced ZigZag Dynamic and/or Extended Fractals indicator extremums with price labels (can be disabled). More higher TFs can be selected for MTF mode. By default, the levels are generated based on ZigZag indicator dots. Fractals indicator dots can also be used together with ZigZag or instead of it. In order to simplify the use and save CPU time, calculation is performed once per each bar at its opening. Parameters: ForcedTF - ch
If you trade by levels, then this indicator is for you. The indicator displays support and resistance levels for the selected timeframes, additionally showing how many points to the nearest levels, as well as between which levels the current price is in the form of a color scale and percentages. Location anywhere on the chart, the ability to scale, the calculation offset taking into account the hourly difference of your broker, the choice of colors and other parameters will allow you to cus
News on chart
Sergey Efimenko
5 (1)
The indicator shows the schedule of economic news releases on the chart. News is loaded using a free utility that you can download   here .   The calendar is loaded once at the beginning of the week. You can customize the list of required countries (currencies). The news is divided into 4 categories of importance: high, medium, low and others. By default, the indicator displays data for the current week. There are 4 offset buffers available in the indicator, which can be used as a news filter w
The utility is designed for automatic loading of data necessary for functioning of News on chart indicator which is a calendar from forexfactory. Parameters: Use common folder - download files to the public file folder for all terminals \Terminal\Common\Files\. If false , download data to the 'files' folder of the current terminal. First day - news download start date. Leave 0 (01.01.1970 00:00) to download the current data only. Calendar url - address of the source data website to be added to t
FREE
Extended Fractals
Sergey Efimenko
5 (1)
The indicator expands the capabilities of standard fractals, allows you to find, display and use them, calculating for any odd length, that is, 3 (DeMark points), 5, 7, 9 and so on bars. Fractals can be calculated not only by bar prices, but also by the values of moving averages of a given period. All types of alerts are implemented in the indicators separately for upper and lower fractals. To set the number of used bars, the Left fractal bars count variable is set in the settings (the default
Extended version of the "Keltner Channel" indicator. This is an analytical tool that allows you to determine the ratio of the price position relative to its volatility. You can use 26 types of moving average and 11 price options to calculate the middle line of the indicator. Configurable alerts will notify you when the price touches the upper or lower border of the channel. Available average types: Simple Moving Average, Exponential Moving Average, Wilder Exponential Moving Average, Linear Weig
Advanced ZigZag Dynamic
Sergey Efimenko
4.5 (4)
The difference from the standard ZigZag indicator is the following: instead of calculating new extremum points based on the number of bars, it uses the distance between the high and the low to calculate the extremum points. In addition, this distance is calculated dynamically on default and depends on price fluctuations for a selected period and the multiplier. The distance can be set as a fixed number. In addition, it displays the reversal line, reaching which the previous extreme point is fix
An extended version of the well-known Moving Average Convergence / Divergence (MACD) indicator, distributed in 4 colors: growth, fall above and below 0. 26 options for smoothing moving averages, 11 types of prices. Disabled Alerts on color change with selectable alert mode: only when crossing a zero value or at any color change (rising / falling change and 0 crossing). Smoothing options: Simple, Exponential, Wilder Exponential, Linear Weighted, Sine Weighted, Triangular, Least Square, Smoothed,
I offer Stochastic indicator (oscillator) with signal line filtration by means of the Adaptive Moving Average (АМА). I also added a function of multicolor signal line display of increase and decrease by means of lines or dots at the discretion. Moreover, you can highlight signal line values located below the specified minimum level or above the specified maximum level. Parameters: PeriodK - period K of Stochastic oscillator Slowing - period of Stochastic oscillator slowing PriceField - Stochasti
CCI with AMA filtering
Sergey Efimenko
5 (1)
I offer you Commodity Channel Index (CCI) indicator (oscillator) with additional filtration by means of the Adaptive Moving Average (АМА). This technical indicator determines the strength or weakness of Bullish and Bearish trends. Its principle is based on the analysis of the current change in the deviation of the price from its average value for a given period with the filtering of the obtained values using the Kaufman algorithm, built on the basis of an exponentially smoothed moving average an
The indicator automatically calculates and plots Fibonacci support and resistance levels - one of the most effective tools for market analysis. The calculation uses the averaged price data for the selected period and timeframe. The minimum and maximum for this period are taken as the beginning and end of the movement. Fibonacci levels allow you to see potential reference points, around which the price movement can slow down or reverse, that is, they are used to predict further movement, as well
The indicator allows you to determine the current price direction and market volatility. This version of the Traders Dynamic Index  (TDI) has the redrawing of the historical data eliminated, the algorithm calculation speed optimized, more external parameters for a more precise adjustments, and its functionalities extended: added the selection of the initial oscillator and the smoothing methods of the averages. Parameters: Mode Osc - estimation oscillator selection; Period Osc - the calculation p
Advanced Power Trend
Sergey Efimenko
5 (2)
Unique "scalping" trend indicator with the feature of multi-layered smoothing of the resulting lines and a wide selection of parameters. It helps determine a probable change in the trend or a correction virtually near the very beginning of the movement. The toggled intersection arrows are fixed and appear at the opening of a new bar, but, with enough experience, it is possible to look for entry opportunities as soon as the indicator lines intersect at the unfinished bar. The signal appearance li
The uniqueness of this indicator lies in the volume accounting algorithm: accumulation occurs directly for the selected period without reference to the beginning of the day. The last bars can be excluded from the calculation, then the current data will have less influence on the significant levels (volumes) formed earlier. For a more accurate calculation, data from the M1 graph is used by default. The step of distribution of price volumes is regulated. By default, the right border of the display
This is a linear indicator of a currency power (correlation) having the ability to filter by smoothing values. It shows the current power of 8 major currencies, as well as historical values without redrawing. It is based on a custom algorithm. A basic currency pair is used for the calculation basis; the currency pair can differ from the current chart symbol. The result depends on the selected chart timeframe the indicator is launched at and on the basic currency pair. The indicator works with an
True SSRC nrp
Sergey Efimenko
5 (2)
The indicator shows (optional): Spearman's rank correlation coefficient, Pearson's linear correlation coefficient, Kendall's rank correlation coefficient, and Fechner's sign correlation coefficient. This oscillator shows the points of possible market reversal when the price goes beyond the overbought and oversold levels. There are 4 methods for additional filtering of the obtained values: simple, exponential, smoothed, linearly weighted. After the bar is closed, the values are fixed and not rep
The indicator expands the capabilities of standard fractals, allows you to find, display and use them, calculating for any odd length, that is, 3 (DeMark points), 5, 7, 9 and so on bars. Fractals can be calculated not only by bar prices, but also by the values of moving averages of a given period. All types of alerts are implemented in the indicators separately for upper and lower fractals. To set the number of used bars, the Left fractal bars count variable is set in the settings (the default
This is an extended version of Keltner channel. You can use 21 types of Moving Average and 11 methods of calculating the indicator's center line. Moving Average types: Simple Moving Average, Exponential Moving Average, Wilder Exponential Moving Average, Linear Weighted Moving Average, Sine Weighted Moving Average, Triangular Moving Average, Least Square Moving Average (or EPMA, Linear Regression Line), Smoothed Moving Average, Hull Moving Average by Alan Hull, Zero-Lag Exponential Moving Average
Filter:
drclpatel
340
drclpatel 2019.11.01 06:41 
 

why does the indicator keeps disappearing by itself?

Everytime I download it again, I find I have only limited amount of downloads allocated. does it means that I won't be allowed to download again after the limit though I actually have purchased the indicator?

Nicola Furini
945
Nicola Furini 2019.05.12 18:21 
 

User didn't leave any comment to the rating

Zentrader2015
1470
Zentrader2015 2017.12.08 21:32 
 

The best Harmonic indicator, no repaint!!

amfels07
493
amfels07 2017.04.18 18:16 
 

Update: So far 3 out of 3 winners using 1H and 4H ABCD patterns using your indicator..........very easy to use well done sir!!!

Great work on this indicator........ A+++

Reply to review
Version 1.7 2020.08.20
Added the ability to hide everything except the direction arrows after forming patterns.
Version 1.6 2020.03.07
Updated the algorithm for searching for wave vertices.
Version 1.5 2019.10.19
E-mail alerts added
Version 1.4 2019.06.12
The algorithm for searching extremums has been improved. This update is based on MQL5 version.
Version 1.3 2019.05.16
Изменён порядок параметров.
Version 1.2 2016.01.25
Included an additional check to see if the array size is exceeded when there is insufficient data in the quote history.
Version 1.1 2016.01.22
Fixed the calculation of the Fibonacci level vertices if there is insufficient data.