Watch the Market tutorial videos on YouTube
How to buy а trading robot or an indicator
Run your EA on
virtual hosting
virtual hosting
Test аn indicator/trading robot before buying
Want to earn in the Market?
How to present a product for a sell-through
Technical Indicators for MetaTrader 5 - 4

The Relative Strength Index (RSI), developed by J. Welles Wilder, is a momentum oscillator that measures the speed and change of price movements. The RSI oscillates between zero and 100. We have added to the reputable RSI indicator several types of alerts and a signal interval filter to be incorporated in your Expert Advisors. It works in ALL Timeframes ans instruments.
Product Features Email Alert Sound alert Push Notification (Alerts can be sent to your mobile phone) Signs on chart Aler
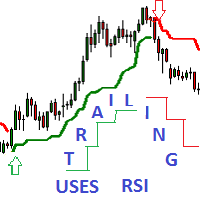
Adaptive Trailing uses RSI Indicator - an indicator of directional movement that allows you to determine the trend at the time of its inception and set the levels of a protective stop.
Trailing can be carried out both from below, when the stop level is below the current price and is pulled up behind the price if it increases, and above, when stop levels are above the current price.
There are two modes for calculating the stop level. Simple trailing is done with a constant distance of Npoint

Hello, pleasure to welcome you here, my name is Guilherme Santos. QB Indicator is the best indicator with easy to setup built-in RSI, truly a powerful tool! Basically its concept is to indicate entries in regions of market exhaustion. Just attach it with the default settings on any currency pair and watch the magic happen. Also try and other timeframes like M1 and M15. Some settings available: RSI Period RSI Overbought Limit RSI Oversold Limit when to buy When the indicator sets a green arrow on

The main idea of this product is to generate statistics based on signals from 5 different strategies for the Binary Options traders, showing how the results would be and the final balance based on broker's payout.
Strategy 1: The calculation is secret. Strategy 2: The signal is based on a sequence of same side candles (same color). Strategy 3: The signal is based on a sequence of interspersed candles (opposite colors). Strategy 4: The signal consists of the indicators bollinger (we have 3 typ

1. Why did I develop this series of indicators
I found that most traders need to use multiple time frame indicators. They usually switch time frame to see indicators. However, once the timeframe is switched, you cannot see the corresponding relationship between the price in the smaller timeframe and the indicator in the larger timeframe . For example: if your price chart is in H1 timeframe, you can see H4, D1 and W1 indicators in H1 timeframe Chart. This is more helpful for you to find t
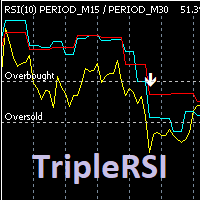
Индикатор отображает на графике данные RSI рабочего и двух старших тайм-фреймов, формирует сигналы выхода из зоны перекупленности / перепроданности кривой среднего временного периода. Опционально используется фильтр по данным старшего тайм-фрейма (расположение медленной линии выше средней для продажи и ниже средней - для покупки). Сигналы "подвального" индикатора дублируются на главном окне, отправляются сообщения во всплывающее окно, на почту и на мобильное устройство. Параметры индикатора: RSI

Inspired from, Time is the most important factor in determining market movements and by studying past price records you will be able to prove to yourself history does repeat and by knowing the past you can tell the future. There is a definite relation between price and time. -William Delbert Gann Caution: It's not HolyGrail System, It's a tool to give you insight of current market structure. The decision to trade is made only with combination of economical understanding of underlying instru
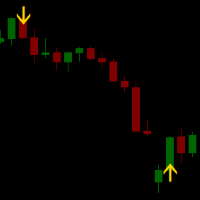
Signal RSI printa no gráfico os melhores momentos de entrada segundo o indicador RSI.
No gráfico aparecerá uma seta indicando o momento e a direção de entrada para a operação. O encerramento da operação se dá ao atingir o lucro esperado ou o stop. Se estiveres com uma operação aberta e aparecer outra seta de sentido inverso, inverta a mão e aproveite! Amplamente testado em gráficos de mini índice e mini dólar, bem como ações e FIIs.
Gráficos recomendados: 5, 10, 15 min.

Основная цель индикатора заключается в определении наиболее оптимальных точек входа в сделку и выхода из нее. Индикатор состоит из трех частей. Первая – это стрелки, показывающие оптимальные точки входа в сделку и выхода из нее. Стрелка вверх – сигнал на покупку, стрелка вниз – на продажу. В индикаторе заложен алгоритм аналитического анализа, который включает в себя множество показаний стандартных индикаторов, а также авторский алгоритм. Вторая часть – это информация в правом верхнем углу (работ

I recommend you to read the product's blog (manual) from start to end so that it is clear from the beginning what the indicator offers. This multi time frame and multi symbol indicator identifies when the stochastics signal line crosses the stochastics main line. As an alternative it can also alert when stochastics is leaving (without signal line crossing main line) an overbought/oversold area. As a bonus it can also scan for Bollinger bands and RSI overbought/oversold crosses. Combined wi

Currency Strength Meter is the easiest way to identify strong and weak currencies. This indicator shows the relative strength of 8 major currencies + Gold: AUD, CAD, CHF, EUR, GBP, JPY, NZD, USD, XAU. Gold symbol can be changed to other symbols like XAG, XAU etc.
By default the strength value is normalised to the range from 0 to 100 for RSI algorithm: The value above 60 means strong currency; The value below 40 means weak currency;
This indicator needs the history data of all 28 major curren
The Raschke Oscillator (LBR-RSI) indicator is the famous oscillator described in the book " Street Smarts: High Probability Short-term Trading Strategies " This indicator is perfect for a variety of researchs and it can be suitable to be used in combination with your own strategy just for trend trading or range-bound trading. The personal preference is to use it when the trend is not too strong, for example you can combine it with ADX to measure the strength of the trend and use it when ADX is b

Relative Strength Ratio (RSR)
The Relative Strength Ratio (RSR) indicator compares the performance of one security against another, dividing the base security by the comparative security, and showing the ratio of this division in a line c hart. This indicator is also known as the Relative Strength indicator, Price Relative , or Relative Strength Comparative .
It is one of the main tools for Intermarket Analysis professionals, to help them identify Sector Rotations and other global relations

I recommend you to read the product's blog (manual) from start to end so that it is clear from the beginning what the indicator offers. This multi time frame and multi symbol indicator scans for engulfing and tweezer formations. The indicator can also be used in single chart mode. Combined with your own rules and techniques, this indicator will allow you to create (or enhance) your own powerful system. Features Can monitor all symbols visible in your Market Watch window at the same time. A

Currency Strength Meter is the easiest way to identify strong and weak currencies. The indicator shows the relative strength of 8 major currencies: AUD, CAD, CHF, EUR, GBP, JPY, NZD, USD.
By default the strength value is normalised to the range from 0 to 100 for RSI algorithm: The value above 60 means strong currency; The value below 40 means weak currency;
The indicator is created and optimized for using it externally at an Expert Advisors or as a Custom Indicator inside your programs.

Индикатор построен на основе индикаторов VIX и RSI. Комбинация двух указанных индикаторов позволяет обнаруживать зоны крайней перепроданности, где цена с большой долей вероятности изменит направление. Наиболее сильные сигналы дает в периоды слабого тренда. Сигналом индикатора является изменение направления гистограммы (с роста на снижение) выше заданного (сигнального) уровня.
В индикаторе задан широкий спектр параметров, который позволяет оптимизировать индикатор для торговли любыми активами:
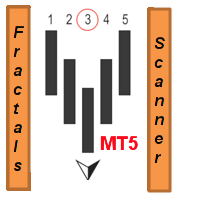
This multi time frame and multi symbol indicator identifies fractals patterns. As a bonus it can also scan for Parabolic SAR (pSAR) trend changes. Combined with your own rules and techniques, this indicator will allow you to create (or enhance) your own powerful system. Features
Can monitor all symbols visible in your Market Watch window at the same time. Apply the indicator to just one chart and instantly monitor the entire market. Can monitor every time frame, from M1 to MN, and sends you a r
Indicator summary Индикатор информационная панель отображает значения и торговые действия, а так же выводит сводную информацию о торговых действиях, основанных на 11 встроенных индикаторах. Встроенные индикаторы:
RSI (Relative Strength Index )- пересечение зоны перекупленности сверху вниз - сигнал на продажу. Пересечение зоны перепроданности снизу вверх - сигнал на покупку. При колебаниях в зоне между перекупленостью и перепроданостью сигнал формируется в зависимости от нахождения значения о

The indicator shows when there are overpricing and divergences over a normalized MACD Plus, it displays signals with configurable alerts, self-regulating dynamic overprice levels, and a simple setup and interface. The indicator that automatically calculates overprices ranges! MACDmaxmin is an indicator based on the MACD oscillator that effectively identifies trend changes in price, as it is a momentum indicator that captures the trend and shows the relationship between two moving averages of th
GG Signal Scanner ATR base on ATR, MA and RSI indicators to determine trade times and entry points. The indicator scans all currency pairs in Market Watch or according to the list of currency pairs. The entry points will be listed of alerts and sent to the phone or email. Indicators are for use on one chart only and should not be used in conjunction with other indicators. Indicator should be used for M15 - H1 - H4 timeframe. In the strategy tester, the indicator only checks for 1 currency pair

With the SR Dashboard, you get a powerful tool to control some of the most important information in trading. Assemble a setup according to your strategy and get informed as soon as this setup is valid. Assign scores to defined conditions and let the Dashboard find them. Choose from Trend, Average Daily Range, RSI, Moving Averages, Pivot (Daily, Weekly, Monthly), Highs and Lows, Candlestick Patterns. What can you do with this tool? Use the dashboard as a powerful tool for your discretionary trad
RaptorT: Cumulative Volume and Cumulative Volume Delta (Buying Selling Pressure) Introduction RaptorT CV & CVD (CVD is also known as Buying/selling Pressure or Book Pressure) offers two basic and meaningful indicators for trading having volumes as main index and weigh of the market interest. It gives good insights in combination with VWAP line and its four upper and lower standard deviations, developing PVP (Peak Volume Price, the equivalent of the POC for the old Market Profile), Volume Profi
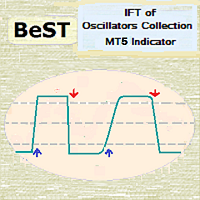
BeST_IFT of Oscillators Collection is a Composite MT4/5 Indicator that is based on the IFT ( Inverse Fisher Transformation ) applied to RSI , CCI , Stochastic and DeMarker Oscillators in order to find the best Entry and Exit points while using these Oscillators in our trading. The IFT was first used by John Ehlers to help clearly define the trigger points while using for this any common Oscillator ( TASC – May 2004 ). All Buy and Sell Signals are derived by the Indicator’s crossings of the Bu
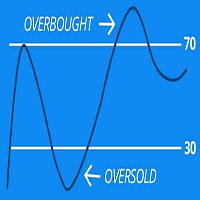
Scan all your favorite pairs with RSI, and get notified on your preferred time frames.
Settings are Customizable
Click to change time frame or open new pairs
Notification: Phone/Popup/Email The relative strength index (RSI) is a technical indicator used in the analysis of financial markets. It is intended to chart the current and historical strength or weakness of a pair/stock based on the closing prices of a recent trading period. The RSI is most typically used on a 14 period, measured on

Tool for Identifying Potential Reversal Points and Trend Direction
This tool is excellent for identifying potential reversal points and trend direction in the market. It works well with confirming indicators such as MACD, Stochastic, RSI - standard indicators available on all MT5 platforms. Together with them, it forms a reliable strategy. In the settings, you can adjust the channel distance and period.
It is recommended to enter a trade when the signal line crosses the upper channel bounda

Sinal com base no indicador RSI, que indica compra marcando com uma seta verde quando o preco sai da região de sobrevendido, e sinaliza venda quando o preco sai da regiao de sobrecomprado. A sinalizacão é feita com uma seta verde para compra e seta rosa para venda. Permite configurar o nível de sobrecompra e de sobrevenda, além do período do RSI. Funciona em qualquer período gráfico.

Индикатор Trading Strategy призван помочь трейдерам в поиске оптимальных входов в сделку и выходов из неё. В его основе лежат показания технических индикаторов (MA, RSI, ATR и др.), а также авторский алгоритм, связывающий их сигналы в единое целое. Индикатор даёт сигналы на покупку и продажу в виде стрелочек: стрелочка вверх — сигнал на покупку, вниз — на продажу. В правом верхнем углу показаны сигналы индикатора на 6 таймфреймах (M1, M5, M15, M30, H1, H4) данной валютной пары. Индикатор свои з

Индикатор RSI MT5 - это индикатор Metatrader 5, и суть этого технического индикатора заключается в преобразовании накопленных исторических данных на основе индикатора RSI. Сигналы показаны разными цветами свечей. Смотрите настройки, тестируёте. Это очень полезный индикатор и он точно должен быть у вас . The RSI in candlelight MT5 indicator is a Metatrader 5 indicator, and the essence of this technical indicator is to transform the accumulated historical data based on the RSI indicator. Signals a

MCDX is an indicator based on specific formula to detect Buy and Sell momentum Red Bar means Price go up and Buy momentum. Green Bar means Price go down and Sell momentum" Height of RED bar > 50% means Bull is in control. i.e. RED more than GREEN to go buy. Lower of Green bar < 50% means Bear is in control. i.e. GREEN more than RED to go sell. DARKER RED COLOR - STRONG Up Trend or Strong Bullish Power
LIGHTER RED COLOR - WEAK Up Trend or Weak Bullish Power
LIGHTER GREEN COLOR - STRONG Down

This multi symbol dashboard indicator can send an alert when a strong trend has been identified. It can do so by building up the dashboard using the following indicators/oscillators (hereafter only mentioned as incdicators): RSI, Stochastics, ADX, CCI, MACD, WPR (Williams Percent Range, also called as Williams %R), ROC (Price Rate of Change) and Ultimate oscillator. It can be used with all time frames from M1 to MN (it can only show 1 time frame at a time). It gives you perspectives on momentum,
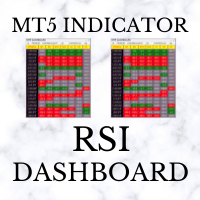
RSI Dashboard uses the value of Relative Strength Index indicator. The parameters can be adjusted via the Edit boxes of this dashboard. The monitoring pairs will be selected by adding to the Market Watch (no need to set prefixes or suffixes) , you can monitor many pairs as you like. This dashboard will check almost popular time frame (M1,M5,M15,M30,H1,H4 and D1). The colors can be customized. We can have a look at many pairs and many time frames without opening the chart. In addition, we can

This indicator plots in the candles the divergence found in the selected indicator and can also send a notification by email and / or to the cell phone.
Works on all TIMEFRAMES. Meet Our Products
He identifies the divergences in the indicators:
Relative Strength Index (RSI); Moving Average Convergence and Divergence (MACD); Volume Balance (OBV) and;. iStochastic Stochastic Oscillator (STOCHASTIC).
It is possible to choose the amplitude for checking the divergence and the indicator has

This indicator Allow you to get notification from 7 indicators. Scan all your favorite pairs with your favorite technical indicator, and get notified on your preferred timeframes.
Settings are Customizable
(RSI, ADX, MACD, Alligator, Ichimoku, Double MA, and Stochastic)
Click to change the time frame or open new pairs
Notification: Phone/Popup/Email
Any MA
Any Moving Average draws a moving average of * any indicator in a sub-window. Many Indicators included with MT5 are supported by default. You can add custom indicators as well. Settings Name Description Timeframe Select timeframe for calculation Source Indicator Select Indicator Custom Indicator Name Enter Custom Indicator Name ( when Source Indicator is set to Custom) Indicator Settings Source Indicator parameters ( separated by comma ) Moving Average Settings Moving Average pa

The Alert Creator indicator is designed to create alerts for selected conditions.
You can select one or several indicators for the notification. If several conditions are selected, the alert is triggered when all the selected conditions are met.
The signals can be configured separately for buying and separately for selling. Example, a buy alert: the closing price is above the moving average, the RSI is below 20. (In this example, 2 indicators are used to generate an alert: MA and RSI)
At

A lot of professional traders use high quality divergence signals as a part of their strategy to enter a position. Spotting correct divergences quickly can often be hard, especially if your eye isn’t trained for it yet. For this reason we’ve created a series of easy to use professional oscillator divergence indicators that are very customisable so you get only the signals you want to trade. We have this divergence indicator for RSI, MACD, Stochastics, CCI and OBV. RSI: https://www.mql5.com/en/
A lot of professional traders use high quality divergence signals as a part of their strategy to enter a position. Spotting correct divergences quickly can often be hard, especially if your eye isn’t trained for it yet. For this reason we’ve created a series of easy to use professional oscillator divergence indicators that are very customisable so you get only the signals you want to trade. We have this divergence indicator for RSI, MACD, Stochastics, CCI and OBV. RSI: https://www.mql5.com/en/ma

A lot of professional traders use high quality divergence signals as a part of their strategy to enter a position. Spotting correct divergences quickly can often be hard, especially if your eye isn’t trained for it yet. For this reason we’ve created a series of easy to use professional oscillator divergence indicators that are very customisable so you get only the signals you want to trade. We have this divergence indicator for RSI, MACD, Stochastics, CCI and OBV. RSI: https://www.mql5.com/en/

A lot of professional traders use high quality divergence signals as a part of their strategy to enter a position. Spotting correct divergences quickly can often be hard, especially if your eye isn’t trained for it yet. For this reason we’ve created a series of easy to use professional oscillator divergence indicators that are very customisable so you get only the signals you want to trade. We have this divergence indicator for RSI, MACD, Stochastics, CCI and OBV. RSI: https://www.mql5.com/en/

A lot of professional traders use high quality divergence signals as a part of their strategy to enter a position. Spotting correct divergences quickly can often be hard, especially if your eye isn’t trained for it yet. For this reason we’ve created a series of easy to use professional oscillator divergence indicators that are very customisable so you get only the signals you want to trade. We have this divergence indicator for RSI, MACD, Stochastics, CCI and OBV. RSI: https://www.mql5.com/en/

RSI Arrow1 is an arrow indicator based on the RSI, is easy to use; no internal adjustments to be made. the user can change the indicator period as desired in the settings. It can be used on all markets but it will all depend on your Trade strategy. There is no better Time Frame for its use; the use will depend on the Trader himself.
Settings:
RSI Period Push Notification Email Notification Audible Alert Down levels Up levels

This indicator is based on the crossing of two Moving Average with the RSI It is intended for scalpers Specially designed for Boom and Crash syhtetic indices from Binary.com/Deriv.com It is easy to use and intuitive. We recommend its use on M1 and is equipped with three types of notification Email alert Sound notification Push notification these parameters can be activated and deactivated.

Binary Options Assistant (BOA) Multi Currency Dashboard for Binary Options (MT5) .
You can use any of the BOA Signals Indicators with the dashboard. Just change the BOA Signals Indicator Name in the dashboard settings to the indicator you want to get signals from. For example: CHILL. BLAZE: BOA_BLAZE_Indicator_v1 Strategy : BLW Online Trading Binary Options Strategy (3 Moving Average)
LAVA: BOA_LAVA_Indicator_v1 Strategy: Lady Trader Binary Options Strategy (Bollinger Bands & Stoc

This indicator looks for SIGNS of Buy and Sell
14 SIGNS: Crossover of 2 moving averages; Crossover of 3 moving averages; RSI Indicator; Stochastic Indicator; Crossing line 0 MACD;
Divergence of the RSI indicator; Divergence of the MACD indicator;
Divergence of the OBV indicator;
Divergence of the STOCHASTIC indicator; Three white soldiers candle pattern; Three black crows candle pattern; Hanging man candle pattern; Hammer candle pattern; Rupture Bands Bollinger.
The indicator plot
Binary Options Assistant (BOA) CHILL Signals Indicator provides signals based on Katie Tutorials Binary Options Strategy. Indicators: 3 Moving Averages & RSI
Stop missing trades, stop jumping from chart to chart looking for trade set-ups and get all the signals on 1 chart! U se any of the BOA Signals Indicator with the Binary Options Assistant (BOA) Multi Currency Dashboard . All BOA Signal Indicator settings are adjustable to give you more strategy combinations. The signals can be seen vi

-Wick Fill Trend concept During a high volatility events in the market, candles tend to create wicks along the way on their moves. A wick in a candlestick reflects a rejection in the price. The majority of times these wicks are filled because have a huge volume pushing in that direction. Wick Fill Trend scans those opportunity focusing on trend markets. It has a success rate simulator dashboard which displays live signal with entry point, take profit and stop loss. This success rate simulat
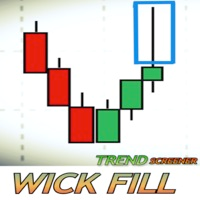
What is a wick in trading? How Does this Screener work? A wick in a candlestick reflects a rejection in the price. This Screener is trying to identify wicks with great potential to be filled. This Screener is focused on the wicks that happen in the trend market. The Screener displays a dashboard that offers an overall view of the potential wicks traded live. It shows ALL the pairs/instruments organize by timeframe. Buys opportunities are named "UP-W.’’ They appear green on the dashboard, and

The multi-currency indicator Currency Strength Index Plus can be set on the chart of any of the 28 currency pairs formed by 8 currencies (USD, EUR, GBP, AUD, NZD, CAD, CHF and JPY), for example, on EURUSD, H1. The indicator is designed to determine the direction of strength of each of the 8 currencies relative to each other. Using the strength and its direction of two opposing currencies, it is possible to make a currency pair with the best trading potential. Currency indices have flexible smoot
Reversal candles indicator , use in second window with rsi,levels 10-20-50-80-90 so u can see where the reversal candles pop upat the overbought oversold rsi levels.Great oppertunity to get in early and get out at the best moment. Candle turns blue at the 10-20 level "buy" candle turns red at the 90-80 level "sell" Always look at the major trend beore taking a buy or sell!!!

Spike Dragon Indicator is Specially Designed for Boom 300 and Crash 500 Indices. We decided to add the indicator after extensive testing. The strategy is Based on Supply and Demand levels, RSI ,MACD and 1 other custom indicator designed to filter out less probability signals.We accept suggestions in improving our system.
Why choosing Spike Dragon : Easy Installation and compatible with MT5 Platform Onpoint Signals on M1 Timeframe making the system fast in generating Spikes Good risk Managemen

Infinity Indicator MT5 1.0 Panel Asset Rate % EURUSD 96.0% GBPUSD 94.1% AUDCAD 90.5% USDCHF 87.8% BTCUSD 78.4% Panel Win Rate based on CandleMT4 Exit Button Calculates the StdDev standard deviation indicator on the RSI data, stored in the matrix similar to the keltner. input int HourCalculate = 12; RsiLength = 5; RsiPrice = PRICE_CLOSE; HalfLength = 4; DevPeriod = 100; Deviations = 0.9; UseAlert = true; DrawArrows = true; TimerWork=300; LevelUp = 80; LevelDown = 20; MoreS
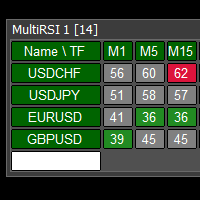
This tool monitors RSI indicators on all time frames in the selected markets. Displays a table with signals to open a BUY trade (green) or SELL trade (red). You can set the conditions for the signal. You can easily add or delete market names / symbols. If the conditions for opening a trade on multiple time frames are met, you can be notified by e-mail or phone message (according to the settings in MT5 menu Tools - Options…) You can also set the conditions for sending notifications. The list of s

Brief description The ContiStat indicator calculate statistic frequency of green (up) and red (down) movement in the chart and determine movement dynamics (silver curve). There are two key parameters to understand the ContiStat principle: Block height and Block count . The ContiStat engine convert instrument price chart move to Blocks of constant height (price) regardles of how much time it take. Example 1: Block height is set to 50. DE30 index price make move from 15230 to 15443 in an hour. 4 g
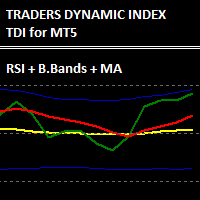
The Traders Dynamic Index is a combination of multiple indicators into a complex array of signals that can be interpreted for market behavior.
It combines the RSI, Bollinger Bands and a Moving Average , first developed by Dean Malone it has seen prominent use as it combines an often used strategy into a single indicator.
The RSI will determine an overbought or oversold phase for the instrument that will be smoothed and filtered by the MA the Bollinger Bands will then assess the amplitude a

This simple, yet powerful indicator is very good way to determine actual S/R levels. It's main purpose is making your overview on markets much better.It has built-in arrow signal system, which should be used along with MT indicators for best results.Just try it.
Recommended MT indicators to use along:
Bollinger Bands (default) RSI (period 3, levels 10/90)

About AIntel
Is there are reason you select RSI 14 or 21? Is there a reason you select EMA 25? Is there a reason you pick these periods for these and any other indicators? Those numbers might have worked 10 or 20 years ago. They might be working for traiding certain currency pair in a certain timeframe.. But they DO NOT give you the best profit and outcome at all times all pairs all trades! AInter is "automated inteligence" series indicators that optimize automatically for best profit so you do

[ MT4 Version ] [ EA ] Advanced Bollinger Bands RSI MT5 Advanced Bollinger Bands RSI is an Indicator based on the functionalities of the Advanced Bollinger Bands RSI EA . The scope of this indicator is to provide a more affordable solution for users interested in the alerts coming out of the strategy but not in Autotrading. This strategy uses the Bollinger Bands indicator in combination with the RSI, the signal triggers only when both the BB and the RSI indicate at the same time overbought or ov
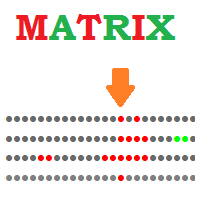
Matrix Indicator Matrix Indicator is a simple but effective indicator.
Matrix indicator displays usual oscillators indicators in a user friendly color coded indicator.
This makes it easy to identify when all indicators are aligned and spot high probability entries.
Inputs of indicator are:
Indicator: RSI, Stochastic, CCI, Bollinger Bands Param1/Param2/Param3: usual settings for the indicator ValueMin: Oversold level for oscillator ValueMax: Overbought level for oscillator The indicator
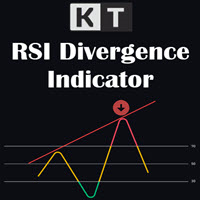
KT RSI Divergence shows the regular and hidden divergences built between the price and Relative Strength Index (RSI) oscillator. Divergence can depict the upcoming price reversal, but manually spotting the divergence between price and oscillator is not an easy task.
Features
Ability to choose the alerts only for the divergences that occur within an overbought/oversold level. Unsymmetrical divergences are discarded for better accuracy and lesser clutter. Support trading strategies for trend r

Vix 75 and Boom Sniper Entry
= Assistance for Non Beginners traders = Market Structure is KEY =Trading is a Risk ... Know what you are entering into when starting your trading journey
Basically the indicator gives signals due to reach of Support and Resistance, it also give signals on touch of order block. Works Best on Gold and Eurusd and Synthetic Index - its best give accurate confluences with a TDI
TDI settings: RSI Period -10 Bollinger Bands - Period 34 - First indicators Data Movin

This indicator is the advanced edition of WRP&KD support resistance designed according to the combination of WPR, Stoch, RSI, CCI, and tick volume indicators. You can add other timeframe's support and resistance on the current chart. When WPR, Stoch, RSI, CCI goes up the same time quickly and the volume become larger, the price may meet strong resistance, many times short order will take profit, but if the price break through it, Long positions are more likely to be profitable, and the

25% off. Original price: $40 RSI Scanner is a multi symbol multi timeframe RSI dashboard that monitors Relative Strength Index indicator for price entering and exiting overbought and oversold in up to 28 symbols and 9 timeframes.
Download Demo here (Scans only M1, M5 and M10) Settings description here MT4 version here
RSI Scanner features: Signals RSI entering and exiting the overbought and oversold zones. Monitors 28 customizable instruments and 9 timeframes at the same time. Supports

Ayuda a interpretar la tendencia del precio de mercado de acuerdo a las mediciones en tiempo real, ideal para reforzar los resultados mostrados por el RSI las bandas de Bollinguer. Recuerde que el mercado de instrumentos financieros es altamente volatil, no opere con dinero que ponga en riesgo su estabilidad financiera. Solo use fondos que este dispuesto a perder. Resultados pasados no garantizan resultados futuros. Mantenga Siempre control sobre el riesgo.

Basato sull'indicatore RSI aiuta a capire quando il trend sta cambiando in base ai periodi impostati. E' possibile impostare intervalli di tempo personalizzati e colori delle frecce. Segui l'andamento e valuta anche in base alla volatilità dell'asset. Funziona con ogni coppia di valuta ed è da considerare come un'aiuto ad una valutazione. Puoi associarlo con altri indicatori.
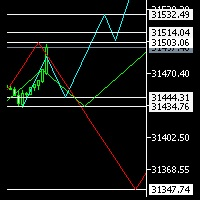
Hello Everyone ,
I am not an Elliot pro , but I promise to let you see it in a different way , have you ever considered to see 3 probabilities of different time frames on same chart ? this will not only enhance your trades entry , but will give you confidence and certainty when everything is not clear.
in my indicator you will be able to select 3 time frames of your choice , define number of candles per each time frame , give the color per each trend (Bearish or Bullish), not only that , yo

This indicator shows the bullish/bearish market regime using the no. of bars moved above and below the overbought/oversold region of RSI. The green histogram depicts the Bull power, while the red depicts the Bear power.
Features
It can be used to enter new trades or validates trades from other strategies or indicators. It comes with a multi-timeframe scanner that scans the bulls/bears power across all the time frames. It's a perfect choice to boost the confidence of new traders via validatin

Volatility Vision: Best Solution for any Newbie or Expert Trader!
User manual: Click
The "Volatility Vision" s how levels on the chart, may be used to enter and exit positions, and it's a useful indicator to add it in trading system. Indicator works on all currency pairs and stocks. This is a great advantage and new in trading. Intra-weekly traders can use the "volatility limits" information to comfortably open and close orders.
Advantages over standard indicators Removes false e
Divergence is one best ways to trade the financial market as it is a leading indicator of price action that detect high probability reversal and continuation setups. The AlgoKing Divergence Detector is an RSI and Stochastics Indicator with Divergence Detection. Features Hidden Divergence for trend continuation. Standard or Normal Divergence for trend reversal. Screen Alerts. MetaQuotes Notifications. Email Notifications. RSI Indicator built in. Stochastics Indicator built in. Types of Divergen
What is Stochastic RSI? The Stochastic RSI (StochRSI) is an indicator used in technical analysis that ranges between zero and one (or zero and 100 on some charting platforms) and is created by applying the Stochastic oscillator formula to a set of relative strength index (RSI) values rather than to standard price data. This version includes alerts to do not miss really good opportunities. You set the parameter when you want to receive a signal buy order or signal sell order. In order to receive

iFrankenstein - an essential part of TS_DayTrader trading system( Frank.ex5 / Franken.ex5 / Frankenstein.ex5 ).
The indicator provides with 10 pattern-based signals.
For each of the 10 patterns there's a number of internal indicators and filters used:
Fractals
KeyLevels
RSI Divergences
BollingerBands
ATR
Technical Pocket
Pattern-specific volatility filters
The first 30 buffers of the indicator export a signal
that consists of TakeProfit, StopLoss, Price values, for each of the 1
The MetaTrader Market is a unique store of trading robots and technical indicators.
Read the MQL5.community User Memo to learn more about the unique services that we offer to traders: copying trading signals, custom applications developed by freelancers, automatic payments via the Payment System and the MQL5 Cloud Network.
You are missing trading opportunities:
- Free trading apps
- Over 8,000 signals for copying
- Economic news for exploring financial markets
Registration
Log in
If you do not have an account, please register
Allow the use of cookies to log in to the MQL5.com website.
Please enable the necessary setting in your browser, otherwise you will not be able to log in.