Watch the Market tutorial videos on YouTube
How to buy а trading robot or an indicator
Run your EA on
virtual hosting
virtual hosting
Test аn indicator/trading robot before buying
Want to earn in the Market?
How to present a product for a sell-through
Paid Expert Advisors and Indicators for MetaTrader 4 - 18

A indicator to show saturation in buying or selling With fast and complex mathematical calculations Easily find saturation points for buying or selling Can be used in all symbols and time frames with many signals Can be combined with different indicators and different time frames With simple settings and simple working methods
Features: Can be used on all symbols Can be used in all time frames Can be used in all markets (Forex, stock, etc.) Large number of signals Same performance on all t

The Linker charts master utility links all open chart windows and switches them to one instrument. All the operations in the window on which the indicator is running are copied to all the linked ones. It is a great aid for those trading based on support and resistance levels. For instance, a level drawn for D1 will be drawn in other windows. The utility responds to the change of the style, color of objects and selection of the timeframes to display the objects. The utility copies the settings fr
Check My Product
Contact me to discover all my services
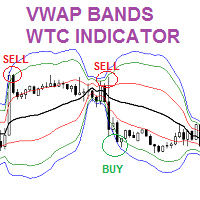
The VWAP Volume weighted Average Price Bands indicator is similar to the Moving Averages and Bollinger bands. In this indicator, more weight is given to the volume. The indicator provides great insight on support and resistance levels in the chart. Moreover, the indicator shows the fair value of a trading instrument. Thus, enabling forex traders to identify great trading opportunities to BUY LOW and SELL HIGH. Forex traders can combine

Certainly! An EA Exponential Moving Average (EMA) strategy is a trading or investment approach used in financial markets, particularly in the context of stocks, cryptocurrencies, and other assets. Here's an explanation in English: An Exponential Moving Average (EMA) strategy is a popular method employed by traders and investors to analyze price trends in financial markets. It's a technical analysis tool that helps identify potential buying or selling opportunities based on historical price data.

It is so very disappointing when the price does not have enough points to achieve Take Profit and makes a reversal. This EA sets virtual levels near the TakeProfit levels. This EA sets virtual levels next to TakeProfit orders. If these levels are reached by price, breakeven or trailing stop is applied for an order.
Features This EA does not set new orders. The aim of this EA is to manage stop losses of existing orders that are set by another EA or manually (magic number equals 0). For correct

Introduction to Sideways Market Analyzer Notable period of Low volatility and non-trending movements in the financial market is considered as Sideways Market. Sooner or later, the low volatility will increase and the price will pick up a trend after Sideways Market. In terms of trading point of view, Sideways Market can serve as the very good entry timing for traders. Sideways Market is also quite often the representation of accumulation of large orders from big investors. Therefore, knowing the

The indicator detects and displays М. Gartley's Butterfly pattern. The pattern is plotted by the extreme values of the ZigZag indicator (included in the resources, no need to install). After detecting the pattern, the indicator notifies of that by the pop-up window, a mobile notification and an email. The pattern and wave parameters are displayed on the screenshots. The default parameters are used for demonstration purposes only in order to increase the amount of detected patterns.
Parameters

The Relative Momentum Index (RMI) was developed by Roger Altman, and introduced in his Feb 1993 article in Technical Analysis of Stocks & Commodities magazine. As its name suggests, Relative Momentum Index adds a momentum component to the traditional RSI, designed to increase reliability by decreasing spurious oscillations between defined overbought and oversold levels. This Relative Momentum Index indicator has 2 components. A change in RMI line color provides a warning signal for an upward or
Welcome to the world of advanced trading with the Bollinger Bands Scanner! Maximize your trading potential with our powerful MT4 indicator designed for seamless analysis and real-time insights. Key Features: Effortless Bollinger Bands Scanning: Unlock the full potential of the Bollinger Bands Scanner by effortlessly scanning multiple assets. Receive instant alerts when specific Bollinger Bands conditions are met, ensuring you stay ahead of market movements. Comprehensive Dashboard Insights: Gai
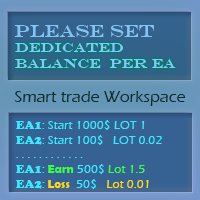
Now you can allocate a separate balance for each EA. That is, allocate a certain part of the funds from the trading account for the specified EA and it will calculate the lot from its balance, earnings and losses. Trading with a dedicated balance:
You will be able to maintain your separate trading accounts on a single trading account. Each selected balance can be configured for a separate automatic or manual trading EA. Each selected balance can trade independently, that is, without mixing wi

LIVE SIGNAL Crazy RUN is a trading algorithm that can be used for both conservative and aggressive trading. The strategy of the Expert Advisor is based on the system of price rollback to the average value. Crazy Run opens a large number of orders, which maintains the necessary balance even when the price moves against the forecast of the trading algorithm.
Crazy Run :
- a system of deposit acceleration, which can multiply it several times in a short period of time
- conservative long term t
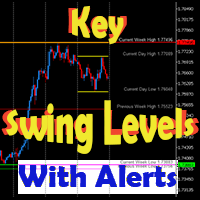
This dynamic indicator will draw the Key Swing High and Low Levels for any symbol on any timeframe!
User may Hide or Show any Level or Label and also Receive Alerts when price returns to that key level via Pop-Up, Push, Email or Sound.
Levels include Current Day High/Low, Previous Day High/Low, Current Week High/Low, Previous Week High/Low and Monthly High/Low.
The Key Levels are labeled with the Price Point Data Listed next to it for quick easy reference.
You can change the Style,

KT Volume Profile shows the volume accumulation data as a histogram on the y-axis providing an ability to find out the trading activity over specified time periods and price levels.
Point of Control (POC) in a Volume Profile
POC represents a price level that coincides with the highest traded volume within the whole volume profile histogram. POC is mostly used as a support/resistance or as an essential price level where market retest before going in a specific direction.
Features Very easy

This is the multi-time frame Fisher Divergence indicator for MetaTrader 4, with signal arrows and a Signals panel which is freely movable showing the last signals and their time in color. The indicator draws some lines based on signal time. On the time frames below H4, the indicator scans for H4 divergence signals and draws it on chart with thick trend lines, and also it draws arrows for them. And also it scans the current time frame and draws a line at divergence location and places signal arro

Trendfinder SMA With Zone and Alert are Colored candlesticks showing the trend based on two SMA as Signal and two SMA as a Buy and Sell Zone and the slope of the slow moving average. This indicator will give you the color change on the next bar on the confirmation candle and will provide alert on Buy and sell signal, when it enters the buy and sell zone and when the market test the buy or sell zones as support or resistance and will never repaint . This indicator has the following: 2 SMA for th
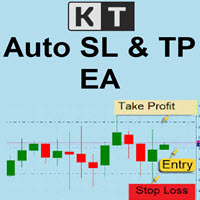
KT Auto SL TP automatically sets the stop-loss and take-profit as soon as it detects manually placed orders on the chart. It can effortlessly place the stop-loss and take profit for the market, limit and stop orders simultaneously.
Features
It can set the stop-loss and take-profit for all the active symbols from a single chart. Equipped with trailing stop-loss with steps. Seamlessly works for the market and pending orders. Shows the informational text information on the chart.
Inputs Cur

Hola Traders. Lot - lot size for pending orders. Martingale - double lot size of pending orders. *(No Martingale = 1.00) TotalGridEachSide - unit each side of pending orders. ( 1 pip = 10 points for a 5-digit broker ) SpaceOfFirstOrder - distance for the first order in points. ( 1 pip = 10 points for a 5-digit broker ) Take Profit - profit in points. ( 1 pip = 10 points for a 5-digit broker ) Stop Loss - loss in points. ( 1 pip = 10 points for a 5-digit broker )
and you can open order BUYS

このインディケータはボリンジャーバンドを裁量およびEAで実際に利用してきた私自身の経験から、より手軽に、かつ効果的に活用できるよう作成された裁量トレード用サインツールです。 ブレイクアウトでの順張り、リバウンドでの逆張りの両面で利用でき、各種のフィルター機能でより精度の高いサインを発信します 勝敗判定機能により、このインディケータの直近の相場環境に対する有効性を確認できます 全通貨ペア、全タイムフレームで利用できます。リペイントはしません
設定項目は以下の通りです。 Bollinger Bands Period
Bollinger Bands Deviation
Bollinger Bands Shift
Entry Mode ...ボリンジャーバンドにタッチしてからのBreakout(順張り), Rebound(逆張り)のどちらかを指定 Plus Filter ...独自アルゴリズムによるフィルターでシグナルの精度を高めます(Reboundモード専用) Trend Filter ...下で設定する移動平均のトレンド方向でのシグナルに限定します Moving Aver

Two Period RSI + Alerts compares long-term and short-term RSI lines, and plots a fill between them for improved visualization. Fill is colored differently according to an uptrend (short period RSI above long period RSI) or a downtrend (short period RSI below long period RSI). Short-term RSI crossing long-term RSI adds a more robust trend confirmation signal than using single period RSI alone. This is a tool to help visualize and confirm RSI trends. We hope you enjoy!
Alerts Email, message, and

The indicator plots a fan of trend lines (after clicking on a certain candle), similar to the classic Gann angles. A feature of the indicator is that it plots angles not only on a fixed scale, but also uses the average statistical price of a certain number of bars (to choose from). The indicator has two ways to calculate the average price for corners (optional): 1) calculation of the average price movement (for a certain number of bars) from High to Low; 2) calculation of the average price movem

50% discount for one week only
An expert based on artificial intelligence and neural network
99% of this expert's strategy is in charge of artificial intelligence
A complex neural network with multiple filters
Experience multiple experts in one expert
I have provided you with several months of artificial intelligence training with powerful new and advanced computers (and several years of programming effort) at the lowest price.
Features of this expert:
Can be used:
in several dif

Description: The indicator predicts, with a specific probability, if the actual candlestick range will expand or contract compared to the range of a previous candle. Furthermore, the indicator shows the possible high or low of the actual candle, based on trend direction. (Recommended for Daily, Weekly, or Monthly timeframes).
KEY LINKS: Indicator Manual – How to Install – Frequent Questions - All Products How to use the indicator: Determines, with a certain probability, if there will

EA Setting, Common Common
1)Long & Short -allow EA open short and long position
Live Trading
1)Tick -Allow live trading
Safety
Tick All
1)Allow DLL import
2)Allow import of external experts
3)Allow modification Signal settings Inputs Variable Value Remarks Open new series true Make it default Trade BUY true Make it default Trade SELL true
Make it default Support manual order true
Make it default Max sell order 10 You may co

Pivot Points และระดับ (Support) และ(Resistance) บนแผนภูมิการเทรดใน MetaTrader 4 สำหรับตลาด Forex : คำนวณ Pivot Points : สคริปต์คำนวณจุด Pivot โดยใช้ข้อมูลราคาประวัติศาสตร์ เช่น ราคาเปิด, ราคาสูงสุด, ราคาต่ำสุด, และราคาปิด จากช่วงเวลาที่กำหนด (เช่น วัน, ชั่วโมง, ฯลฯ) จุด Pivot และระดับต่างๆ เช่น R1, R2, R3 (ระดับการต้านทาน) และ S1, S2, S3 (ระดับการสนับสนุน) ถูกคำนวณออกมา แสดงบนแผนภูมิ : หลังจากคำนวณจุด Pivot และระดับต่างๆ, สคริปต์จะแสดงเส้นเหล่านี้บนแผนภูมิ MT4 เพื่อช่วยให้นักเทรดสามารถเห็นจุดที่

RSI Dashboard is a great tool for quickest possible analysis of multiple currency pairs at the same time in terms of Oversold or Overbought .
All displayed and used by indicator symbols are freely to choose and are specified using a space separated list in parameters you're able to analyze not only predetermined ones, but everything that your broker offers, also commodities, equities, indices, ones with prefixes, suffixes etc.
There are 3 types of alerts: alert notifications in the MT4 term
If you need an advisor on any arrow indicator signals - this utility will definitely help you. You will be able, with the help of this utility to form an unlimited number of EAs on YOUR signals , with your set of settings, with your copyright and complete source code . You will be able to use the resulting EAs unlimitedly , including adding them to the Market and other resources. Generated Martingale EA with the help of this script - here Free simple version of the generation script to help yo

VWAP Bands gives you the regular Volume-Weighted Average Price and also the deviation bands.
Use this indicator to see the possible amount of market movement, find support and resistance lines, find good spots for entry and exit, and the most important feature is to find possible pivot points.
This indicator has been mathematically improved by Rira team. The calculation begins at the start of each trading day

The program is use to copy trading from MT4 to MT4 and MT5 on local PC or copy over the Internet. Now you can easy copy trades to any where or share to friends. Only run one Flash Server on VPS, also need allow the apps if you turn on Windows Firewall. Can not add more than 20 account copier to server, include both MT4 and MT5 Get free Copier EA for MT4 and MT5 (only receive signal), download here Instants copy, speed smaller 0.1 seconds, easy to setup How to setup and guide Let read a

The use of a polynomial expansion of data opens up new possibilities for analysis and decision making. But the problem of all existing algorithms is a very slow computation. The main feature of this indicator is its fast algorithm. The speed of calculation of the polynomial algorithm and its standard deviation values is several thousand times faster than conventional algorithms. So this is a convenient algorithm for use without the need to apply supercomputers. Also, starting from version 1.4
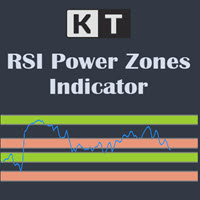
The KT RSI Power Zones divides and shows the movement of RSI into four different power zones to identify the potential support and resistance zones using the RSI.
Bull Support The bull support ranges from 40 to 50. The price is expected to reverse to the upside from this zone.
Bull Resistance The bull resistance ranges from 80 to 90. The price is expected to reverse to the downsize from this zone.
Bear Support The bear support ranges from 20 to 30. The price is expected to reverse to the
This indicator was specially developed to support the powerful day trading strategy described in the book "The Price in Time" . The NTZ BOX indicator automatically creates: The Day separators The No Trading Zone divided with the Green Box, the Peach Box and the Turqoise Box Extensions of the long and short Take Profit levels The Yellow Box to display the range of the Asian session The Money Manager for a perfect Position Sizing calculated on your risk percentage Using the NTZ BOX indicator will

You’ll love how you can receive alerts to your email and SMS when the candles turn green or red signifying the best buy and sell times in correlation to confirmed uptrends and downtrends. TO USE 1. Buy when green candles appear - this represents an uptrend. 2. Sell when red candles appear - this represents a downtrend. EXTRA FEATURE This indicator NEVER repaints so when a candle closes, that color is final. Also, the blue trend lines in the photos are not included, this is to demonstrate the pri

The EA identifies divergences in two correlated currency pairs and trades in the direction where they converge back. Working timeframe: M30
Input parameters MagicNumber - identification number for the EA. OrdersComment - comment to order, automatic if an empty value is set. Lots - lot size. DepoPer001Lot - automatic lot calculation (specify the balance per 0.01 lot) (if 0, the value from 'Lots' parameter is used). TimeFrame - working timeframe. Symbol #2 - correlated currency. Symbol #2 revers

A Swing Failure Pattern ( SFP ) is a trade setup in which big traders hunt stop-losses above a key swing high or below a key swing low for the purpose of generating the liquidity needed to push price in the opposite direction. When price 1) pierces above a key swing high but then 2) closes back below that swing high, we have a potential bearish SFP . Bearish SFPs offer opportunities for short trades. When price 1) dumps below a key swing low but then 2) closes back above that swing low, we have

If you often lose trades because you only use one indicator, then try this trading tool. This trading tool uses more than one indicator. I often observe traders who only use the RSI indicator. Very often the market is oversold but still down or the market is overbought but still up. For this reason, you need to use more than one indicator. Introducing the new version V 4.70 MTF PPAAF : Multi Time Frame Precise Price Action Arrow Filtered . This trading tool uses various indicators to strengthen

This indicator triggers an alert for one of the most popular methods used in Stochastic Oscillator. This is as follow: a buying alert when the Oscillator (either MAIN [%K] or SIGNAL [%D]) falls below a specific level (e.g., 20) and then rises above that level. a selling alert when the Oscillator rises above a specific level (e.g., 80) and then falls below that level. Note: this tool was developed based on the code of Stochastic Oscillator indicator included by default in MetaTrader 4 terminal

I recommend you to read the product's blog (manual) from start to end so that it is clear from the beginning what the indicactor offers. This multi time frame and multi symbol indicator identifies double or triple top/bottom formations or a following neckline breakout (confirmed top/bottom). It offers filters for RSI overbought/oversold, candle patterns (pin bar, engulfing, tweezer, morning/evening star, three line strike) and divergences (MACD, OsMA, Awesome (AO), RSI, CCI, Stochastic) whic
How To Determine If The Market is Strong Or Weak?
Strength Meter uses an Adaptive Algorithm That Detect Price Action Strength In 4 Important Levels! This powerful filter gives you the ability to determine setups with the best probability.
Features Universal compatibility to different trading systems Advance analysis categorized in 4 levels Level 1 (Weak) - Indicates us to WAIT. This will help avoid false moves Weak Bullish - Early signs bullish pressure Weak Bearish - Early signs bearish pre

If you'd like to test the product before purchasing please watch the video below. The program doesn't work in the strategy tester! Contact me for user support & advices! If you've bought this EA, you are entitled to a gift!! MT5 Version With this Expert Advisor, you can: Implement your own Zone Recovery strategy to capitalize on trending markets. Create Grid trading strategies, to profit from ranging markets. Place orders easily and clearly. Display your trades/strategies on the chart. Display

Contact me after payment to send you the User-Manual PDF File. Volume Profile Indicator A functional and useful tool that can improve your trading plan.
This indicator calculates volume in price levels(typical volume indicator shows only candle volumes).
With the volume of price levels, you can identify important areas that have the potential to reverse. You can also see the volume of support and resistance levels and decide on them.
Using volume profiles along with Price Action and
Night scalping using Le Chatelier's principle of dynamic balance. Accounting for the features of real accounts. No risky strategies. All trades are protected by a stop loss. It is possible to work with a minimum initial deposit of $10. Strategy. The trading strategy is based on the principle of dynamic balance, formulated by the French scientist Le Chatelier. According to this principle, a system that is in a state of stable equilibrium, under external influence, tends to return to a state of eq

[ How to use the Demo version ] [ MT5 Version ] AO unpaid divergences MT4 AO unpaid divergences is the first indicator developed to detailed analyze Regular and Hidden Divergences. It uses this analysis to find out possible entry points and targets. Below some of the characteristics of this indicator: Time saving Highly customizable Working for all pairs (Crypto, Forex, Stocks, Indices, Commodities...) Suitable for Scalping or Swing trading Possible reversal swings Alerts and Notifications on
$125. Today discount!
Smart trading system - a beginner can simply trade when signal with default setting. With experience can adjust setting for maximum efficiency on each timeframe and each trade symbol your MT4. All screens and template are configured automatically for comfortable trading. The parameters of a unique flexible algorithm are open here and % of success is the result of trader settings. Are available "Signal Optimizer" and signal filters: "Filter_Stoch_M15", "Filter_Stoch_

The indicator displays volume clusters or volume profiles to choose from.
Input variables
StepPoint - cluster step in points, if the value is zero, the step is assigned automatically. AssociatedTimeframe - binding the indicator to the specified timeframe of the chart, if the value is equal to Current, the indicator works on all timeframes. ClustersVolume - volume in clusters: All - all volume. Active - active volume (which produced the price movement). ClustersAsDelta - difference betw
Try the default settings on M5 EURUSD, M5 EURCAD, M5 NZDUSD. See the comment section for a set file for M5 EURJPY, M5 USDJPY, M5 USDCAD. Link to the TELEGRAM group is also in the comment section. User Manual ================================================================================================
Recommended broker: IC Markets Recommended account: 1:500 leverage, low spread (ECN), minimum 500$ (recommended 1k) ==========================================================================
First Scalper is an Expert Advisor based on Scalping, Using the best and safest scalping EA on market. Large number of inputs and settings are tested and optimized and embedded in the program thus inputs are limited and very simple. Using EA doesn't need any professional information or Forex Trading Knowledge.
First Scalper can trade on all symbols and all time frames, using a special and unique strategy developed by the author.
Using EA :
General Options Trade Type : Long/Short/Both St

Let Your Ideas Earn For You.
Convert your Ideas and Strategies in to automated trading bots directly on MT4. Visual Strategy Builder with Instant Results on the chart. This One of a kind strategy builder, allows you to specify rules and visually see the signals based on those rule as you create them. Visit the link for Group, User Manual, Video Examples
Why Use LBM
LBM is an essential tool for traders of all levels. It allows traders to create strategies quickly and easily, and to test th

Entry upon breakout of daily volatility. Exit using a trailing stop. Deposit recovery function after drawdown. No risky strategies. You can work with a minimum initial deposit of $10. There is a version of this robot for the MT5 platform Day and Trail MT5
Strategy.
The entry is performed in case of a breakdown of the extremum of the previous day. This usually happens when market volatility increases, so in the event of a breakout, the price travels a significant distance. The robot tracks

Works to open two hedging deals, buying and selling, with a goal of each deal of 20 points With the opening of multiple cooling deals in the manner of another lot size and suspending each type of sale or purchase transaction At a profit level.
Parameters:
Lot1: Manual Lot Size Auto_Lot: Set true to automatically calculate optimal Lot Size based on risk preferences, Set False if you want use manual lot size. Max_Risk: Max Risk as percentage of Equity* the greater this percentage is the great

"Forex Market Watch" is a sophisticated and versatile Expert Advisor that I have designed for the foreign exchange market.
This automated system is equipped with advanced trend tracking technology, allowing it to closely monitor price movements across a wide range of currency pairs, including USD, EUR, GBP, CHF, JPY, CAD, AUD, and NZD.
The strategy behind "Forex Market Watch" is based on meticulous market trend analysis. By analyzing real-time price movements and utilizing advanced technica

Found a great signal, but a provider's lot is too small? You need larger position volume, but terminal settings are too poor? Signal Lot Manager will increase the provider's position volume by means of a duplicate order of the needed volume. Just set a lot size and a name of a signal for copying orders from. Signal Lot Manager is a lot multiplier utility for duplicating orders on your terminal. The source can be selected any adviser, manual trading, a separate trading signal. It has wide functio

Copy Signals from any channel that you are a member ( without the need for a Bot Token or Admin Permissions straight to your MT4. It has been designed with the user in mind while offering many features you need This product is presented in an easy-to-use and visually attractive graphical interface. Customise your settings and start using the product within minutes!
User Guide + Demo | MT5 Version | Telegram Version If you want to try a demo please go to the User Guide. The Discord To MT4

Eternal Engine EA employs an advanced intelligent algorithm designed specifically to capture the subtle shifts in the market. The algorithm of this EA is based on the team's long-term research, identifying trading opportunities in complex market conditions. It can quickly adapt to market fluctuations, operates automatically 24 hours a day without manual intervention. live signal: https://www.mql5.com/en/signals/2044932 Features: Cutting-edge strategy algorithm to identify optimal trading oppo

Smart Copy is an Easy-to-Use EA that supports Multi Copying Metatrader4 and Metatrader5 and Local/Remote Copying. (Remote Version is coming soon)
Free version is available on Smart Copy Local Free MT4
Specifications :
Real Time, Multi Terminal - Multi Account - MT4/MT5 trade copying Copy from netting to hedge and hedge to netting is supported.
Fast and instant copy
All settings are input visually. Easy modifying symbol names, prefix, suffix Enable/Disable co

A complete NNFX algorithm in one indicator.
NEW: Inbuilt backtester shows historical trade stats on the chart to show which pairs are most profitable. Don't be fooled. It's not enough to simply match a strong and weak currency to trade successfully with a strength meter, you need to know the intimate details of the relationship between two currencies. This is exactly what we've done with NNFX Strength, giving you all the information you need to make solid trading decisions. Years in the makin

MetaTrader 5 version available here : https://www.mql5.com/en/market/product/24882 FFx Basket Scanner is a global tool scanning all pairs and all timeframes over up to five indicators among the 16 available. You will clearly see which currencies to avoid trading and which ones to focus on.
Once a currency goes into an extreme zone (e.g. 20/80%), you can trade the whole basket with great confidence. Another way to use it is to look at two currencies (weak vs strong) to find the best single pair

Overview Cendol Bender is one of its kind of SMC/ICT market structure and market shift identification automation, it gives an unprecedented edge on your market structure analysis by automatically identifies valid market structure using smart and powerful structure mapping mechanism by following criteria: Impulsive and corrective movement of the market Identification of valid pullback across all impulsive and corrective market movement Validation of single bearish or bullish leg move Identificat

This scanner is monitoring the entire market for Ichimoku trade opportunities for all symbols and for all time frames. You don't have to look to all the charts, for all symbols and for all time frames. This scanner will alert you on your computer, or on your mobile, when a trade opportunity has been found. You never have to miss a trade opportunity! This indicator is designed to scan all pairs and symbols, for all selected time frames, to find a Tenkan and Kijun Cross or a breakout of the Ich

An extremely convenient indicator that truly makes the process of making money on the exchange easy. It is based on the scientifically rigorous theory of the market developed by the author, the beginning of which is presented here . The full algorithm of this indicator operation is presented in the article . The indicator calculates the most probable price movement trajectory and displays it on the chart. Based on the predicted price movement trajectory

A ready-made trading system based on automatic construction and maintenance of Fibonacci levels for selling and buying for use on any instrument (symbol) and on any period of the chart. Features Detection of trend direction (14 indicators) Construction of horizontal levels, support and resistance lines, channels Selection of a variant for calculating Fibonacci levels (six different methods) Alert system (on screen, E-Mail, Push notifications) Buttons Color scheme switching button. Arrow buttons.

Do you think it's a bit cumbersome when you need to switch symbols or timeframes with mouse click? 1. What is this? This is a program that can switch symbols and timeframes with direction keys. Fast switching, very convenient, no mouse click required. For traders, one symbol with multi-timeframe charts are usually added, you can change symbol on those charts easily. For multi-currency traders, different symbol charts are usually added, you can also change those timeframes easily. I wrote this p
The Expert Advisor has been specifically developed for trading gold (Spot Gold). The strategy is based on Fibo levels calculated from the previous (first) candle High/Low and the width of the current and lower timeframes channel. If important Fibo levels of different orders are located in a single price channel (within a spread), the EA defines this channel as the target for price movement and starts operation. Martingale and averaging are not used. Each order is independent and is accompanied b

WHITE BIRD EA is a fully automated & customizable EA.
The EA's objective is to provide steady incomes (See pictures) with a high level of safeness (See pictures).
The algorythm based on an auto-adaptive system, is constantly controlling :
- The distance between orders - The lot size of orders - The level of Equity - The level of security
3 trading modes can be used (See backtests 9 examples) :
- CHALLENGE FUNDERS (PROP FIRMS) COMPATIBLE: Profit higher than 10 % / Draw

Monster Harmonics Indicator is a harmonic pattern indicator. It recognizes Gartley, Bat, Crab, Butterfly, Cypher, White Swan, Black Swan, Shark and several other patterns. Projected patterns that are not yet completed are recognized, too. Monster even shows the PRZ (Potential Reversal Zone). Users can add their own user defined patterns to Monster. Besides the current pattern, Monster also shows all patterns in the symbols history. Monster will provide alerts for developing patterns. Introduced

What Exactly Is A Smart Trading Tool? Smart Trading Tool was developed for fast and comfortable trading of the financial markets especially for ORDER BLOCKS TRADERS . It provides traders functionalities, such as: A Drawing Tool One-Click Trading Panel Automated Lot Sizes Calculation based on your risk appetite & Money Management ( Watch this video , how this tool can help manage your risk per trade better!) Built in PRICE LEVELS (Fibonacci, Round Numbers, Daily hi-low, etc) Shows Trading Informa

The EA Gideon is an Expert Advisor that trades ON NEWS and ON EVENTS that have a strong influence on the market, but do not occur regularly! That is the EA opens Sell Stop and Buy Stop pending orders in case of a sudden price change in any direction and closes them automatically with the profit that you wish. And we all know how often the price changes when a "successful" news appears, how far it can go up or down. Also, this robot protects your deposit by placing SL with customizable parameters

SuperOsma Arrow is a supertrend osma based indicator that give buy and sell signals , the indicator is non repaint and it comes with a dashboard that shows signals stats.
Recommended timeframe :15 and above
Buy : Buy arrow appear on bar open , set tp and sl as drawn on chart
Sell : Sell arrow appear on bar open , set tp and sl as drawn on chart ================================ The Dashboard shows history signals info : 1.win-rate % 2.how many winners 3.how many loser 4.how many consecutive wi

Trade Copier Agent is designed to copy trades between multi MetaTrader(4/5) accounts/terminals. With this tool, you can act as either a provider (source) or a receiver (destination). All trading actions will be copied from the provider to the receiver with no delay. This tool allows you to copy trades between multiple MetaTrader terminals on the same computer with lightning-fast copying speeds of under 0.5 seconds. Trade Copier Agent Installation & Inputs Guide Please Apply the settings on the

Unique indicator that implements a professional and quantitative approach to mean reversion trading. It capitalizes on the fact that the price diverts and returns to the mean in a predictable and measurable fashion, which allows for clear entry and exit rules that vastly outperform non-quantitative trading strategies. [ Installation Guide | Update Guide | Troubleshooting | FAQ | All Products ]
Clear trading signals Amazingly easy to trade Customizable colors and sizes Implements performance st
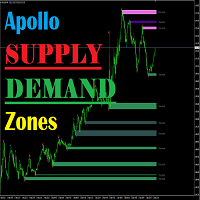
Apollo Supply Demand Zones with ALERTS is an indicator that calculates support and resistance levels. The indicator will be helpful to absolutely all traders, regardless of what strategy they use. This indicator can become one of the main elements of your trading system. The indicator calculates levels both on the current time frame and can work in MTF mode, displaying levels from a higher time frame. This indicator can be used absolutely on any time frame and with any trading instrument. The
Learn how to purchase a trading robot from the MetaTrader Market, the store of application for the MetaTrader platform.
The MQL5.community Payment System supports transactions via PayPal, bank cards and popular payment systems. We strongly recommend that you test the trading robot before buying, for a better customer experience.
You are missing trading opportunities:
- Free trading apps
- Over 8,000 signals for copying
- Economic news for exploring financial markets
Registration
Log in
If you do not have an account, please register
Allow the use of cookies to log in to the MQL5.com website.
Please enable the necessary setting in your browser, otherwise you will not be able to log in.