Multiple Timeframe Trendline and Horizontal Support and Resistance Drawing Indicator

MQL4 Indicators

Specification

Multiple Timeframe Trendline and Horizontal Support/Resistance Drawing Indicator

Overview:

Requiring an indicator that will draw both trendlines and horizontal support/resistance on multiple timeframes and will display all on current timeframe.

Rules for Trendlines

Trendline drawing will be based on zigzag peaks. 

For resistance trendlines: : the most recent completed zigzag peak (to the left) that is higher than current price will be connected to the next most recent peak (to the left of previous peak) which is also higher than the first identified peak. A ray will join the peaks an project the line forward (to the right)

For support trendlines: : the most recent completed zigzag low (to the left) that is Lower than current price will be connected to the next most recent low (to the left of previous peak) which is also lower than first identified peak. A ray will join the peaks an project the line forward (to the right)


Rules for Horizontal Support and Resistance

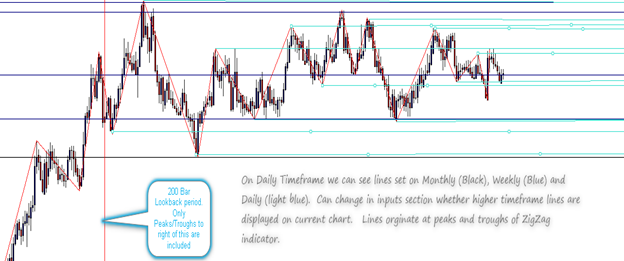
Horizontal Support and Resistance will be all Zigzag peaks and troughs (highs/lows) during a “lookback” period.  Lookback period will be 200 bars of the chart the lines are being drawn on. A ray is draw from the origin of each peak/trough and projected forward (to the right)

Similar to trendline rules – horizontal support and resistance will be drawn on each timeframe, coloured different (same colour as trendlines) and visible on the current timeframe (can be changed in inputs settings).


Additional Requirements:

·         Can display all higher trendlines on current chart.(options in inputs to disable or customize)

·         As zoom in and out on a chart, should be able to see all relevant lines.

·         Will use standard zigzag with MT4 package – code must be internalized.  If coder can recommend another version of zigzag that is more efficient/responsive would be happy to hear recommendations.

·         Extensive comments are required in source code. This will be used in another indicator and needs to be easily understood by future coders to be modified later. Every aspect of the Indicator must be documented with comments. 

·         Timeframes to be included are: Monthly, Weekly, Daily, 4Hr, 1Hr, 15min, 5min, 1min

 ·         **If a trendline happens to use the exact same two zigzag peaks which were used on a higher timeframe  trendline, the trendline on the current timeframe will not be drawn.  This is important.  Only the higher timeframe trendline that uses those zigzag peaks or troughs will be included.  Please ask for clarification if this in unclear.  Horizontal Support and Resistance lines don't require this rule. 


Inputs

-          ZigZag Inputs can be set: Depth/Deviation/Backstep


Lines drawn on different timeframes will have different colours.  Ex lines drawn on all monthly will be same colour.  All drawn on weekly are different colour than monthly etc.. – Colours for each can be set in inputs. Colours are the same for trendlines and horizontal lines of same timeframe.


-          Can chose timeframes to display. 

 o   Display Current and all Higher Timeframes (true/false) (DEFAULT)

o   Display Only Higher Timeframes (true/false)

o   Display x timeframes (can customize which timeframes to display ex: Daily, Weekly, Monthly)


-         Horizontal Support and Resistance Lookback Period.  Default will be 200 Bars


  Have options to chose to display Trendlines, Horizontal Support and Resistance, or Both.  Display BOTH is default. 


Responded

1
Developer 1
Rating
(461)
Projects
902
77%
Arbitration
25
16% / 68%
Overdue
100
11%
Free
2
Developer 2
Rating
(84)
Projects
149
31%
Arbitration
32
34% / 41%
Overdue
43
29%
Free
3
Developer 3
Rating
(87)
Projects
134
14%
Arbitration
41
22% / 29%
Overdue
14
10%
Free
4
Developer 4
Rating
(33)
Projects
35
40%
Arbitration
11
9% / 91%
Overdue
4
11%
Free
5
Developer 5
Rating
(709)
Projects
1028
39%
Arbitration
47
49% / 23%
Overdue
84
8%
Free
Similar orders
NinjaTrader 8 indicator that plots open prices of higher time frame bars. Time frames to choose from in the properties: 15sec, 30sec, 1min, 5min, 15min, 30min, 1hr, 4hr, 1day, 1week, 1month, 1 year (or any time based periods if that would make the development easier). Ability to customize lines is needed (style, color, thickness, etc.). Also, ability to extend certain lines all the way to the right by clicking on
"Looking for a proficient developer to bring my custom NT8 strategy to life. Your expertise is pivotal for the project's success. Interested in joining forces for a fruitful collaboration? Let's delve into the specifics together. Appreciate it!"
"Seeking a skilled developer to code my custom NT8 strategy. Your expertise is crucial for this project's success. If interested, let's discuss further details and ensure a mutually beneficial collaboration. Thank you!"
Please read entirely. Please do not apply if you do not have experience in combining indicators. One indicator I have was purchased on mql5 and i have the snippet code. no source code available . The other indicator I have will be a custom indicator and I do have the source code. If you have worked with FX TRENDS, FX POWER that's a big help. I'm looking to get 1 alert when both indicators display the same direction (
I need to convert a trading view indicator to mt4. the code was copied from here: Find it here ABC Finder by Melodicfish tv search on goo gl. It is a ABC Pattern finding tool. You can adjust the "Bars Back" setting to include more or less bars in the pattern. I usually have it set to 10 or 15 these settings seem to work well on most assets. The scripts allows you to set up a trade box automatically and has a call out
Looking for a tradingview expert to quickly code a 8 lined description for me (alert based) Apply if you are a proven expert in tradingview and have time to deliver this project under 2_3 days. I'll provide the file to the expert
Hi, I need an Indicator for my EA based on the VWAP and Standard deviation bands. Best if you have it already ready / working. It can look like this: https://ninjatrader.com/futures/blogs/what-is-volume-weighted-average-price-vwap/ https://www.sr-analyst.com/page_studydetail.php?prod=TV0015 It would need to have 2 modes: 1- Anchored one (in between some given hours) - reseting each day. 2- Continous
The future of the traders be a good traders and patient and humble person faithful loyalty to your job and last be a professional traders and helping a dream of us how to trade and etc,,,,,,,,,,,,,,,,,🤑
Firstly Indicator (1) or the first part \\ Draw a red line at the top of the zero candle _ M1 \\ Draw a blue line at the bottom of the zero _ M1 candle \\ Draw a red line at the top of the zero _ M2 candle \\ Draw a blue line at the bottom of the zero _ M2 candle \\ Draw a red line at the top of the zero candle _ M3 \\ Draw a blue line at the bottom of the zero _ M3 candle \\ Draw a red line at the top of the zero
Description of the work to be done: Two tradingview scripts (3rd Wave and Zigzag) from the creator Lonesometheblue will need to be converted to a single EA for mt4. This EA must consist of the indicator that implements these two tradingview and also be capable of placing the orders that the indicator alerts you to. Description of the indicator: The mt4 indicator must have the same configurable parameters as that of

Project information

Budget
30+ USD
For the developer
27 USD