Display Pivot Points indicator on EA
Cans someone enlight me for what I'm doing wrong?
int OnCalculate(const int rates_total,
                const int prev_calculated,
                const datetime &time[],
                const double &open[],
                const double &high[],
                const double &low[],
                const double &close[],
                const long &tick_volume[],
                const long &volume[],
                const int &spread[])
Just get the value(s) of the indicator(s) into the EA (using iCustom) and do what you want with it.
You should encapsulate your iCustom calls to make your code self-documenting.
Detailed explanation of iCustom - MQL4 and MetaTrader 4 - MQL4 programming forum
EAs have no eyes. If you want to see them, put the indicator on your chart.
Don't try do that. There are no buffers, no IndicatorCounted() or prev_calculated. No way to know if older bars have changed or been added (history update.)
Just get the value(s) of the indicator(s) into the EA (using iCustom) and do what you want with it.
You should encapsulate your iCustom calls to make your code self-documenting.
Detailed explanation of iCustom - MQL4 and MetaTrader 4 - MQL4 programming forum
EAs have no eyes. If you want to see them, put the indicator on your chart.
Thank you @William Roeder for you kindly explanation, but maybe I didn't express myself correctly.
I will use the iCustom to get the values in the EA, but I wanted a way to see what happens in visual mode.
On my EA I have this
void OnTick()
{
    double pivotsDay = iCustom(NULL, 0, "tuga/Tuga_Simple", 0, 0);
    Console::Log(pivotsDay);
}
If it is correctly calculated I can use it, but the problem is that visually I don't see nothing, and I would like to see it to adjust my logic. And when I attach that indicator to the EA and save the template as tester when i run the EA all new candles will make the the pivot line the same.
Please tell me if I'm doing something wrong, or if I should follow another approach.
Thank you
Please tell me if I'm doing something wrong, or if I should follow another approach.
for (int i = rates_total - prev_calculated - 1; i >= 0; i--)
This line will result in i = -1 most of the time, because prev_calculated will equal to rates_total after the first call.
And when a new candle is created, i = 0. For your indicator to work right, you'll need i to start from 1 when there's a new candle.
Try this instead:
    int limit = rates_total - prev_calculated - 1;
    if (limit<=0)
        limit++;
    for (int i = limit; i >= 0; i--)
This line will result in i = -1 most of the time, because prev_calculated will equal to rates_total after the first call.
And when a new candle is created, i = 0. For your indicator to work right, you'll need i to start from 1 when there's a new candle.
Try this instead:
Thank you @Seng Joo Thio for your answer, but that doesn't change. You are right that most of the time prev_calculated will equal to rates_total , but when gets a new candle it will be 1 the difference, and it's when I want to do the calculations, yo can see my debug log here
253562  75108.402333    2888    terminal.exe    LOG | rates_total: 125 | prev_calculated: 125
253563  75108.402376    2888    terminal.exe    LOG | rates_total: 125 | prev_calculated: 125
253564  75108.402437    2888    terminal.exe    LOG | rates_total: 126 | prev_calculated: 125
253565  75108.402497    2888    terminal.exe    LOG | rates_total: 126 | prev_calculated: 125
253566  75108.402543    2888    terminal.exe    LOG | rates_total: 126 | prev_calculated: 126
253567  75108.402592    2888    terminal.exe    LOG | rates_total: 126 | prev_calculated: 126
253568  75108.402641    2888    terminal.exe    LOG | rates_total: 126 | prev_calculated: 126
253569  75108.404630    2888    terminal.exe    LOG | rates_total: 126 | prev_calculated: 126
253570  75108.404682    2888    terminal.exe    LOG | rates_total: 126 | prev_calculated: 126
As I'm doing also for 0 there it will only do the calculations on that new candle
One thing strange (for me) that I found out....
When I have attached the indicator to the tester template it will run twice the Indicator and use different times and I guess it will override the values here is the the log
17      0.979158        2888    terminal.exe    LOG | i:0 | rates_total:116 | prev_calculated:115 | shift:1 | high:1.10737 | low:1.10149 | close:1.10568 | pp:1.10485 | period:60 | iTime:2016.07.11 00:00
18      0.979208        2888    terminal.exe    LOG | i:0 | rates_total:116 | prev_calculated:115 | shift:1 | high:1.11198 | low:1.10013 | close:1.10503 | pp:1.10571 | period:60 | iTime:2016.07.08 00:00
and that pp it is the value I get plotted on the chart, if take notice the candles are exactly the same (116) for the same calculation, but the time is different, the correct one is the first
When I detach the Indicator from the tester template I only get one line, so the indicator is only called once
12      1.077535        2888    terminal.exe    LOG | i:0 | rates_total:116 | prev_calculated:115 | shift:1 | high:1.10737 | low:1.10149 | close:1.10568 | pp:1.10485 | period:60 | iTime:2016.07.11 00:00
13      3.630593        2888    terminal.exe    LOG | i:0 | rates_total:140 | prev_calculated:139 | shift:1 | high:1.11255 | low:1.10513 | close:1.10595 | pp:1.10788 | period:60 | iTime:2016.07.12 00:00
and everything is fine, but ofcourse I cannot see the indi on the chart, only at the end when I stop the EA and I guess the indi is drawed, ans I see this output a the end:
14      5.023363        2888    terminal.exe    LOG | i:152 | rates_total:153 | prev_calculated:0 | shift:7 | high:1.11587 | low:1.10971 | close:1.11521 | pp:1.11360 | period:60 | iTime:2016.07.04 00:00
15      5.023400        2888    terminal.exe    LOG | i:133 | rates_total:153 | prev_calculated:0 | shift:6 | high:1.11852 | low:1.10615 | close:1.10747 | pp:1.11071 | period:60 | iTime:2016.07.05 00:00
16      5.023449        2888    terminal.exe    LOG | i:109 | rates_total:153 | prev_calculated:0 | shift:5 | high:1.11108 | low:1.10280 | close:1.10999 | pp:1.10796 | period:60 | iTime:2016.07.06 00:00
17      5.023498        2888    terminal.exe    LOG | i:85 | rates_total:153 | prev_calculated:0 | shift:4 | high:1.11063 | low:1.10518 | close:1.10604 | pp:1.10728 | period:60 | iTime:2016.07.07 00:00
18      5.023550        2888    terminal.exe    LOG | i:61 | rates_total:153 | prev_calculated:0 | shift:3 | high:1.11198 | low:1.10013 | close:1.10503 | pp:1.10571 | period:60 | iTime:2016.07.08 00:00
19      5.023598        2888    terminal.exe    LOG | i:37 | rates_total:153 | prev_calculated:0 | shift:2 | high:1.10737 | low:1.10149 | close:1.10568 | pp:1.10485 | period:60 | iTime:2016.07.11 00:00
20      5.023644        2888    terminal.exe    LOG | i:13 | rates_total:153 | prev_calculated:0 | shift:1 | high:1.11255 | low:1.10513 | close:1.10595 | pp:1.10788 | period:60 | iTime:2016.07.12 00:00
So I guess I'm doing something wrong, just don't understand what
Thank you @Seng Joo Thio for your answer, but that doesn't change. You are right that most of the time prev_calculated will equal to rates_total , but when gets a new candle it will be 1 the difference, and it's when I want to do the calculations, yo can see my debug log here
As I'm doing also for 0 there it will only do the calculations on that new candle
Are you able to show us the complete code rather than just OnCalculate? I've been guessing how you declared your variables and buffers, and my guesses may not be right.
About the value of i, because you have a -1 behind, your i starts from -1 most of the time, and when there's a new candle, it starts from 0. Perhaps it'll still work, but it sure looks weird (LOL).
Next, when you calculate shift, you'll need to add 1 behind, or else you'll always get changing pivot values while shift is still 0.
As for the main problem that you mentioned, I'll refrain from giving further suggestions unless you're able to show the complete indicator code.
Yeah sure, here it is
#include <stdlib.mqh>
#include "../../Include/Framework/Utils/Console.mqh"

#property copyright "Copyright 2019, Tuga"
#property link ""
#property version "1.00"
#property strict
#property indicator_chart_window
#property indicator_buffers 4

#property indicator_type1 DRAW_LINE
#property indicator_color1 clrDarkOrange
#property indicator_style1 STYLE_SOLID
#property indicator_width1 1

#property indicator_type2 DRAW_LINE
#property indicator_color2 clrOrangeRed
#property indicator_style2 STYLE_SOLID
#property indicator_width2 1

#property indicator_type3 DRAW_LINE
#property indicator_color3 clrCrimson
#property indicator_style3 STYLE_SOLID
#property indicator_width3 1

#property indicator_type4 DRAW_LINE
#property indicator_color4 clrYellow
#property indicator_style4 STYLE_SOLID
#property indicator_width4 2

double bufPP[];
double bufHigh[];
double bufLow[];
double bufClose[];
int curPeriodD1 = 0;
int curPeriodW1 = 0;
int curPeriodM1 = 0;
int prevPeriodD1 = 0;
int prevPeriodW1 = 0;
int prevPeriodM1 = 0;
double pivotPointD1 = 0;
double pivotPointW1 = 0;
double pivotPointM1 = 0;
double periodClose = 0;
double periodHigh = 0;
double periodLow = 0;

int counter = 0;

int OnInit()
{

    SetIndexBuffer(0, bufPP);
    SetIndexLabel(0, "PP");
    SetIndexBuffer(1, bufHigh);
    SetIndexLabel(1, "High");
    SetIndexBuffer(2, bufLow);
    SetIndexLabel(2, "Low");
    SetIndexBuffer(3, bufClose);
    SetIndexLabel(3, "Close");

    return (INIT_SUCCEEDED);
}

int OnCalculate(const int rates_total,
                const int prev_calculated,
                const datetime &time[],
                const double &open[],
                const double &high[],
                const double &low[],
                const double &close[],
                const long &tick_volume[],
                const long &volume[],
                const int &spread[])
{
    int limit = rates_total - prev_calculated - 1;
    for (int i = limit; i >= 0; i--)
    {
        curPeriodD1 = TimeDay(time[i]);
        if (curPeriodD1 != prevPeriodD1)
        {
            int shift = iBarShift(NULL, PERIOD_D1, time[i]) + 1;
            periodClose = iClose(Symbol(), PERIOD_D1, shift);
            periodHigh = iHigh(Symbol(), PERIOD_D1, shift);
            periodLow = iLow(Symbol(), PERIOD_D1, shift);
            pivotPointD1 = NormalizeDouble((periodHigh + periodLow + periodClose) / 3, _Digits);
            prevPeriodD1 = curPeriodD1;
            //Console::Log(StringFormat("i:%d | rates_total:%d | prev_calculated:%d | shift:%d | high:%.5f | low:%.5f | close:%.5f | pp:%.5f | period:%d | iTime:%s", i, rates_total, prev_calculated, shift, periodHigh, periodLow, periodClose, pivotPointD1, Period(), TimeToStr(iTime(Symbol(), PERIOD_D1, shift))));
        }
        bufPP[i] = pivotPointD1;
    }

    return (rates_total);
}
void OnTimer()
{
}
void OnChartEvent(const int id,
                  const long &lparam,
                  const double &dparam,
                  const string &sparam)
{
}
Yeah sure, here it is
Ok, I've done many rounds of tests (basically I replace your PERIOD_D1 with PERIOD_M5) so I can see results quickly.
I realised that the MT4 Strategy Tester has these limitations:
- During testing, data of other timeframes/symbols can be accessed by the EA / Indicator, so long as you have their history. However, non OHLC data (e.g Bid/Ask) of other symbols cannot be accessed (although there are workarounds).
- After testing, data of other timeframes/symbols cannot be accessed by the EA / Indicator, and any workaround will be pointless since you're no longer testing, might as well open a new chart with those indicators...
So, basically, other than adding 1 to the shift, your indicator should be fine :).
This cannot work with on calculate() :
 int limit = rates_total - prev_calculated - 1;
    for (int i = limit; i >= 0; i--)
because the value of this is -1, because rates_total - prev_calculated == 0; ; so it is array out of range error
use int start() and counted_bars() instead, take a exemple of loop inside another indicator
or try this :
int limit = rates_total - prev_calculated + 1;with ArraySetAsSeries(buffer, true) so the last bars is number zero of the buffer
- Free trading apps
- Over 8,000 signals for copying
- Economic news for exploring financial markets
You agree to website policy and terms of use
Hi all,
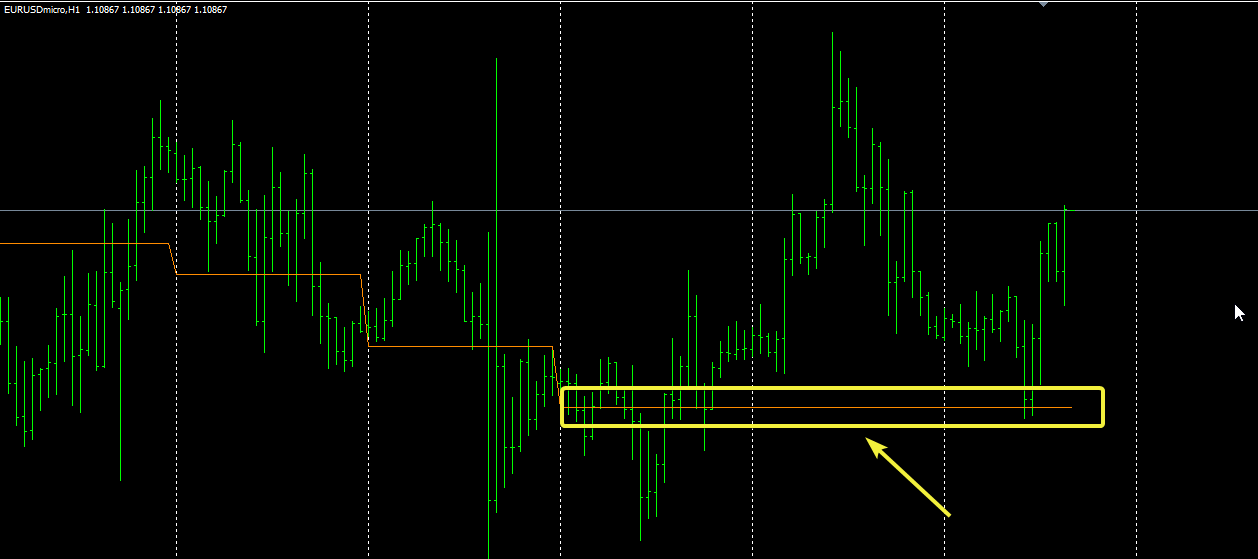
I'm trying to display an Custom Indicator on an EA with a period H1 a line with the previous day Pivot Point, this seems to work for past days when the EA starts, but for new candles I always get the same values
Here is my code, I know it must be some simple concept I don't understand
And this is my debug log, as you can see until line 5 everything is ok, these are the candles that were already on chart, from that always the same resultsCans someone enlight me for what I'm doing wrong?
Thank you in advance