Calculation of Angles (Implemented for CCI indicator)
Augustine Kamatu: on angles of the CCI
indicator.
-
There is no angle from 2 anchor
points. An angle requires distance divided by distance; a unitless
number. A chart has price/time. What is the angle of going 30 miles in 45
minutes? Meaningless!
-
You can get the slope from a trendline. Delta price / delta time. Changing the
axes scales changes the apparent angle, the slope is constant. Angle is
meaningless.
-
You can create a angled line using one point and setting the angle (Object
Properties - Objects Constants - Standard Constants, Enumerations and
Structures - MQL4 Reference.)
The line is drawn that angle in pixels. Changing the axes scales does NOT change
the angle (and thus is meaningless.)
-
If you insist, take the two price/time coordinates, convert them to pixel
coordinates and then to apparent angle with arctan.
How to get the angle of a trendline and place a text object to it? - Trend Indicators - MQL4 and MetaTrader 4 - MQL4 programming forum - Page 2
whroeder1:
Thanks for your comments. Note that the calculations are meant for angles created by an indicator not by objects drawn by the user. The angle on its own is meaningless it requires support from other indicators and a lot of judgement by the user. The angles are computed at the highest zoom level of the chart and are therefore constant regardless of of the current zoom level.
-
There is no angle from 2 anchor
points. An angle requires distance divided by distance; a unitless
number. A chart has price/time. What is the angle of going 30 miles in 45
minutes? Meaningless!
-
You can get the slope from a trendline. Delta price / delta time. Changing the
axes scales changes the apparent angle, the slope is constant. Angle is
meaningless.
-
You can create a angled line using one point and setting the angle (Object
Properties - Objects Constants - Standard Constants, Enumerations and
Structures - MQL4 Reference.)
The line is drawn that angle in pixels. Changing the axes scales does NOT change
the angle (and thus is meaningless.)
-
If you insist, take the two price/time coordinates, convert them to pixel
coordinates and then to apparent angle with arctan.
How to get the angle of a trendline and place a text object to it? - Trend Indicators - MQL4 and MetaTrader 4 - MQL4 programming forum - Page 2
You are missing trading opportunities:
- Free trading apps
- Over 8,000 signals for copying
- Economic news for exploring financial markets
Registration
Log in
You agree to website policy and terms of use
If you do not have an account, please register
The following discussion has been based on angles of the CCI indicator.
The challenge with calculation of angles is that the x coordinates are measured in time units while the y coordinates are in price points or in this case is CCI value points.
To overcome this challenge, both x and y coordinates have to be in the same units of measurements. In order to achieve this, it has to be calculated using a graphical approach.
Let us define a box measured in pixels. A pixel is the smallest unit of a digital image or graphic that can be displayed and represented on a digital display device. Pixels are combined to form a complete image. If we know the positions of three CCI readings, we can define a triangle with all measurements in the same unit. Consider a three point CCI which has formed a V shape as per the diagram below:
In the diagram above, the CCI moved from point X1 to X2 then to X3 implying a possibility of the beginning of an uptrend. We will now calculate all the angles in red.
Using Pythagorean’s theory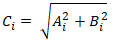 for
i=1,2 and 3
for
i=1,2 and 3
Based on the laws of trigonometry, for Y6, Y3 and Y4: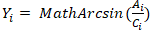
And so therefore;
Note that angle Y2 in this case would be the angle of Tilt.
A similar approach has been implemented for the down trend for the indicator referred to as Angles of CCI with 4 lines; Angle1, Angle2, Angle3 and Tilt.
https://www.mql5.com/en/market/product/37059#description
Note: