Indicators: Doda-Trend
Thankyou very much Gopal!
May I know how you are calculating the market is in trend or trading phase.
Regards
Mayank Saini
I've included the source code here. Just google the terms ATR and standard deviation and you'll be able to understand.
Hope it will help you.
DodaCharts
hmmm.
i have recodet your indicator to allow visual backtesting...
doesn't look that good...
//+------------------------------------------------------------------+
//|                                                 TrendOrRange.mq4 |
//|                                                                  |
//|                                       when-money-makes-money.com |
//+------------------------------------------------------------------+
#property copyright ""
#property link      "when-money-makes-money.com"
#property indicator_chart_window
#property indicator_buffers 2
#property indicator_color1 Green
#property indicator_color2 Red
//---- buffers
double buf1[];
double buf2[];
//+------------------------------------------------------------------+
//| Custom indicator initialization function                         |
//+------------------------------------------------------------------+
int init()
  {
//---- indicators
   SetIndexStyle(0,DRAW_HISTOGRAM,STYLE_SOLID,5);
   SetIndexBuffer(0,buf1);
   SetIndexStyle(1,DRAW_HISTOGRAM,STYLE_SOLID,5);
   SetIndexBuffer(1,buf2);
//----
   return(0);
  }
//+------------------------------------------------------------------+
//| Custom indicator deinitialization function                       |
//+------------------------------------------------------------------+
int deinit()
  {
//----

//----
   return(0);
  }
//+------------------------------------------------------------------+
//| Custom indicator iteration function                              |
//+------------------------------------------------------------------+
int start()
  {
   int    counted_bars=IndicatorCounted();
//----
   for(int i=Bars-counted_bars-1;i>=0;i--){
      if(iATR(Symbol(),Period(),14,i)>iStdDev(Symbol(),Period(),14,0,MODE_EMA,PRICE_CLOSE,i)){
         buf1[i]=Low[i];
         buf2[i]=High[i];
      }else{
         buf1[i]=High[i];
         buf2[i]=Low[i];
      }
   }
//----
   return(0);
  }
//+------------------------------------------------------------------+
Hello,
I've already mentioned that this indicator is not to take buy or sell signals. It only shows whether the market is trending or not. Just check it on higher-time frame H4 and reply back.
Thanks
Ohhh nice I may add this to my trend EA instead of using old stochastic crap to find trends. Thanks for the source too :)
Hello,
I've already mentioned that this indicator is not to take buy or sell signals. It only shows whether the market is trending or not. Just check it on higher-time frame H4 and reply back.
Thanks
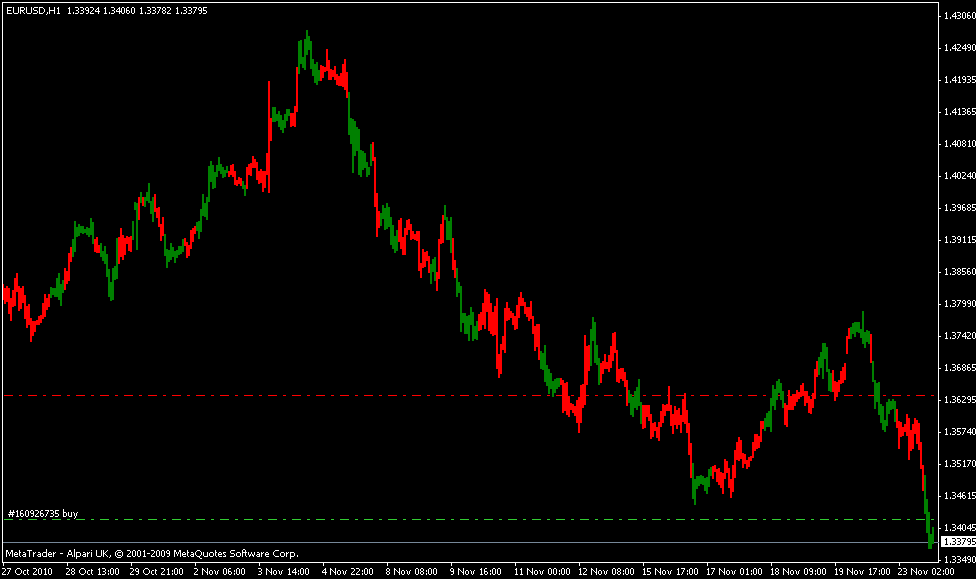
The green/red bars on my screenshot do not specify buy or sell signals. According to your indicator Red bars mean ranging and Green bars mean trending..
actually i works good if you know that i might signal a new type of market late. but it will mark ranging periods in the past. maybe good for a range breakout system ;)
- Free trading apps
- Over 8,000 signals for copying
- Economic news for exploring financial markets
You agree to website policy and terms of use
Doda-Trend:
Author: gopal krishan doda