Upcoming Article on generating Non-Standard charts (such as Renko), using MT5’s “Custom Symbols” (similar to “Offline Charts” in MT4).
Yes there is doubt that a generated chart from historic data looks different then one slowly generated on live feed tick after tick.
This makes the generated charts look good while in reality there was a lot of chopping going on.
Sorry, but I am not really sure I understand your post correctly! Can you elaborate and explain your statement please?
Are you saying that "Custom Symbol" data will not correctly reflect the OHLC bar data generated to it?
If so, let me clarify, that all "generated" OHLC data is exactly 100% matched when viewed on the M1 Chart of the "Custom Symbol" because that is the "seed" time-frame on which it bases all the higher time frames. Obviously, if you then look at the higher time-frames, which are just scaled-up from the M1 data, it will then not look accurate, because we are generating non-standard charts that are not time-based. Only the M1 chart is to be used as "valid" even if the average bar duration is of a much longer time. The other possible time-frames that "Custom Symbols" offers, are to be ignored as they are non-nonsensical due to the fact that the passage of time is variable in nature for most non-standard charts like Renko, Range Bars, 3-Line Break, etc.
Is this what you are getting at?
EDIT: Or are you perhaps referring to the difference of non-standard charts based on M1 data in comparison to those generated on Tick data?
If so, then that is obviously self-evident that they will always differ because of the granularity of the source data used and this holds true especially for MT4 "Offline Charts" as MT4 does not offer historical tick data access. In MT5 however, since Tick Data History is available, one can generate the chart solely on Tick data and not need to mix them as is done in MT4.
Great idea.
Hope to see your article ASAP.
I shared a library for showing back-testing equity by offline chart.
https://www.mql5.com/en/code/19439
If possible, please provide a library for MT5 back-testing with the same function I shared above.
Thank you.

- votes: 2
- 2017.11.20
- Ziheng Zhuang
- www.mql5.com
The Article will be based on the Renko chart generation to the "Custom Symbol". I will leave it up to you to use that knowledge (and the example code) to make such a library.
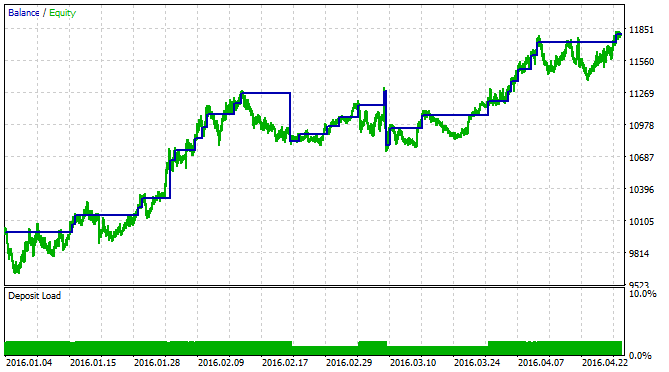
However, I don't see a great need for it, because the MT5 Strategy Tester already provides a good Equity Chart display that is based on time (as apposed to "trades" on MT4).
Ola fernando...
seria muito bom termos isso para o MT5, pois um offline chart que possibilite o renko funcionar de verdade seria muito bom para a comunidade do mt5...
"seria muito bom termos isso para o MT5, pois um offline chart que possibilite o renko funcionar de verdade seria muito bom para a comunidade do mt5..."
Yes, that is the point of the code and the article - to provide the equivalent functionality that most MT4 users are already used to, allowing traders to use whichever indicators they wish on non-standard charts.
...
EDIT: If I notice that there is very little interest in this subject, I will instead just publish the code in the CodeBase and not spend time on writing a full article.
Not sure you can draw such conclusions from a topic on the forum. I think if you publish an article there will be a lot of interest on this topic.
I suppose you already contacted an admin about your project ?
Not sure you can draw such conclusions from a topic on the forum. I think if you publish an article there will be a lot of interest on this topic.
I suppose you already contacted an admin about your project ?
No! Is there a need to do that? According to the instructions, there is only a recommendation to first publish a draft plan of the article, but it is not mandatory! Besides, even if it is not approved, I can always just publish it as a Blog post.
Sorry, but I am not really sure I understand your post correctly! Can you elaborate and explain your statement please?
Are you saying that "Custom Symbol" data will not correctly reflect the OHLC bar data generated to it?
If so, let me clarify, that all "generated" OHLC data is exactly 100% matched when viewed on the M1 Chart of the "Custom Symbol" because that is the "seed" time-frame on which it bases all the higher time frames. Obviously, if you then look at the higher time-frames, which are just scaled-up from the M1 data, it will then not look accurate, because we are generating non-standard charts that are not time-based. Only the M1 chart is to be used as "valid" even if the average bar duration is of a much longer time. The other possible time-frames that "Custom Symbols" offers, are to be ignored as they are non-nonsensical due to the fact that the passage of time is variable in nature for most non-standard charts like Renko, Range Bars, 3-Line Break, etc.
Is this what you are getting at?
EDIT: Or are you perhaps referring to the difference of non-standard charts based on M1 data in comparison to those generated on Tick data?
If so, then that is obviously self-evident that they will always differ because of the granularity of the source data used and this holds true especially for MT4 "Offline Charts" as MT4 does not offer historical tick data access. In MT5 however, since Tick Data History is available, one can generate the chart solely on Tick data and not need to mix them as is done in MT4.
I mean i have seen some Renko's that used for example bar open or close only and they draw a much different pattern then when high, and low are included.
Indeed tick will solve this issue which should become visible immediately when compared to old skool techniques.
I mean i have seen some Renko's that used for example bar open or close only and they draw a much different pattern then when high, and low are included.
Indeed tick will solve this issue which should become visible immediately when compared to old skool techniques.
EDIT: The main aim of the Article is the introduction of non-standard charts using “Custom Symbols” and not so much how to calculate accurate tick-based Renko for which I will leave for another time.
- Free trading apps
- Over 8,000 signals for copying
- Economic news for exploring financial markets
You agree to website policy and terms of use
I’m currently writing “open source” code for another user on the forum to generate Renko charts using MT5’s “Custom Symbols”, so I decided to document the procedure and to submit it as an Article to be published here as soon as I have completed writing it.
The article will describe how to generate these non-standard charts using “Custom Symbols”, which share some similarity to “Offline Charts” in MT4, but are much more intricate. I will be providing source code, in the form of an Indicator, to generate variations of Renko charts. I will also be explaining how to use these “Custom Symbols” charts during live trading, as well as how EAs can be used on them. These techniques can then be used by other developers for other non-standard charts, such as Range Bars, Volume Bars, 3-Line Break, etc.
Since this is a relatively new feature of MetaTrader v5, for which there is very little information available for “newbies” and even for the average coders, I would like to address in the Article any questions or doubts that users may have.
So, should anyone be interested, please leave your queries here on this thread and I will try to elaborate on some of them in more detail in the article being prepared.
Many thanks and best regards,
Fernando
EDIT: If I notice that there is very little interest in this subject, I will instead just publish the code in the CodeBase and not spend time on writing a full article.