Discussion of article "A New Approach to Interpreting Classical and Hidden Divergence"
Thanks very much for this article. Is there any way that anyone can code the indicator for mq4 ?
New article A New Approach to Interpreting Classical and Hidden Divergence has been published:
Author: Alexander Lasygin
There is a basic version for MT 4. It differs from the one described in the article because it is based on Accelerator and FTLM. For the article, at the request of the moderator, a replacement was made.
I like the New Approach you have taken using the AO indicator. I am a big fan of OBV and volume generally. I am looking for something like your new approach to supplement my Wyckoff trading.
Does the “New Approach” also work with OBV, i have done a bit of checking on past data but cant seem to get it to work. Let me know if you have had success and i will persevere.
Your article is very well written, like your style.
Thanks
Paul
Hi Paul. I am also very interested in volumes. In my opinion, this is one of the main drivers of the market. I am familiar with the OBV indicator. Experimenting with it. In this approach, it gives a lot of false signals. I would prefer it a smoothed Money Flow Index.
Hi Paul. I am also very interested in volumes. In my opinion, this is one of the main drivers of the market. I am familiar with the OBV indicator. Experimenting with it. In this approach, it gives a lot of false signals. I would prefer it a smoothed Money Flow Index.
Hi Alex, apologies for reply delay, i have been away.
There is a variant of OBV called Gadi_obv (attached) which is supposed to give better "signals" but not so sure, i keep both and "Accumulation/Distribution [AD]" indicator on my MT4 but find the basic OBV to be best. AD, whilst you would expect it to be more accurate i find to be way off, but if all three in same direction odds are better.
OBV i find to be good at confirming a top. Once you hit a price peak then reverse and on to another price peak, if OBV does not match the prior peak there is a good chance of a reversal
<ex4 file deleted>Hi Paul. I am also very interested in volumes. In my opinion, this is one of the main drivers of the market. I am familiar with the OBV indicator. Experimenting with it. In this approach, it gives a lot of false signals. I would prefer it a smoothed Money Flow Index.
Alex
Still making use of your work, finding it to be most successful method for trading I have come across.
-1. Question, 2 observations and some notes I have made.
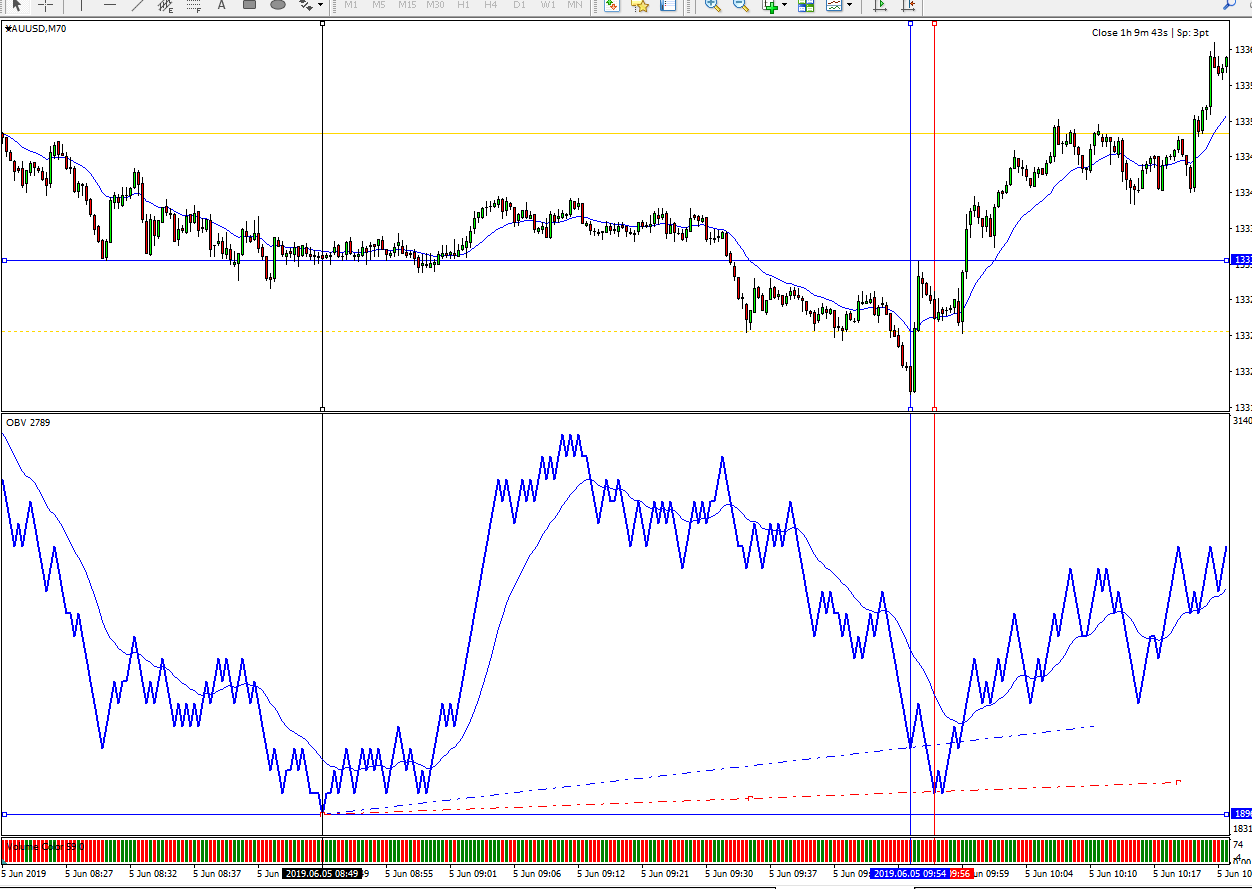
1. Question, see attached "file 1"
The vertical black line shows a low in OBV. Vertical blue line a low in price and red a low in OBV.
Obviously there is regular divergence here (and many other points of divergence not mentioned)
My question is which is correct? It may be that both are but your thought appreciated. Do I take my lead from the blue line low in price, or red low in OBV to mark up the regular divergence?
2. Observations
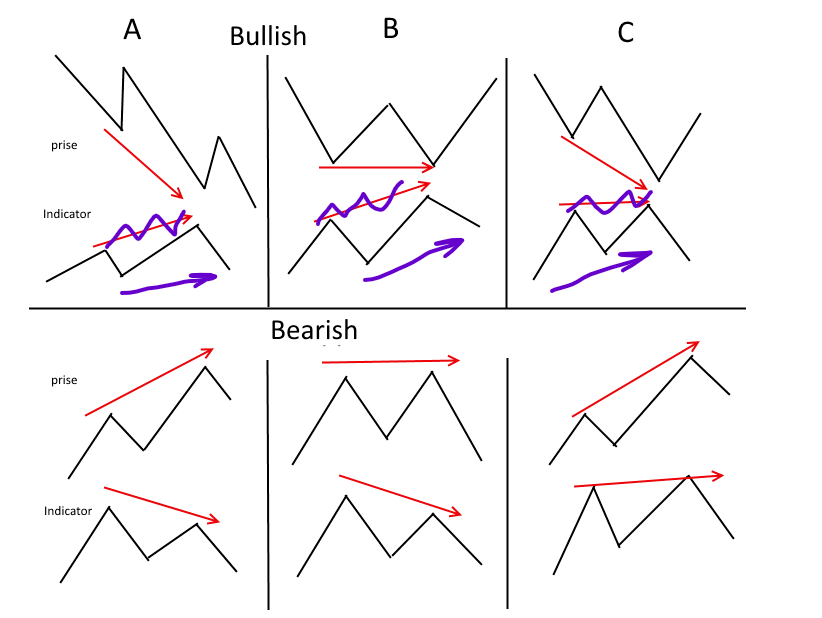
2.1 Types of divergence chart see attached "file 2". I may be wrong, and if I am please let me know because if so I have a fundamental misunderstanding!
I think the bullish chart shows the indicator divergence arrows wrong being over the indicator rather than under as shown in purple.
2.2. I have been using constant volume tick charts (from FXBlue), I am finding that OBV divergence shows up much better. If you want anything on this let me know, besides this I use a ten second chart to show more clearly testing to identify readiness for a move or continuation of a trend, i dont use the ten second chart for divergence, not as good and to much noise. For setup see https://www.youtube.com/watch?v=2lOT4Q9iGfw&t=8s skip to 2:10 for instructions on setup.
3. My observations so far, see link, this is very much work in progress, any comments appreciated, hope you find it useful. See page 11 for comparison of divergence in M5 compared to 70 point tick chart, shows it up well. Was unable to upload pdf so link attached with comments able to be made.
https://docs.google.com/document/d/1mQohFNj5pt1L4rM9p8dkXObbeTUPhctJ0tYCO_rjagA/edit?usp=sharing
all the best, Paul
- Free trading apps
- Over 8,000 signals for copying
- Economic news for exploring financial markets
You agree to website policy and terms of use
New article A New Approach to Interpreting Classical and Hidden Divergence has been published:
The article considers the classical method for divergence construction and provides an additional divergence interpretation method. A trading strategy was developed based on this new interpretation method. This strategy is also described in the article.
Hidden Divergence
In this figure, we can clearly see the upward market, but MACD has formed a new low, which is not confirmed by the price chart. This discrepancy hints at the presence of a hidden bullish divergence and indicates the strengthening of uptrend.
Author: Alexander Lasygin